Custom Pivots MT5
- Indicatori
- Tsvetan Tsvetanov
- Versione: 1.0
- Attivazioni: 6
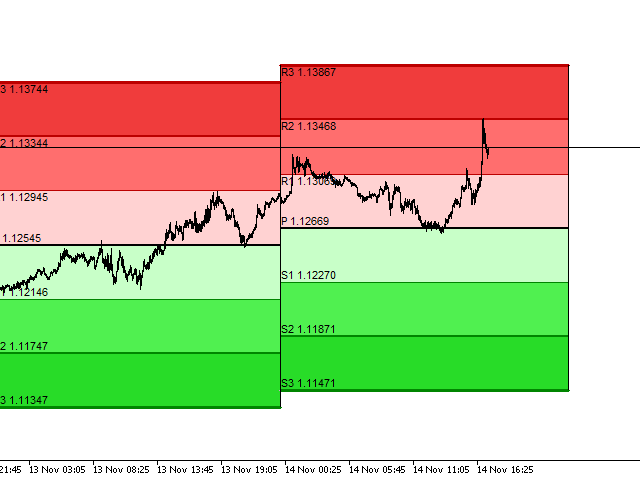
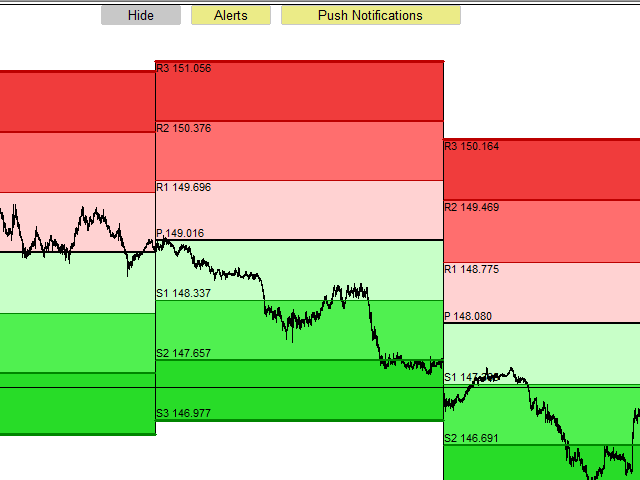
Pivots Points are significant levels traders can use to determine directional movement, support and resistance. Pivot Points use the prior period's high, low and close to formulate future support and resistance. In this regard, Pivot Points are predictive and leading indicators.
Pivot Points were originally used by floor traders to set key levels. Floor traders are the original day traders. They deal in a very fast moving environment with a short-term focus. At the beginning of the trading day, floor traders would look at the previous day's high, low and close to calculate a Pivot Point for the current trading day. With this Pivot Point as the base, further calculations were used to set support 1, support 2, resistance 1 and resistance 2. These levels would then be used to assist their trading throughout the day.
Pivot Points are one of the simplest and oldest tools for technical analysis. Today traders from all over the world successfully incorporate Pivot Points in their strategies. However, this popular professional tool is not included by default in MetaTrader 5. That's why I decided to create good and affordable Pivot Points indicator for MetaTrader 5. This indicator offers wide range of options for personal customization.
Main Features
- Multiple types of calculation for the levels.
- Automatic vertical scaling of the chart with adjustable scaling ratio.
- Adjustable time frames.
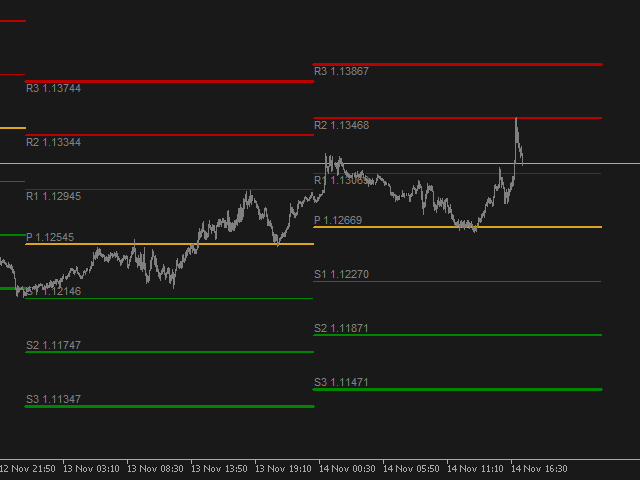
- Extensive options for visual customization.
- Alerts and Push notifications.
- Quick button to temporarily hide or show the indicator.
- The indicator works in the strategy tester.
In short, this is one of the best Pivot Points indicators available for MetaTrader 5. Simple professional tool which deserves to be in your toolbox.
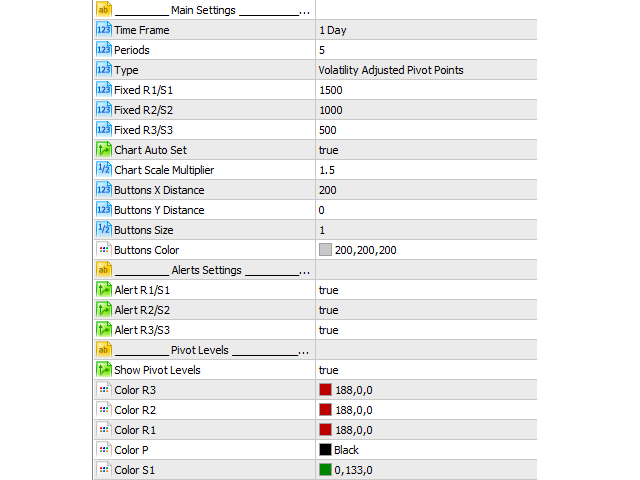
Indicator Settings
- Main Settings
- Time Frame.
- Periods - number of time frame periods.
- Type - type of calculation. (Standard, Fibonacci, Volatility Adjusted, Fixed)
- Chart Auto Set - automatic chart configuration.
- Chart Scale Multiplier - vertical chart scaling.
- Buttons Settings and colors.
- Alerts Settings
Enable/disable alerts for different levels.
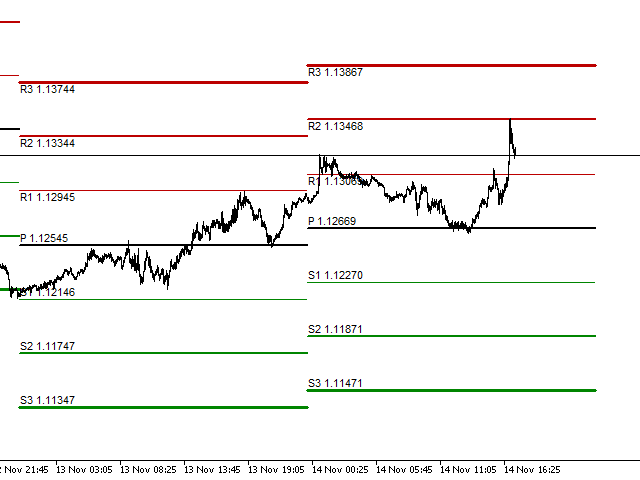
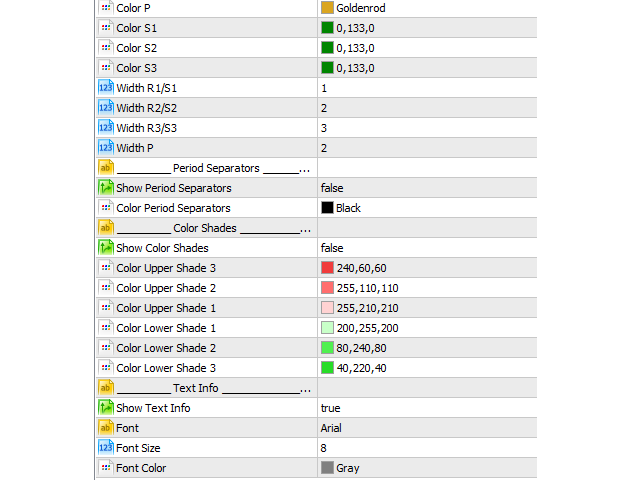
- Pivot Levels
- Show Pivot Levels - true/false.
- Colors and Width settings.
- Period Separators
- Show Period Separators - true/false.
- Color.
- Color Shades
- Show Color Shades - true/false.
- Colors.
- Text Info
- Show Text Info - true/false.
- Font.
- Font Size.
- Font Color.
If you have some questions or if you need help, contact me via Private Message.


Amazing indicator. The best pivot indicator I've found so far. All it needs is the ability to select higher time frames like quarterly and yearly. I highly recommend this indicator