Dashboard Stochastic Multicurrency
- Indicatori
- Taras Slobodyanik
- Versione: 6.50
- Aggiornato: 14 marzo 2024
- Attivazioni: 10
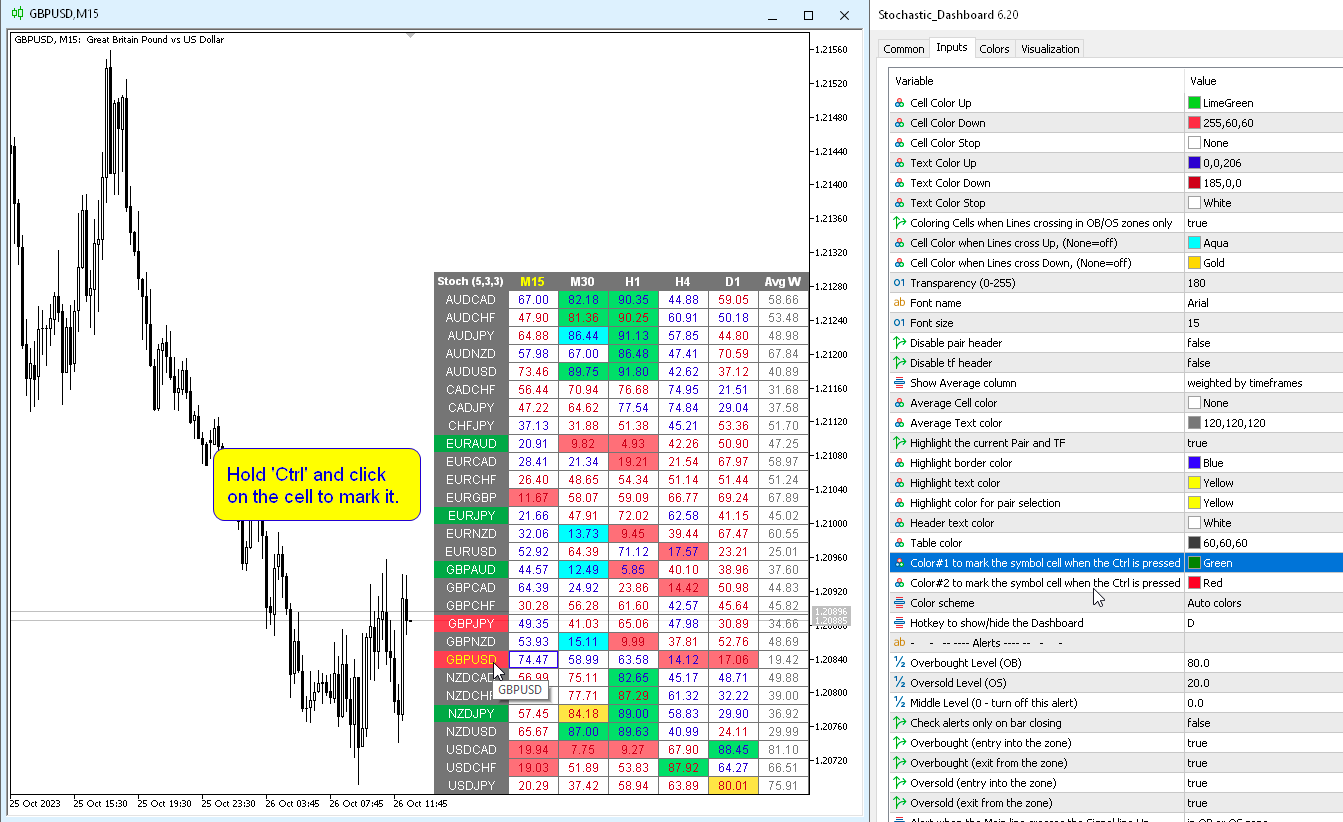
Multicurrency and multitimeframe modification of the Stochastic Oscillator. You can specify any desired currencies and timeframes in the parameters. The panel displays the current values and intersections of the lines — Signal and Main (stochastics crossover). Also, the indicator can send notifications when crossing overbought and oversold levels. By clicking on a cell with a period, this symbol and period will be opened. This is MTF Scanner.
The key to hide the dashboard from the chart is "D" by default.
Parameters
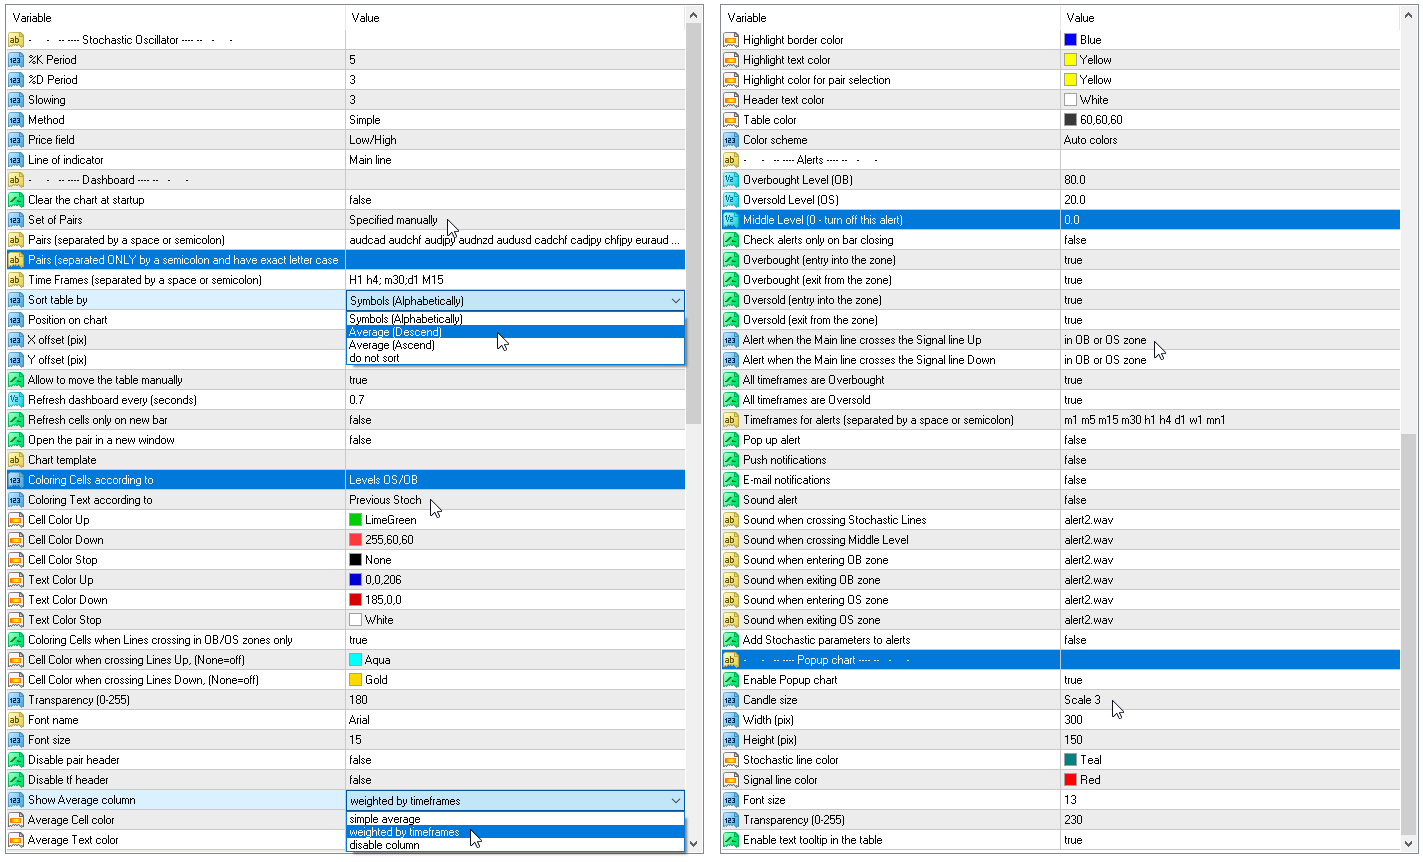
%K Period — the period of the K line.
%D Period — the period of the D line.
Slowing — slowing;
Method — method of averaging;
Price field — price type.
Line of indicator — line index.
Clear the chart at startup — clear the chart at startup.
Set of Pairs — set of symbols:
%D Period — the period of the D line.
Slowing — slowing;
Method — method of averaging;
Price field — price type.
Line of indicator — line index.
Clear the chart at startup — clear the chart at startup.
Set of Pairs — set of symbols:
— Market Watch — pairs from the "Market Watch".— Specified manually — pairs specified manually, in the parameters "Pairs".— Current pair — show only the current pair.
Pairs (separated by a space or semicolon) — list of symbols separated by spaces or semicolons. The currency names should be written exactly like the broker's, keeping the case and prefix/suffix.
Time Frames (separated by a space or semicolon) — list of timeframes separated by spaces or semicolons (multi timeframe).
Sort pairs — sorting the list of pairs.
Position on chart — corner to display the panel on the chart.
X offset (pix) — shift the panel along the X axis;
Y offset (pix) — shift the panel along the Y axis;
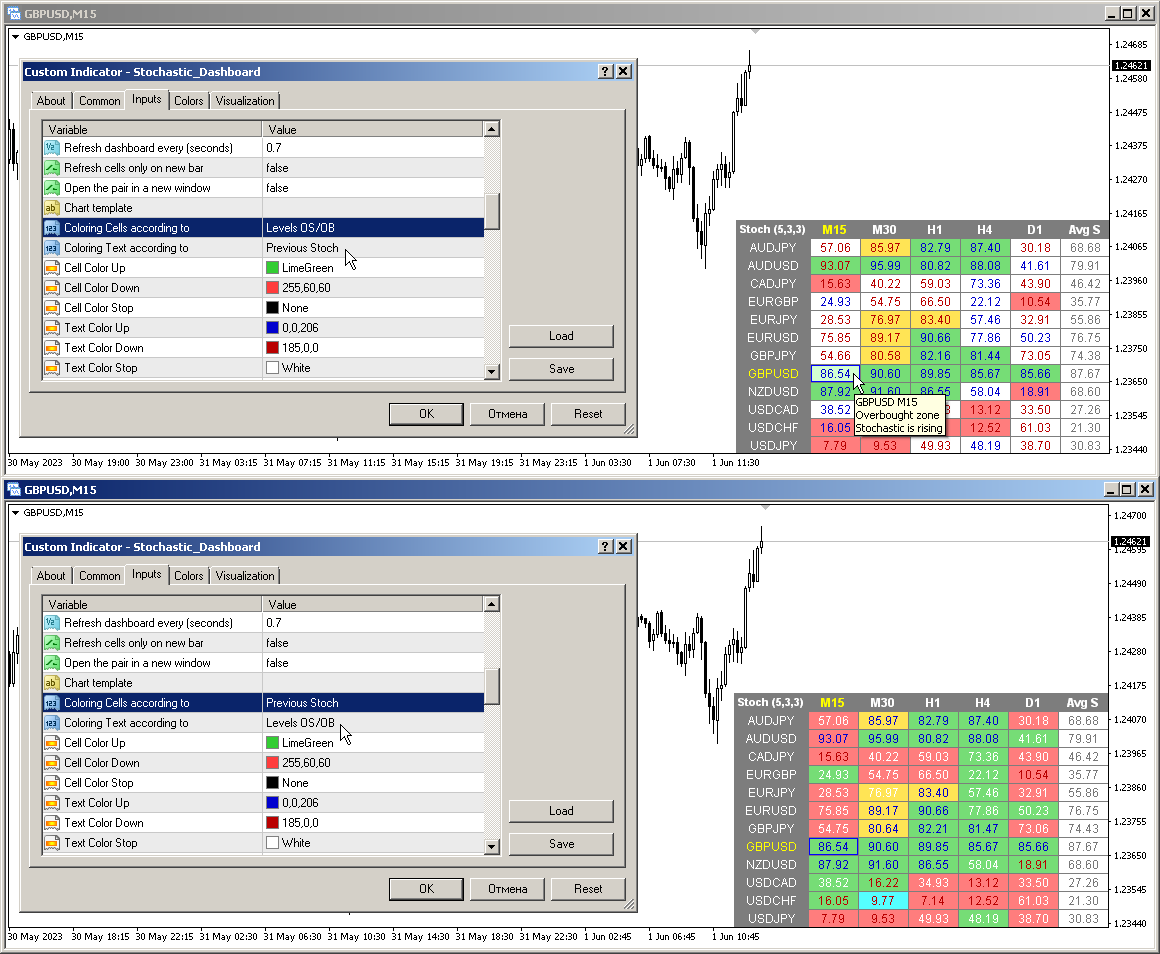
Refresh dashboard every (seconds) — update period for all pairs and timeframes.
Open the pair in a new window — open a symbol in a new chart window by clicking.
Chart template — the name of the template for the chart, if the chart opens in a new window.
Coloring the cells according to the — color of the table cells according to the overbought / oversold levels or according to the direction of the previous candle.
Check Lines crossing only in OB/OS zones — determine the intersection of Lines only in Overbought/Oversold zones.
Time Frames (separated by a space or semicolon) — list of timeframes separated by spaces or semicolons (multi timeframe).
Sort pairs — sorting the list of pairs.
Position on chart — corner to display the panel on the chart.
X offset (pix) — shift the panel along the X axis;
Y offset (pix) — shift the panel along the Y axis;
Refresh dashboard every (seconds) — update period for all pairs and timeframes.
Open the pair in a new window — open a symbol in a new chart window by clicking.
Chart template — the name of the template for the chart, if the chart opens in a new window.
Coloring the cells according to the — color of the table cells according to the overbought / oversold levels or according to the direction of the previous candle.
Check Lines crossing only in OB/OS zones — determine the intersection of Lines only in Overbought/Oversold zones.
Color settings
Color Up — cell color if the indicator increases or crossed overbought level.
Color Down — cell color if the indicator decreases or crossed oversold level.
Color Stop — cell color if the indicator does not change.
Color when crossing Lines Up — cell color when the Main line crosses the Signal line up.
Color when crossing Lines Down — cell color when the Main line crosses the Signal line down.
Transparency (0-255) — transparency of the panel.
Font name — font name.
Alerts
Overbought level — overbought level for alerts.
Oversold level — oversold level for alerts.
Middle Level (0 — turn off this alert) — third level crossing check (alert only). If zero is specified, checking for this level is disabled.
Check alerts only on bar closing — check alerts only when the bar is closed.
Overbought/Oversold (entry into the zone) — send alert when entering the overbought or oversold zone.
Overbought/Oversold (exit from the zone) — send alert when leaving the overbought or oversold zone.
Main line crosses the Signal line Up — alert when the Main line crosses the Signal line up.
Main line crosses the Signal line Down — alert when the Main line crosses the Signal line down.
All timeframes are Overbought/Oversold — alert when all periods enter the overbought or oversold zone.
Timeframes for alerts (separated by a space or semicolon) — list of periods for which the alert will be sent (separated by a space or semicolon).
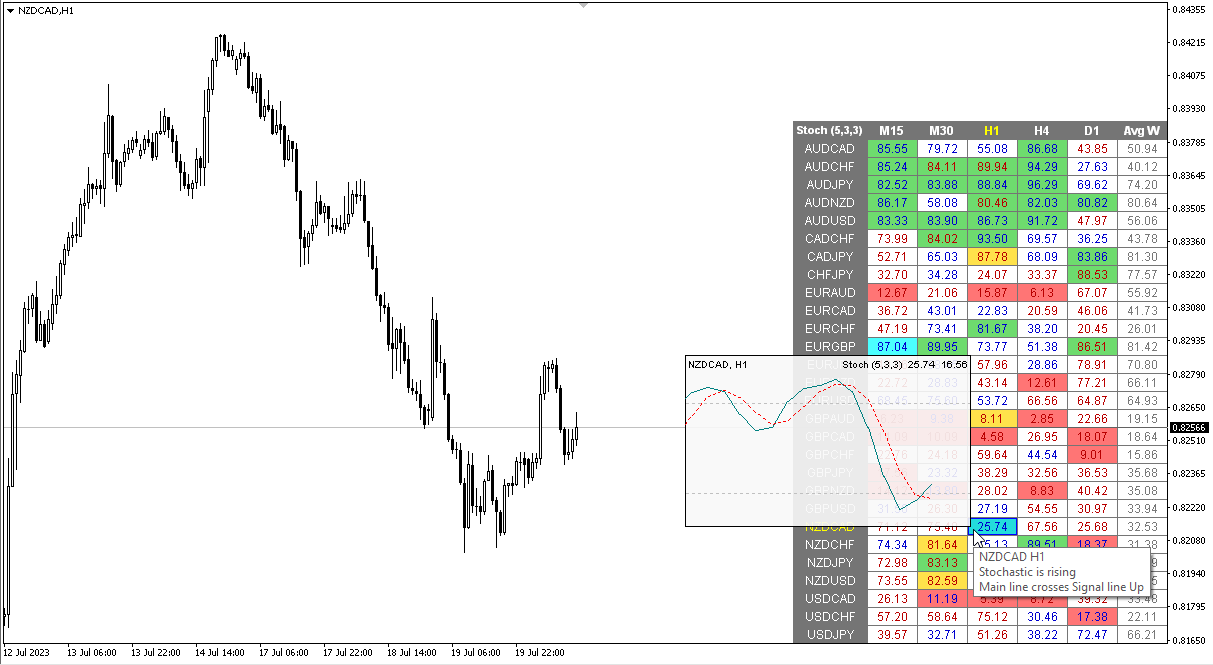
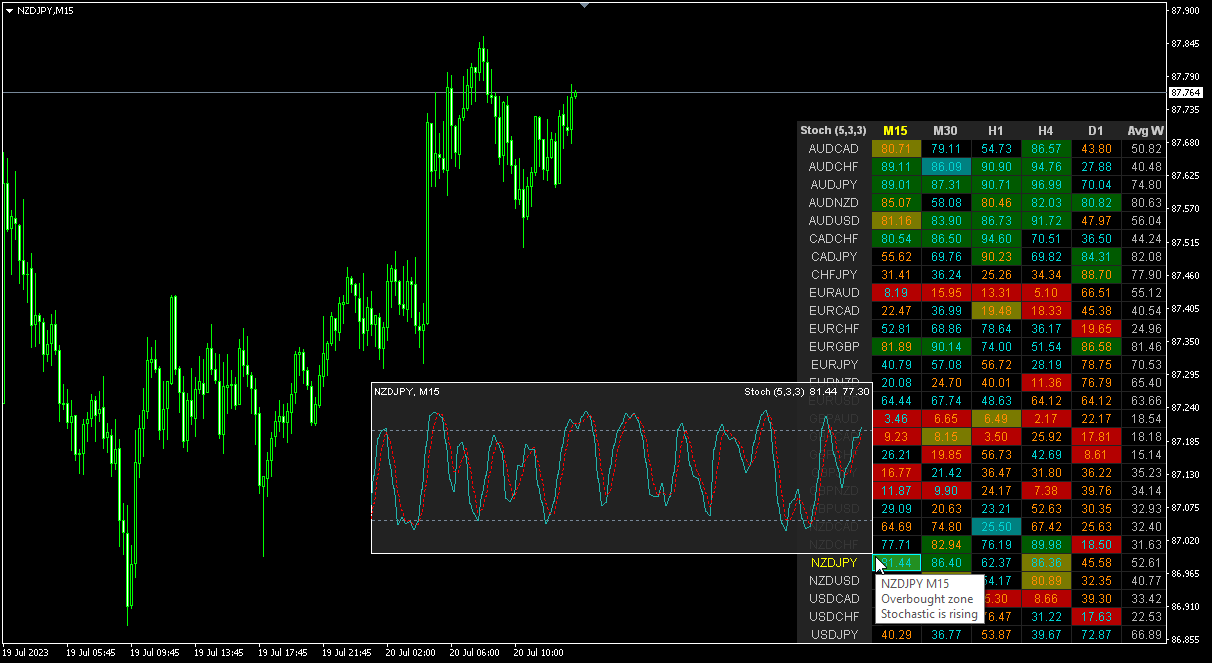
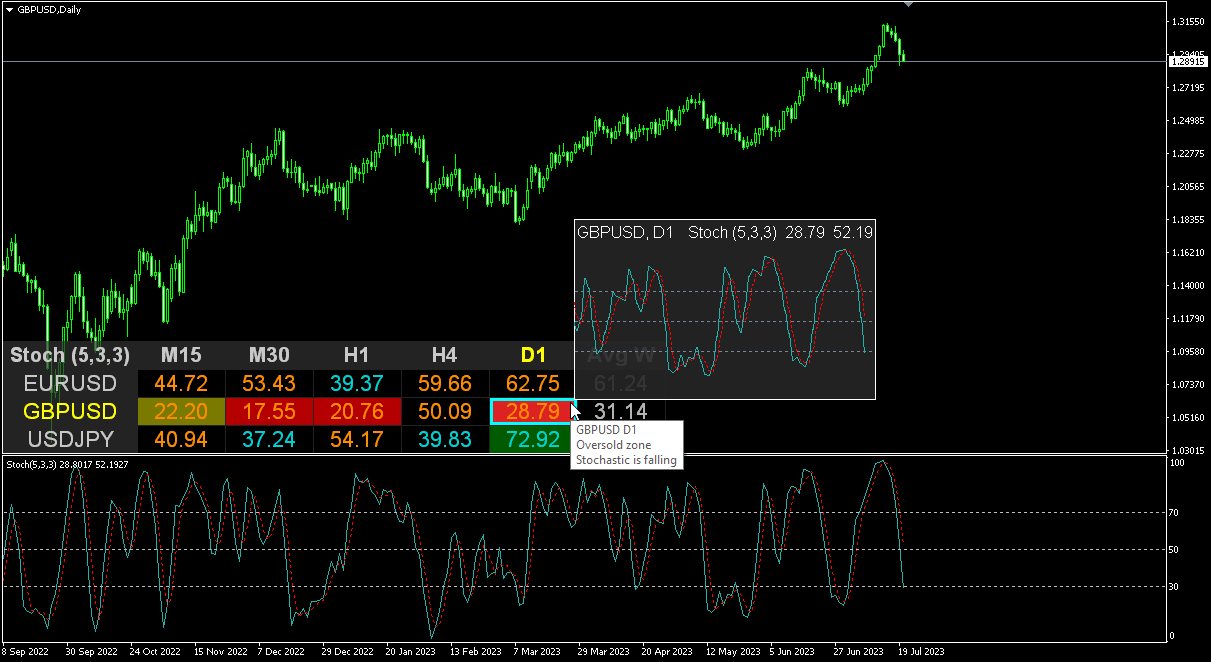


This is an _excellent_ tool. Very configurable, and worth every cent. The mouseover popup charts are a nice feature. In a perfect world, the popups might also display standard or HA candles, but the existing (2023) tool works great as-is. Thanks for your hard work to make this available.