Pivot Point MT5 Indicator by PipTick
- Indicatori
- Michal Jurnik
- Versione: 1.1
- Aggiornato: 1 dicembre 2021
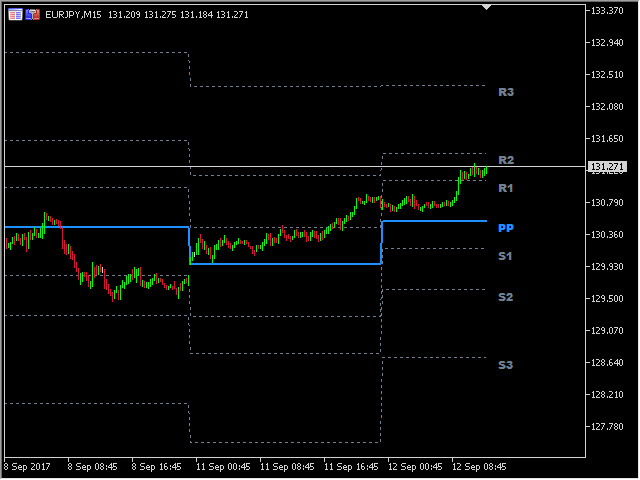
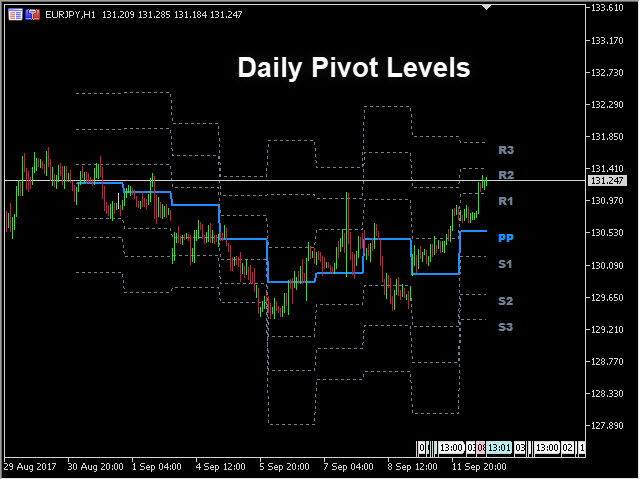
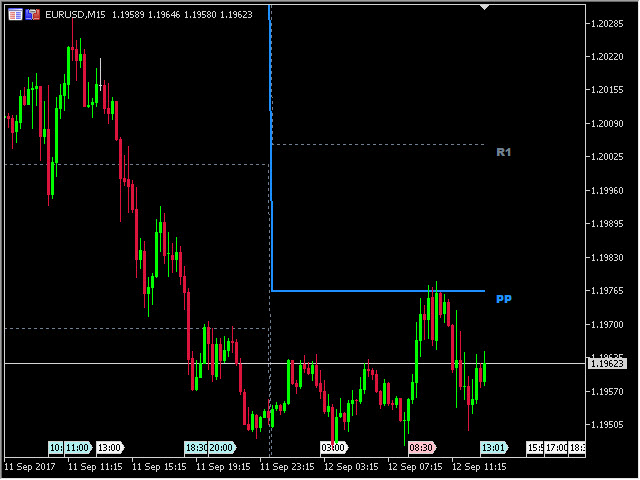
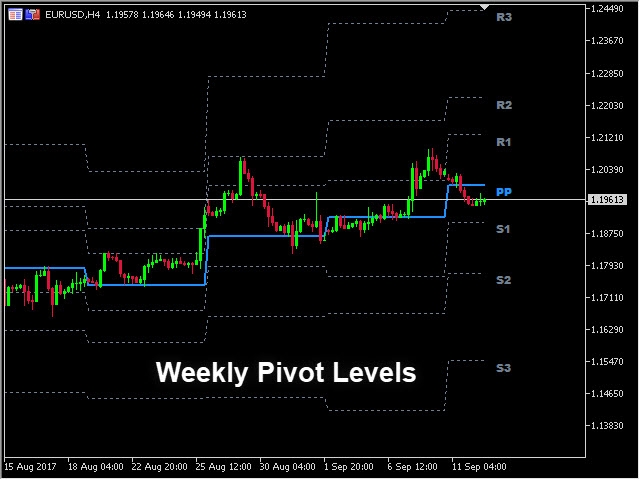
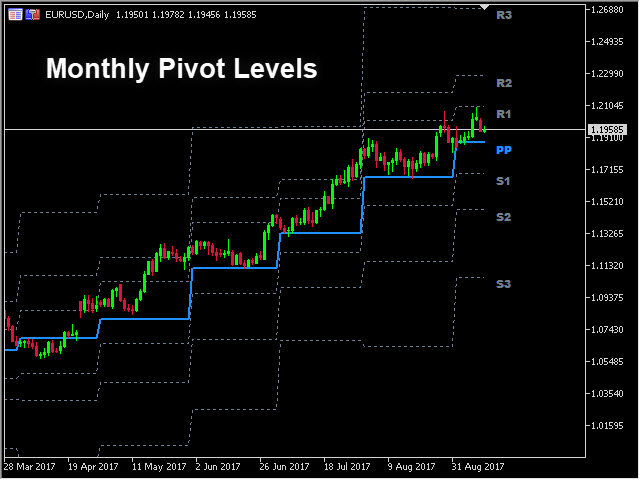
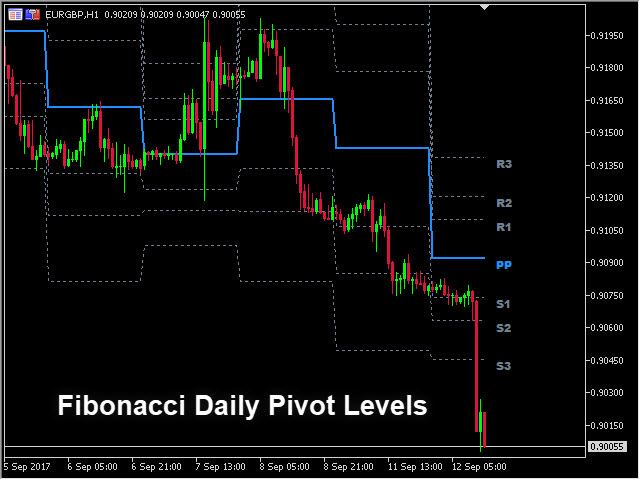
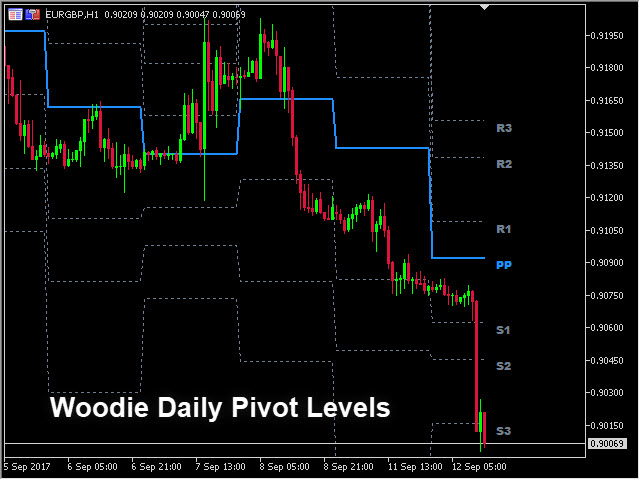
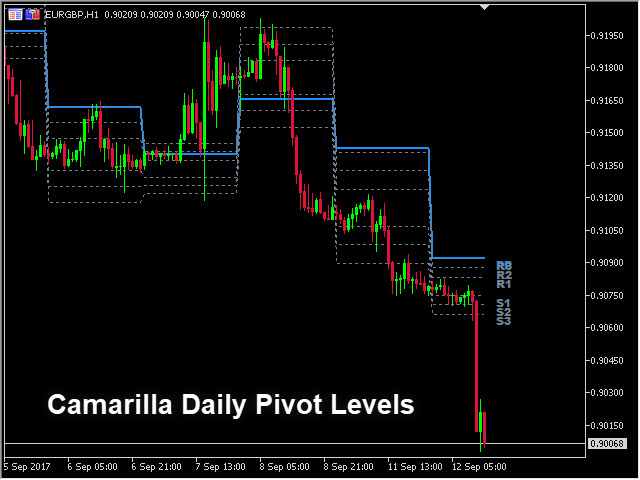
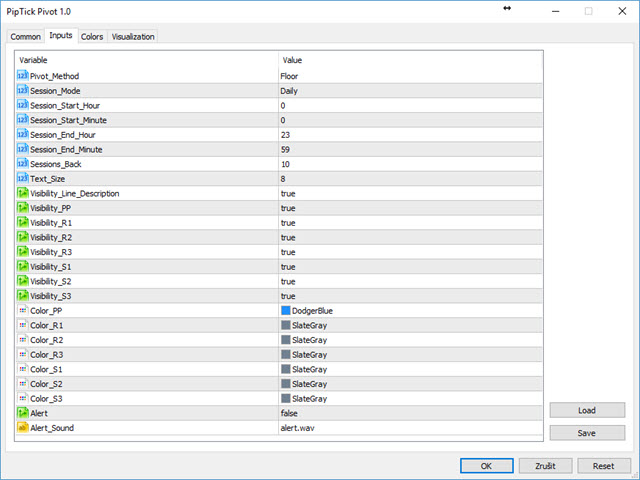
The Pivot Point indicator automatically calculates and displays the pivot point line and support and resistance levels. Pivot can be calculated according to the Classic, Floor, Fibonacci, Woodie, Camarilla or DeMark formula. It is also possible to select the period for calculating the indicator. A trader can choose from daily, weekly, monthly, or user-defined periods.
Types of pivots
- Classic
- Floor
- Fibonacci
- Woodie
- Camarilla
- DeMark
Main features
- The indicator shows the current and historical pivot point level
- Pivot support and resistance levels
- Alert notifications for indicator lines
- Custom session time
- Works on every timeframe (M1, M5, M15, M30, H1, H4, D1, W1, MN)
- The indicator is non-repainting
- Ready for backtesting
- Customizable parameters (Colors, Line thickness, Visibility...)
- High-speed calculation
- Available for MT4 and MT5


Great indicator - does exactly what it says - Thank You!!!