CoSMOS4U AdPivot MT5
- Indicatori
- COSMOS4U - D. Vezeris & Co, L.P.
- Versione: 1.10
- Aggiornato: 14 agosto 2017
- Attivazioni: 5
COSMOS4U Adaptive Pivot Indicator, is a straightforward and effective way to optimize your trade decisions. It can be easily customized to fit any strategy.
Get an insight into the following features, incorporated in COSMOS4U Adaptive Pivot:
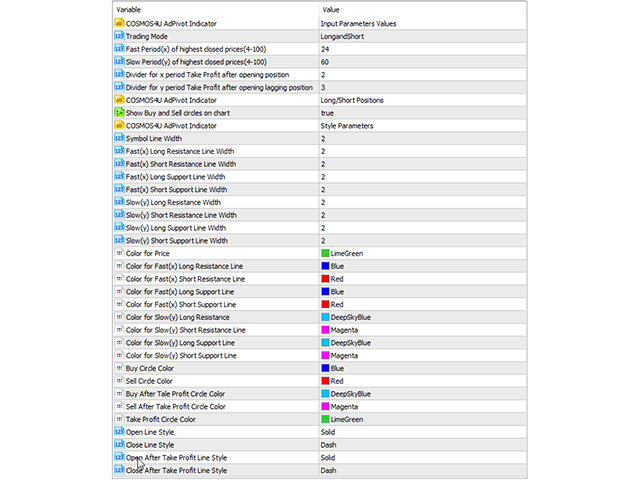
- Three ways of monitoring trades (Long, Short, Long and Short),
- Periods used to calculate high and low close prices in order to declare opening position before or after Take Profit,
- All timeframes supported (M1, M15, H1, H4, D, W, M…),
- All symbols,
- Colors for all components,
- Style, type and width of lines, positions and levels
It is a very unambiguous indicator, making the most of its buy and sell signals, enhanced with taking profit opportunity.
Function of COSMOS4U AdPivot
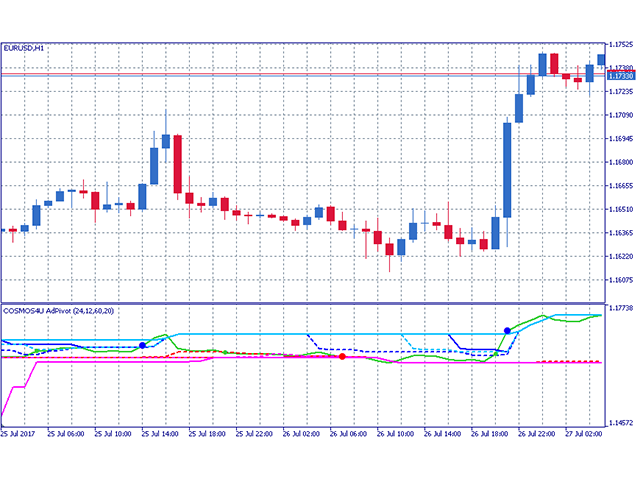
The COSMOS4U AdPivot (x,x/divisor,y,y/divisor) generates buy and sell signals.
It is a collection of price levels that are calculated based on the close prices. It is the presentation of pivot points based on the close price levels excluding the high and low fluctuations.
Based on the fast parameter x, four timeseries are displayed:
- The first is formed by the maximum value resulting from the previous x values
- The second is formed by the minimum value resulting from the previous x values
The other two timeseries, use a divisor of the x parameter. In other words,
- the third is formed by the maximum value resulting from the previous x/divisor values
- the fourth is form by the minimum values resulting from the previous x/divisor values
Similarly to the slow parameter y, four time series are displayed:
- The first is formed by the maximum value resulting from the previous y values
- The second is formed by the minimum value resulting from the previous y values
The other two timeseries, use a divisor of the y parameter. In other words,
- the third is formed by the maximum value resulting from the previous y/divisor values
- the fourth is form by the minimum values resulting from the previous y/divisor values
Making decisions with COSMOS4U AdPivot
The COSMOS4U AdPivot (x,x/divisor,y,y/divisor) is equipped with two systems. One with the x,x/divisor parameters and the second with the y,y/divisor parameters. In order the system to make correct decisions, should be x<y.
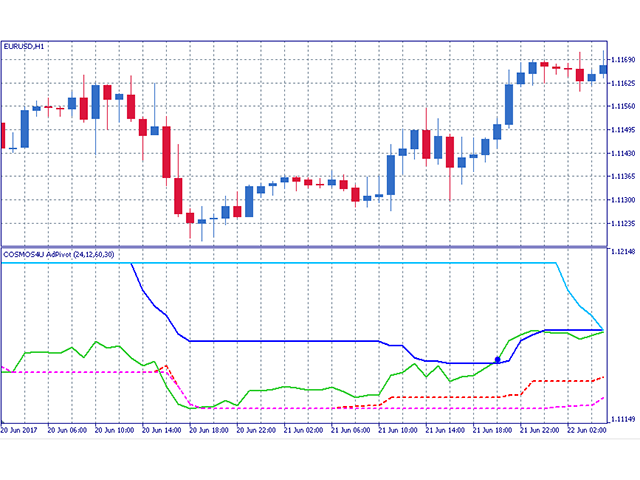
- The COSMOS4U AdPivot generates a buy signal when the price of the symbol crosses and moves upon the time series of f(x) based on the maximum value and Takes Profit when the price of the symbol crosses and moves below the f(x/divisor) based on the minimum value.
- A sell signal is generated when the price of the symbol crosses and moves below the f(x) based on the minimum values and Takes Profit when the price of the symbol crosses and moves upon the f(x/divisor) based on the maximum value.
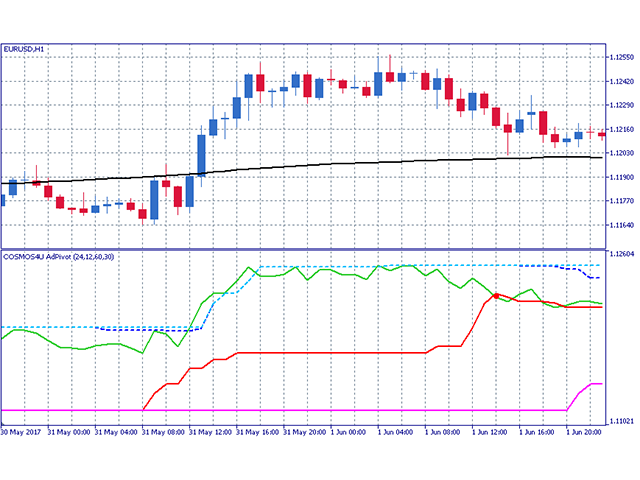
- A strong but lagged buy signal is generated when the price of the symbol crosses and moves upon the f(y) based on the maximum value. It is closed when the price of the symbol crosses and moves below f(y/divisor) based on the minimum value.
- A strong but lagged sell signal is generated when the price of the symbol crosses and moves below the f(y) based on the minimum prices. It is closed when the price of the symbol crosses and moves below the f(y/divisor) based on the maximum value.
Take Profit Signal Line to earn profits
- For long systems, the parameter x is the period for opening position by crossing the maximum close value and y is the period for opening position by crossing a lagged maximum close value. Thus x<y.
- For short systems, the parameter x is the period for opening position by crossing the minimum close price and y is the period for opening position by crossing a lagged minimum close value. Thus x<y.
Take Profit is done in a divided period of the x and y. For long systems, when the price of the symbol breaks downwards the x/divisor or y/divisor, it takes profit. For short system, when the price of the symbol breaks upwards the x/divisor or y/divisor, it takes profit.
The design of AdPivot
- The common values for x and y are 24 and 60 respectively.
- For the divisor is 2 or 3.
- The colors of the lines are:
- f(x)(max) - solid blue
- f(y)(max) - solid deep sky blue
- f(x/divisor)(min) - dashed red
- f(y/divisor)(min) - dashed magenta
- f(x)(min) - solid red
- f(y)(min) - solid magenta
- f(x/divisor)(max) - dashed blue
- f(y/divisor)(max)- dashed deep sky blue
Updates
Free for all the owners