AIS Advanced Grade Feasibility MT5
- Indicatori
- Aleksej Poljakov
- Versione: 1.1
- Aggiornato: 24 giugno 2022
- Attivazioni: 5
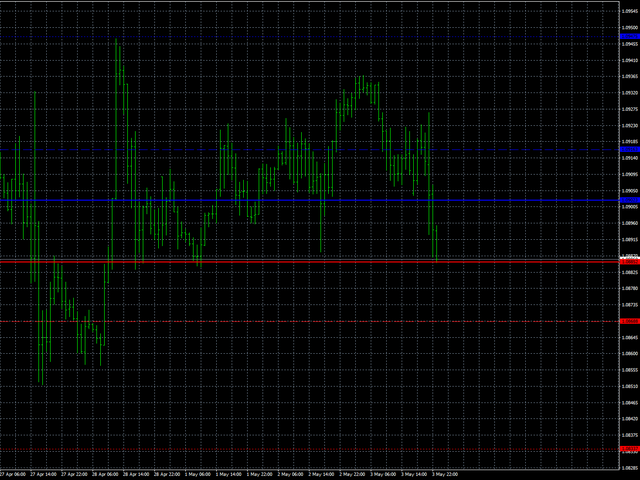
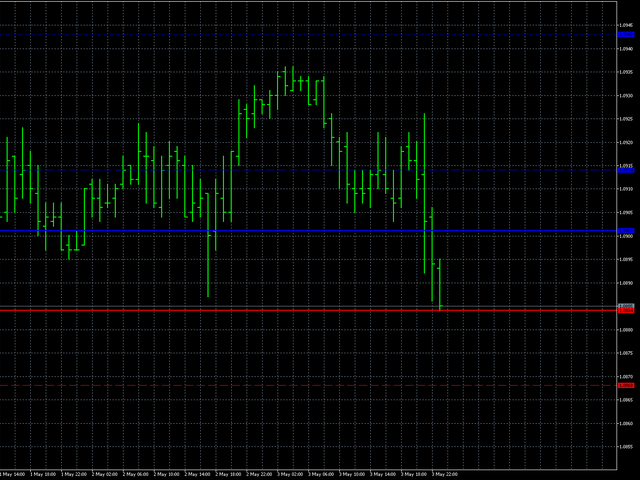
L'indicatore di fattibilità del grado avanzato AIS è progettato per prevedere i livelli che il prezzo potrebbe raggiungere in futuro. Il suo compito è analizzare le ultime tre barre e costruire una previsione basata su queste. L'indicatore può essere utilizzato su qualsiasi intervallo di tempo e qualsiasi coppia di valute. Con l'aiuto delle impostazioni, puoi ottenere la qualità desiderata della previsione.
Profondità di previsione: imposta la profondità di previsione desiderata in barre. Si consiglia di selezionare questo parametro entro 18-31.
Puoi andare oltre questi limiti. Ma in questo caso è possibile o "attaccare" i livelli di previsione (per valori inferiori a 18) o un'ampiezza eccessiva dei livelli (per valori maggiori di 31).
Livello di confidenza 1, Livello di confidenza 2 e Livello di confidenza 3 - livelli di confidenza previsti. Impostabile entro 1-99. Il livello di confidenza 1 dovrebbe essere maggiore del livello di confidenza 2 e il livello di confidenza 3 dovrebbe essere il più piccolo di tutti.
Ciascuno di questi livelli mostra la percentuale di probabilità che il prezzo raggiunga questo valore per il numero di barre determinato dal parametro Profondità di previsione.
Color lvl high e Color lvl low - consentono di selezionare i colori delle linee
Style lvl - permette di selezionare lo stile delle linee corrispondenti ai livelli
Larghezza lvl - imposta la larghezza delle linee corrispondenti ai livelli

L'utente non ha lasciato alcun commento sulla valutazione.