Scalp Side ecider
- Indicatori
-
Sandip R Pawar
 Professional software developer since 2007 turned full-time algorithmic trader. Specializing in custom automated infrastructure, data-driven market strategies, and precision execution across derivatives, XAUUSD, and crypto.
- Versione: 1.0
- Attivazioni: 10
Scalp Side Decider — Higher-Timeframe Bias & Realized Variance Oscillator
Scalp Side Decider (SSD) is a quantitative directional bias and institutional volume exhaustion indicator engineered for MetaTrader 5. Designed specifically for scalpers and intraday traders, it eliminates counter-trend guesswork by measuring Signed Realized Variance, filtering out low-energy market noise, and isolating high-volume liquidity sweeps in real time.
Instead of relying on lagging traditional oscillators that whipsaw during sideways consolidation, Scalp Side Decider evaluates logarithmic return energy and normalizes rolling volume against a 300-bar 95th-percentile benchmark. It combines subwindow momentum analytics with automatic main-chart price projection levels and an integrated dynamic EMA overlay.
Core Quantitative Features
-
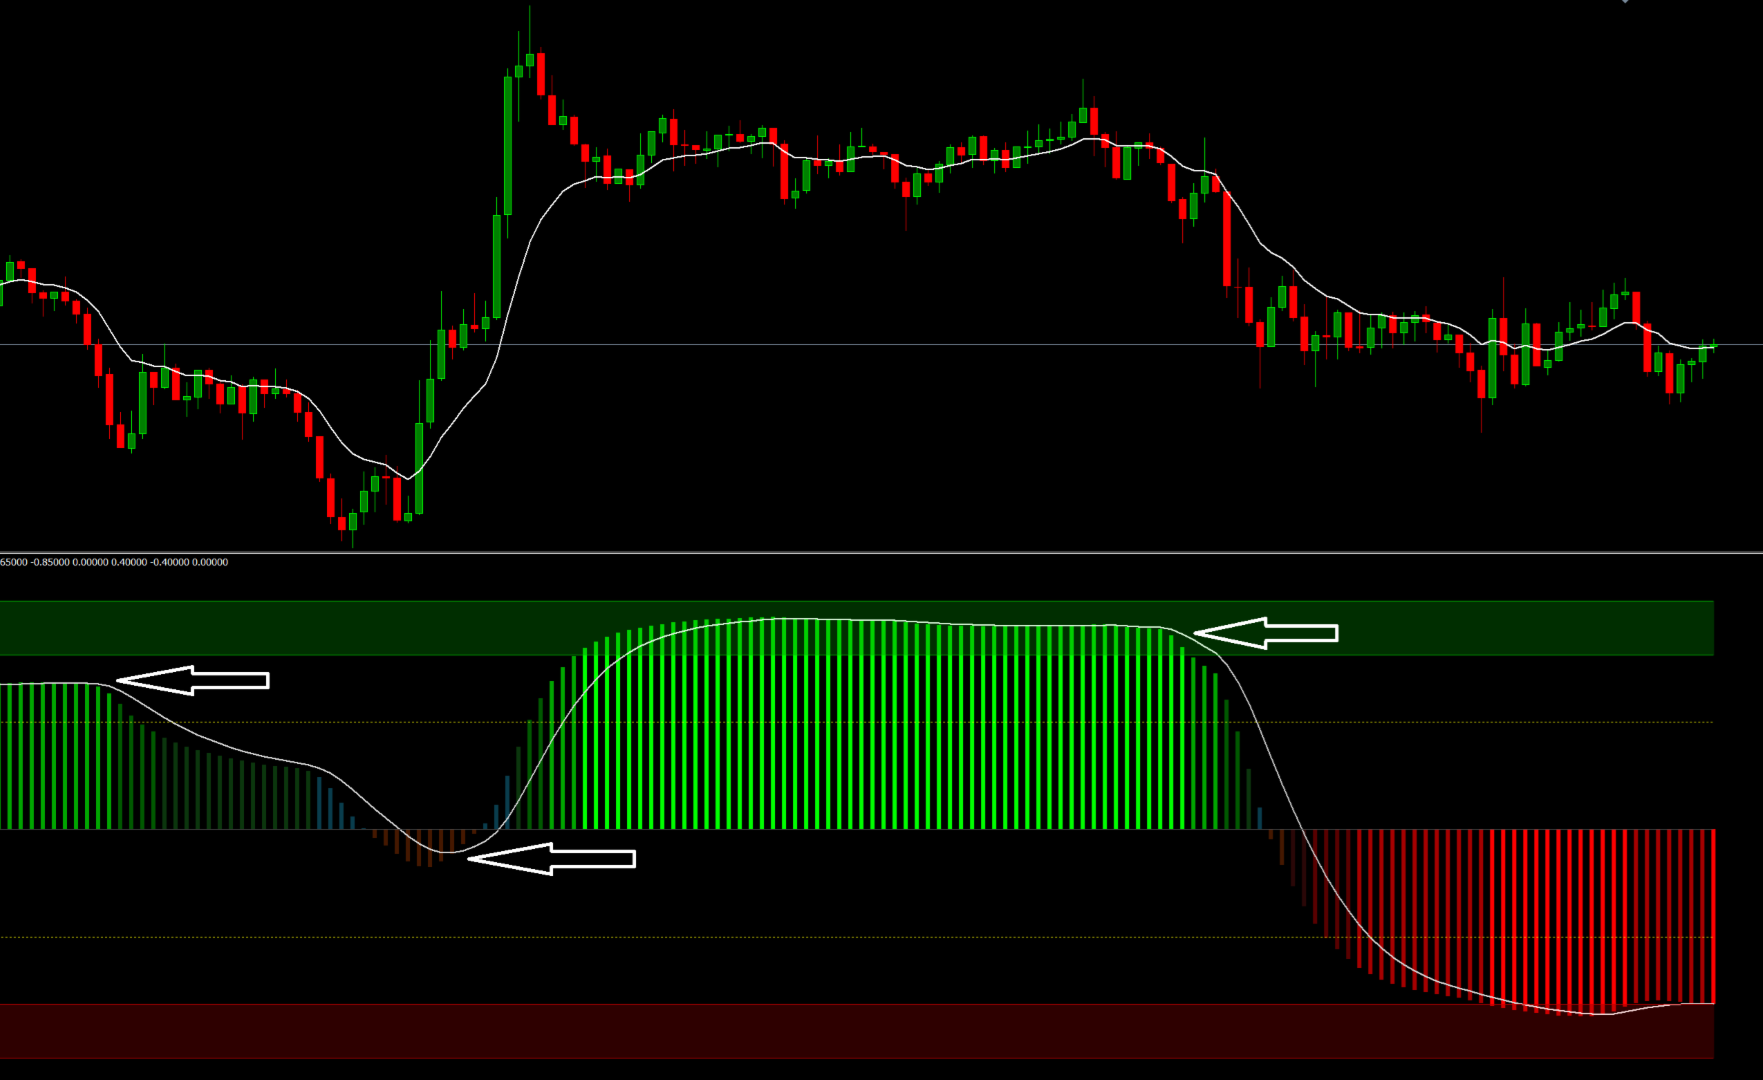
Signed Realized Variance Engine: Measures directional market energy by separating bullish and bearish squared logarithmic returns over a customizable lookback window. The resulting ratio is bounded cleanly between -1.0 and +1.0 , showing not just price movement, but the true conviction behind the move.
-
Hysteresis Trend State Filter: Uses a dedicated flip threshold (0.10 default) to lock in directional bias. The indicator ignores minor micro-pullbacks around the zero line and only shifts directional state when realized energy commits to the opposite side.
-
Multi-Tier Dynamic Color Gradient: The histogram automatically shifts across 12 intensity states—from translucent neutral white around zero to deep and bright bullish/bearish shades as momentum crosses the Mid ( ±0.40 ), Strong ( ±0.65 ), and Extreme ( ±0.85 ) zones.
-
95th-Percentile Big Volume Swing Detector: Automatically switches between Real Volume (Futures/Stocks/Crypto) and Tick Volume (Forex/CFDs), comparing rolling volume against the 95th percentile of the last 300 bars. When a confirmed swing high or low occurs with a rejection wick and institutional volume spike, SSD plots a proportional Volume Circle with a white center dot directly in the oscillator window.
-
Main-Chart High/Low Projection Lines: Whenever a Big Volume Swing signal triggers, the indicator automatically projects horizontal white dotted High and Low breakout/support boundaries (7 bars forward by default) directly onto your main price chart.
-
Integrated Main-Chart EMA Overlay: Plots a responsive 12-period Exponential Moving Average directly on the main price chart without requiring a separate moving average indicator.
-
100% Non-Repainting Confirmed Signals: All Big Volume Swing circles, main-chart High/Low projection lines, and popup alerts are evaluated strictly on closed bars.
How to Trade with Scalp Side Decider
1. Following the Dominant Scalp Side (Trend Continuation)
-
Bullish Bias (Buy Only): When the histogram is green and holding above the Zero Line (and especially above the +0.40 yellow dotted Mid Level) while price trades above the white Main Chart EMA (12), focus exclusively on long scalp setups.
-
Bearish Bias (Sell Only): When the histogram is red/orange and holding below the Zero Line (and below the -0.40 Mid Level) while price trades below the white Main Chart EMA (12), focus exclusively on short scalp setups.
-
No-Trade / Chop Filter: When the histogram turns translucent white near 0.00 , market energy is compressed. Avoid breakout scalping until the histogram expands past the flip threshold.
2. Trading Big Volume Exhaustion & Reversal Swings
-
Bullish Volume Circle (Green Circle Below Zero): Appears when a 9-bar swing low forms with a strong lower rejection wick and a 95th-percentile volume surge while the oscillator is extended below zero. Look for price to break above the upper white dotted projection line on the main chart for a reversal entry, using the lower white dotted line as your invalidation/stop level.
-
Bearish Volume Circle (Orange Circle Above Zero): Appears when a 9-bar swing high forms with an upper rejection wick and a volume surge while the oscillator is extended above zero. Look for price to break below the lower white dotted projection line for a short entry, using the upper white dotted line as your invalidation level.
3. Managing Exits in Extreme Zones
-
When the histogram enters the shaded Bull Overbought Zone ( +0.65 to +0.85 ) or Bear Extreme Zone ( -0.65 to -0.85 ) and turns bright white (≥ ±0.85 ), directional energy is climaxing. Tighten trailing stops or lock in partial profits on open scalp positions.
Input Parameters Guide
Calculation
-
Source Price ( PRICE_CLOSE ): Price input used for the pre-smoothed source calculation.
-
Source EMA Length ( 20 ): Lookback period for smoothing the source price prior to computing logarithmic returns.
-
Energy Lookback Length ( 24 ): Period used to accumulate signed and total realized variance.
-
Energy Smoothing Mode ( Wilder's Smoothing RMA / EMA ): Mathematical smoothing method applied to realized energy.
-
Trend Post-Smoothing Length ( 7 ): EMA smoothing factor applied to the raw signed variance ratio.
Trend Settings
-
Trend Flip Threshold ( 0.10 ): Minimum oscillator threshold required to flip the internal directional trend state.
-
Mid Dotted Level ( 0.40 ): Intermediate momentum confirmation level (+0.40 and -0.40 ).
-
Strong Trend Level ( 0.65 ): Boundary marking the start of the shaded strong/overbought/oversold zone.
-
Extreme Zone Level ( 0.85 ): Climax threshold where the histogram highlights extreme exhaustion in white.
Plotting and Coloring
-
Show Oscillator Histogram ( true ): Toggle the main color-gradient realized variance histogram.
-
Show Static Levels & Zones ( true ): Toggle the Strong/Extreme horizontal lines and shaded zones.
-
Show Mid Dotted Levels ( true ): Toggle the ±0.40 dotted reference lines.
-
Mid Level Color ( clrYellow ): Custom color for the mid-level dotted lines.
-
Show Smoothed Signal Line ( true ): Toggle the moving average signal line inside the oscillator window.
-
Signal Line Length ( 7 ): Period of the oscillator signal line.
-
Bullish / Bearish Colors ( clrLime / clrRed ): Primary colors used for the adaptive background-blended gradient.
-
Show Main Chart EMA ( true ): Toggle the dynamic EMA overlay on the main price chart.
-
Main Chart EMA Length ( 12 ): Period for the main-chart EMA overlay.
-
Main Chart EMA Color ( clrWhite ): Color of the main-chart EMA line.
-
Max Bars for Chart Objects ( 1500 ): Limits graphical trendline and ellipse objects to recent history for ultra-fast terminal performance.
Big Volume Points (0-Lag Settings)
-
Swing Lookback Length ( 9 ): Number of bars used to identify local swing highs/lows and rolling volume sums.
-
Same-Bar Rejection Wick Ratio ( 0.25 ): Minimum required rejection wick size relative to the total candle range (25% ).
-
Volume Filter Threshold ( 2.0 ): Minimum normalized volume score (0.5 to 6.0 ) required to trigger a Big Volume Circle.
-
Circle Diameter Multiplier ( 0.20 ): Controls the visual scaling of volume circles relative to volume strength.
-
Bearish / Bullish Volume Circle Colors: Custom RGB colors for upper and lower volume exhaustion circles.
-
Show Chart High/Low Dotted Lines ( true ): Automatically draws High/Low range boundaries on the main chart when a volume circle appears.
-
High/Low Line Length ( 7 ): Number of bars forward to project the High/Low dotted lines on the main chart.
Alerts
-
Enable Closed-Bar Popup Alerts ( false ): Triggers native MT5 popup and sound alerts on confirmed directional trend flips and Big Volume Swing signals.
Technical Specifications
-
Platform: MetaTrader 5 (MT5)
-
Markets Supported: Forex, Gold (XAUUSD), Indices (US30, NAS100, GER40), Crypto, and Equities
-
Recommended Timeframes: M1, M5, and M15 for scalping; H1 and H4 for intraday directional bias