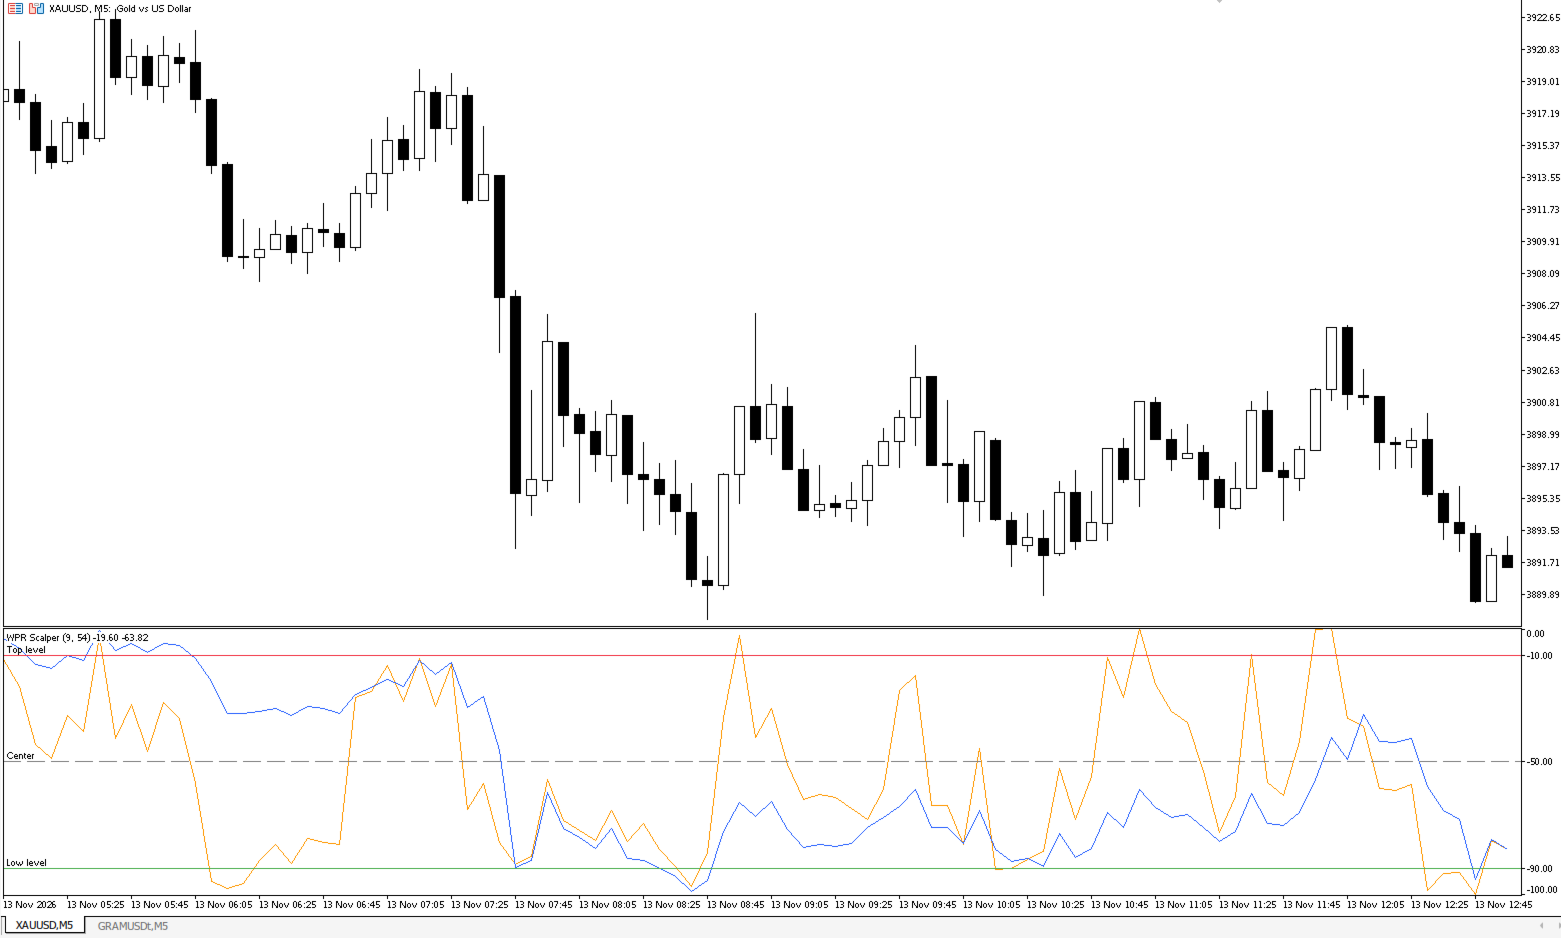
WPR Momentum Panel
- Indicatori
- Versione: 1.0
- Attivazioni: 5

Fast and slow Williams %R in a separate window with low, center and top levels.
WPR Scalper shows two Williams %R lines with different periods (fast 9 and slow 54 by default) and marks the oversold and overbought zones with adjustable levels. It helps to see short-term momentum of the fast line against the slower background of the slow line.
How it works
- Fast WPR reacts quickly and shows short-term exits from the extreme zones.
- Slow WPR shows the broader momentum and can be used as a filter.
- Low level (default -90) marks the oversold zone, top level (default -10) marks the overbought zone.
- Center line (-50, dashed gray) helps to see whether momentum is on the upper or the lower half of the range.
- The indicator draws lines only. It does not open trades and does not repaint closed bars.
Features
- Two Williams %R lines with adjustable periods
- Adjustable low and top levels
- Checkboxes: show fast line, show slow line, show center line
- Incremental calculation, fast loading on any symbol and timeframe
- No DLL, no external requests, no trading operations
Input parameters
- Fast WPR period (default 9)
- Slow WPR period (default 54)
- Low level (default -90)
- Top level (default -10)
- Show fast WPR line (on)
- Show slow WPR line (on)
- Show center line (on)
Line colors and styles can be changed in the indicator Properties window.
Example of how a trader might use it (not a recommendation)
A possible rule set to test on a demo account or in the Strategy Tester:
- Watch the fast WPR. When it leaves the low level upward, consider only long setups; when it leaves the top level downward, consider only short setups.
- Use the slow WPR as a filter: take a setup only when the slow line is not at the opposite extreme or is moving in the same direction.
- Use the center line as a rough momentum check: setups from the lower half back through -50 are stronger than setups that stall below it.
- Confirm entries with price action or your own trend filter, and set a stop-loss based on the nearest swing or ATR.
- Skip signals during low liquidity and around high-impact news. Test any variant on your own symbols and timeframes, including spread and slippage, before using it live.
Notes
- Williams %R is a lagging oscillator and can stay in an extreme zone for a long time in a strong trend.
- Past behavior does not predict future results. Trading leveraged products involves a high risk of loss. This is an analysis tool, not financial advice.