POC ZigZag
- Utilità
- Versione: 1.10
- Attivazioni: 5

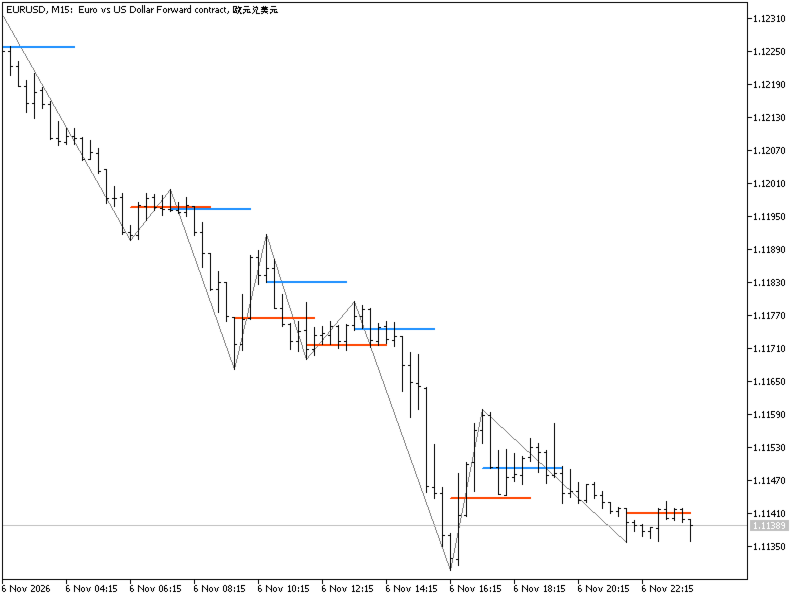
The indicator displays the POC (Point of Control) at the extremes of a swing zigzag.
Algorithm:
1. A zigzag is plotted: swing extremes (fractal pivots) with a depth of N bars to the left and right of the extreme.
2. For each extreme, a volume profile is plotted over a window of N candlesticks (the window is centered on the extreme bar).
3. The POC is the level with the highest volume in this window; it is plotted on the chart as a horizontal line.