Arixis Fixed Range Profile
- Indicatori
-
Abel Masferrer Vinolas
 Algorithmic Trading Developer & Creator of Arixis
I develop advanced tools for MetaTrader 5 focused on trading analytics, risk monitoring, execution analysis, and algorithmic trading. - Versione: 1.0
English — Product description
Explore how market activity is distributed across price levels within a selected range.
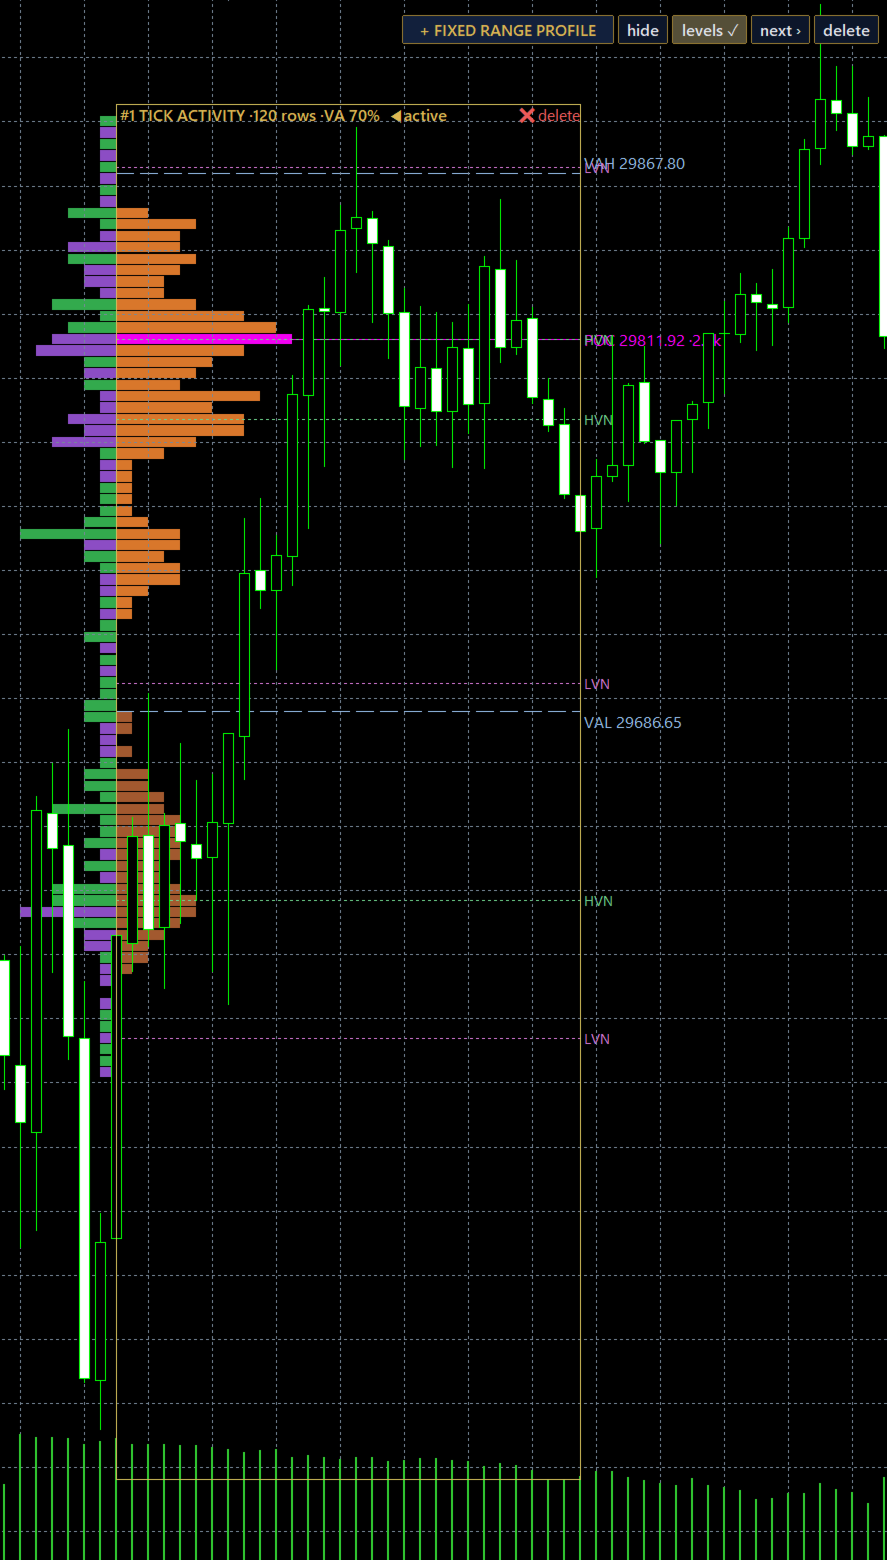
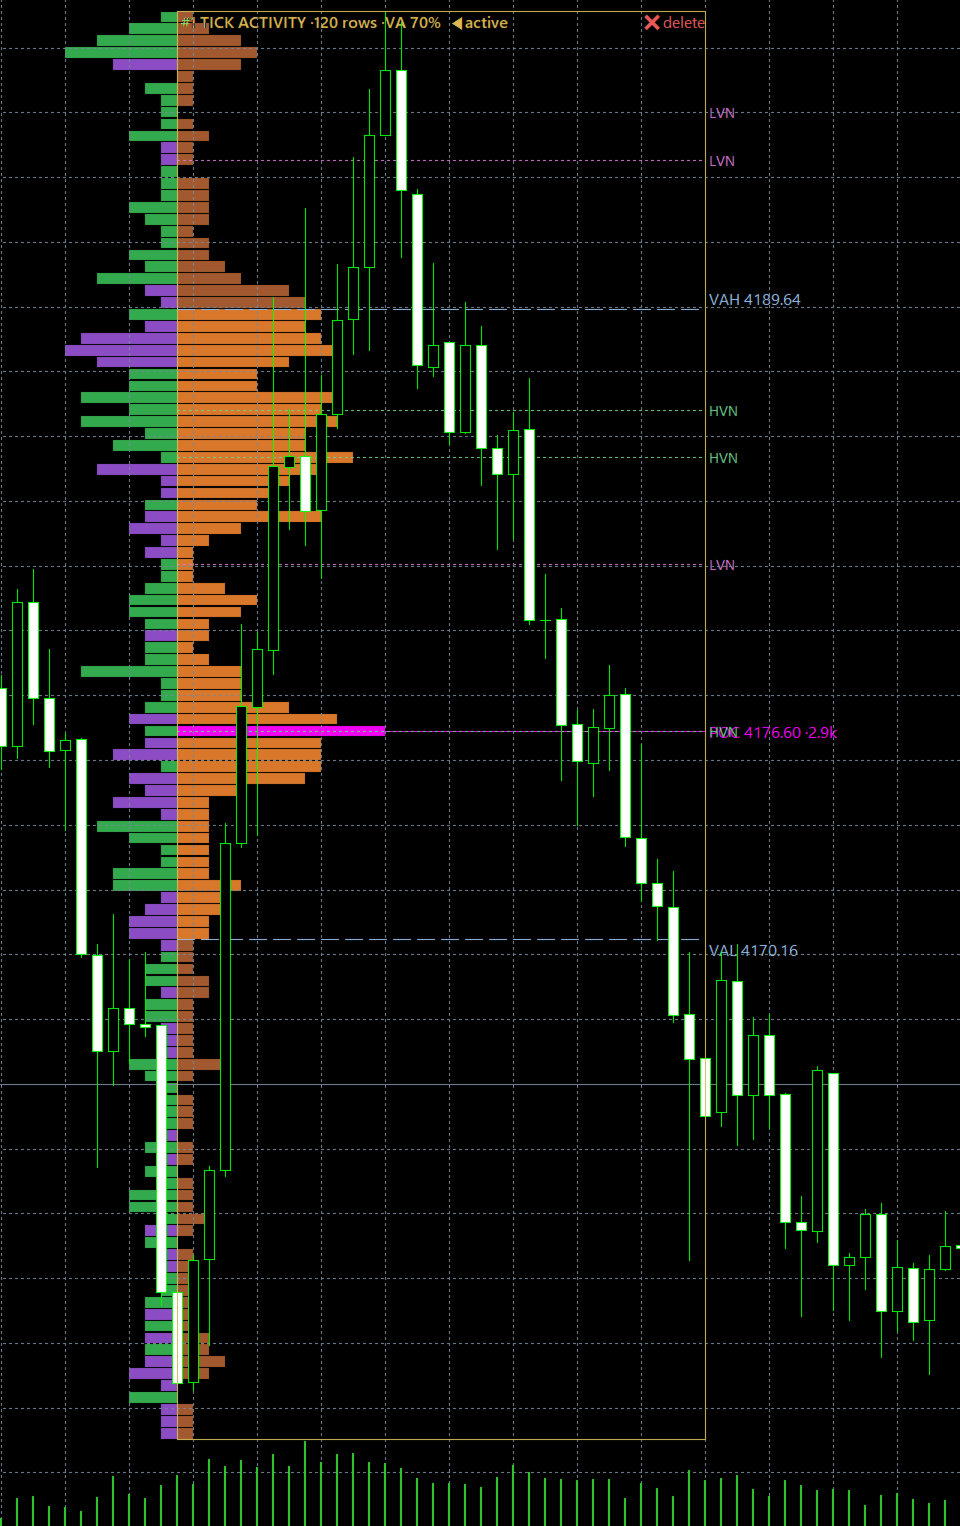
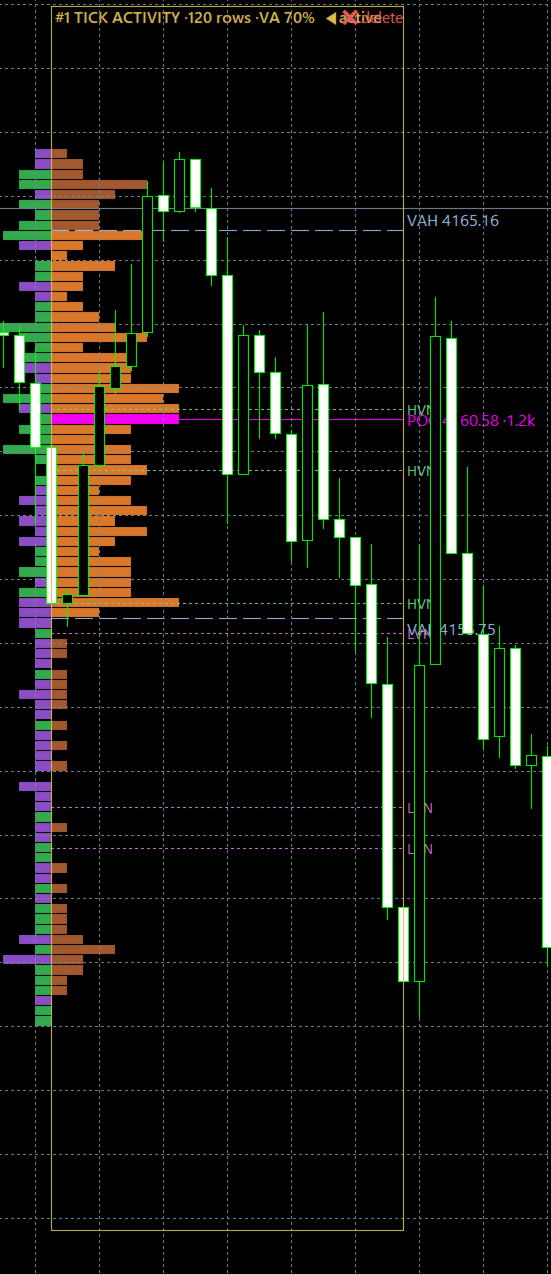
Arixis Fixed Range Profile allows MetaTrader 5 users to select a specific chart region and visualize its horizontal activity distribution.
The indicator calculates and displays a profile with key reference levels.
Key features
-
Interactive fixed-range selection.
-
Horizontal activity histogram.
-
Point of Control (POC).
-
Value Area High (VAH) and Value Area Low (VAL).
-
High Volume Nodes (HVN) and Low Volume Nodes (LVN).
-
Estimated directional delta visualization.
-
Adjustable profile resolution, colors and display settings.
-
Multiple profiles on the same chart.
The data source depends on broker availability and the selected configuration. The indicator distinguishes traded volume, tick activity and estimated M1-based profiles.
English — Interpretation guide
Histogram
Each horizontal bar represents the activity associated with a price interval. Longer bars indicate greater measured or estimated activity.
POC — Point of Control
The price interval with the highest activity within the selected range.
It can be used as an important reference level, but it is not guaranteed support or resistance.
VAH — Value Area High
The upper boundary of the value area.
VAL — Value Area Low
The lower boundary of the value area.
By default, the value area contains approximately 70% of the activity represented by the profile.
HVN — High Volume Node
A local concentration of activity, potentially indicating an area where substantial market interaction occurred.
LVN — Low Volume Node
A relatively low-activity area between higher-activity regions.
Delta
The optional delta visualization estimates directional activity. On quote-only feeds, it is not a true aggressor buy-versus-sell volume measurement.
Example workflow
-
Select a meaningful price range.
-
Identify the POC and value area.
-
Observe the location of current price relative to VAH and VAL.
-
Examine high- and low-activity regions.
-
Combine the information with price structure and market conditions.