Secondcandles overlay
- Indicatori
- Versione: 3.10
- Attivazioni: 5

SecondCandles Overlay: Seconds Candles on Any Timeframe
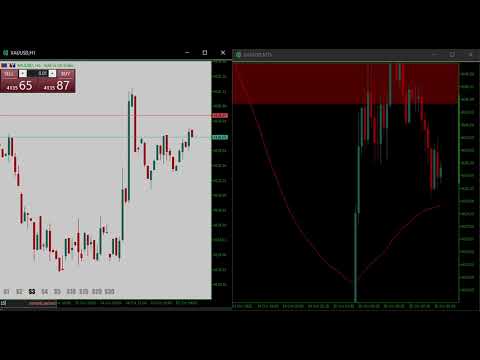
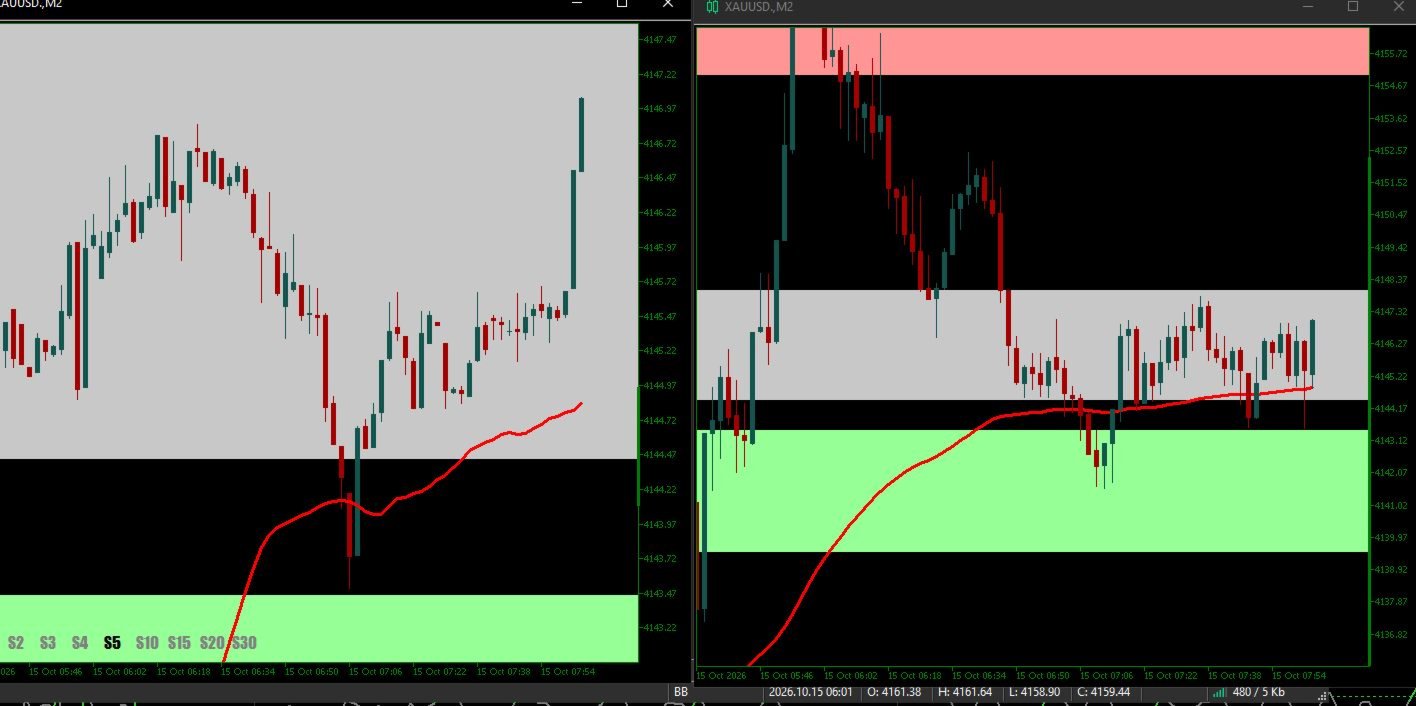
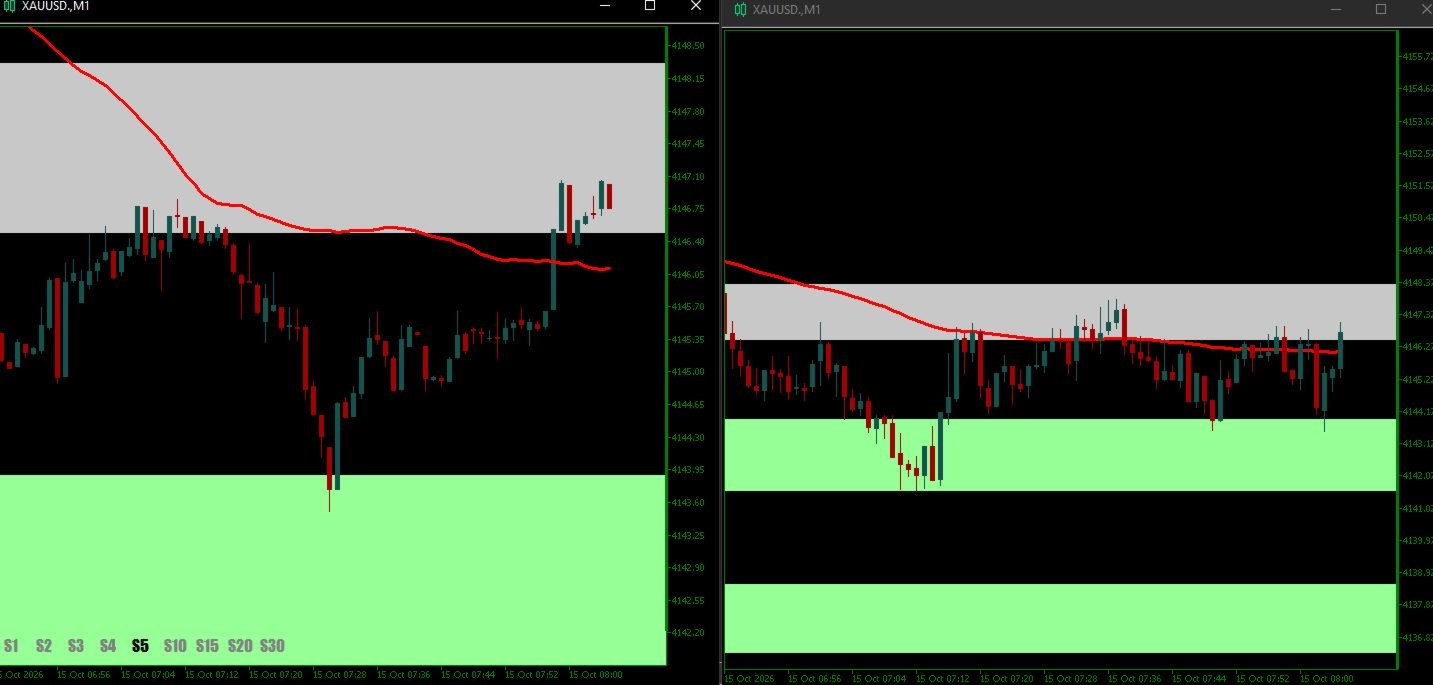
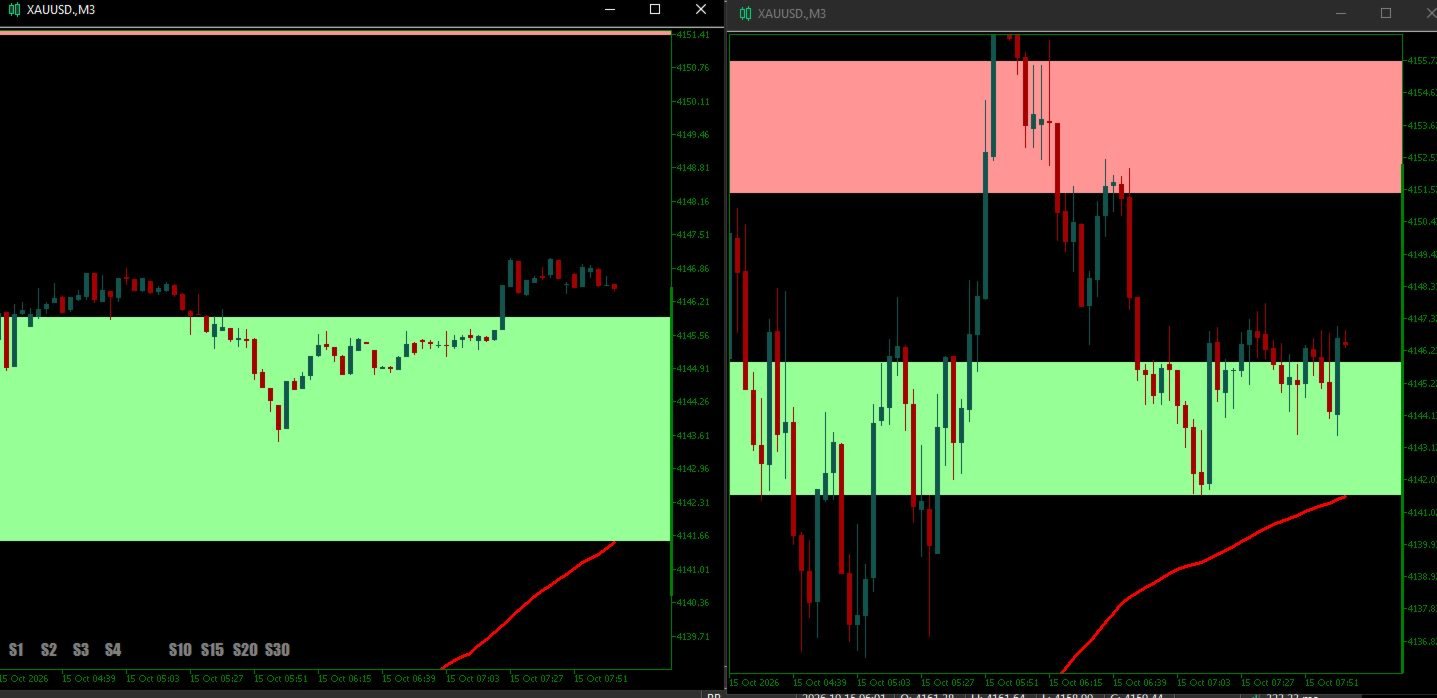
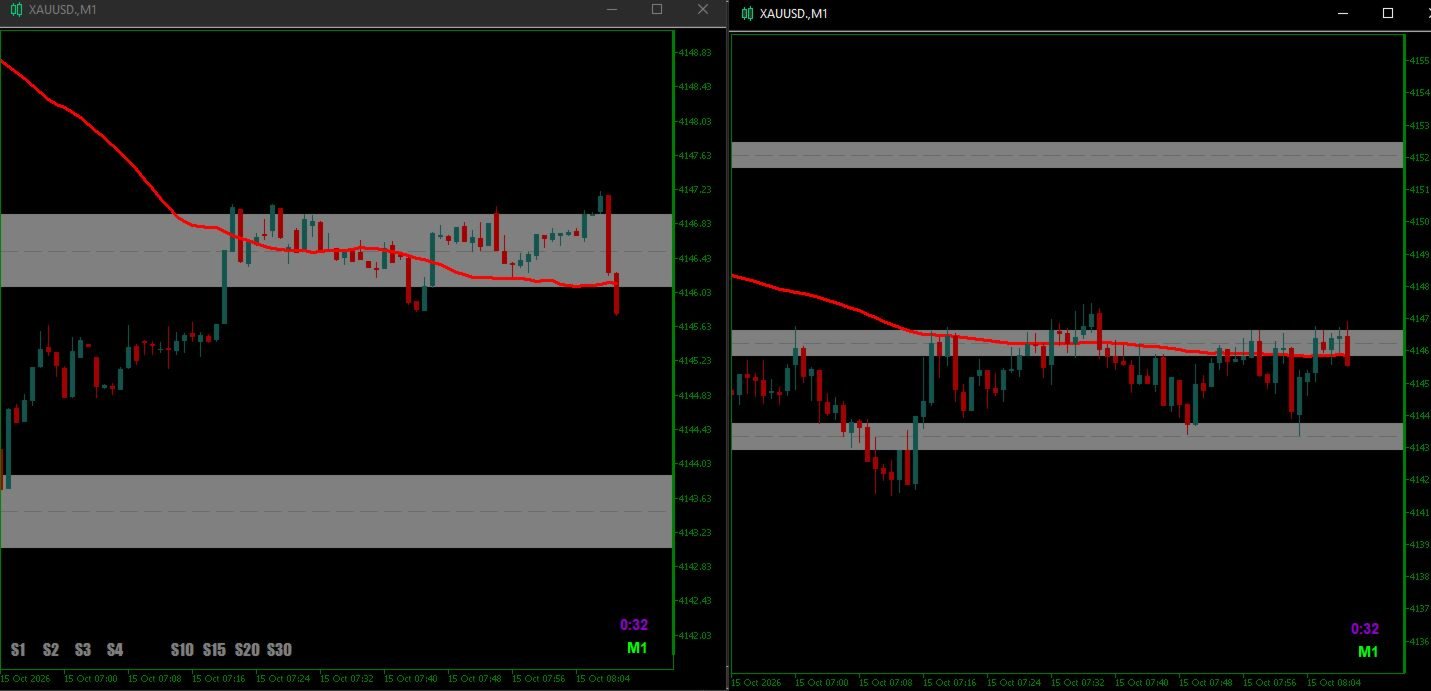
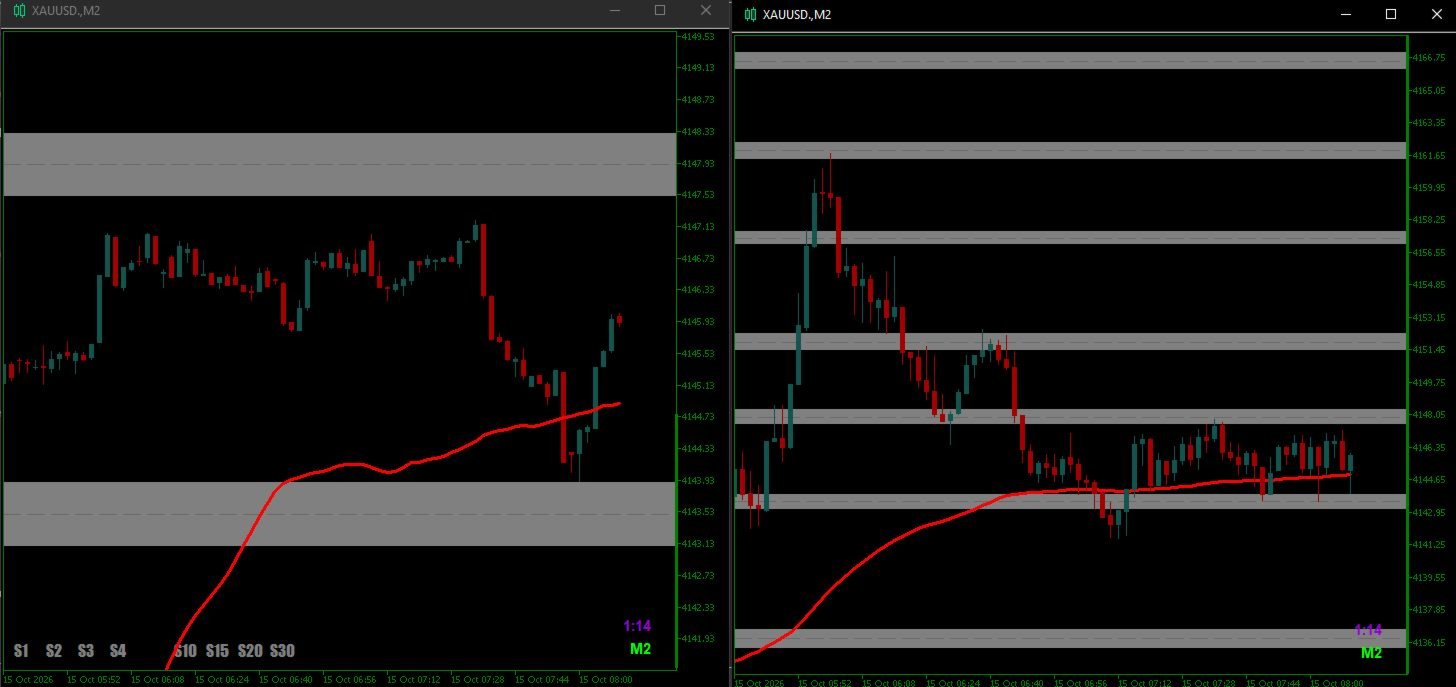
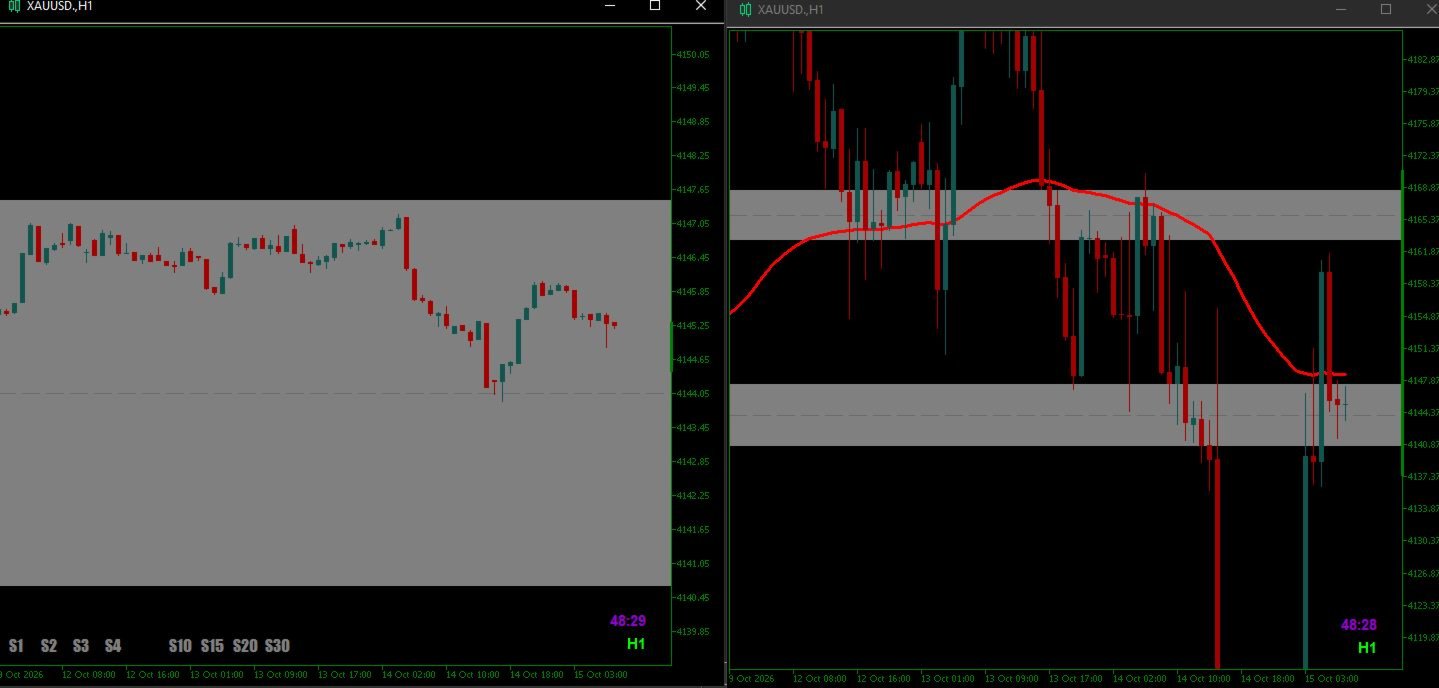
SecondCandles Overlay draws real seconds-based candlesticks (1s to 30s) directly on top of your regular chart, on any timeframe from M1 to MN. There is no offline chart, no custom symbol and no second window. You keep trading on your normal symbol and see price action at a much finer resolution.
Candles are built from real tick data (bid price) provided by your broker, so they reflect what the market actually did, not an approximation.
Key features
- 9 seconds timeframes: 1s, 2s, 3s, 4s, 5s, 10s, 15s, 20s and 30s.
- Works on any chart timeframe: attach it to M1, M5, H1, D1 or any other chart.
- Built from real ticks: history is rebuilt from your broker’s tick data when the overlay is switched on, then updated live tick by tick.
- Works on the real symbol: no custom symbols or offline charts needed.
- One-key toggle: show or hide the seconds candles with a hotkey (A–Z, 0–9 or F1–F12). A second hotkey can be set as an alternative.
- On-chart timeframe buttons: switch between 1s and 30s with one click. The button panel is fully customizable (font, size, colors, position) and can be hidden.
- Auto-scaling: the price scale automatically fits the visible seconds candles, so they are always readable.
- Clean on/off behavior: when switched off, your original chart colors and scale are restored, and the indicator stops reading ticks, so CPU usage is close to zero.
- No gaps: when no ticks arrive, the indicator still advances with the clock and draws flat candles.
- Remembers your timeframe: the last selected seconds timeframe is kept per chart.
- Works with other indicators: it broadcasts a custom chart event when switched on or off, so your own indicators can hide or show themselves automatically.
How to use
- Open a chart of your symbol on any timeframe.
- Attach SecondCandles Overlay.
- Seconds candles appear automatically (if enabled in the inputs).
- Press your hotkey (default: 1) to show or hide them, and click the buttons at the top right to change the seconds timeframe.
Input parameters
Seconds timeframe
- Default timeframe: the seconds timeframe used at startup
- Number of seconds candles shown: 10–2000 (default 200)
- Show seconds candles automatically: on/off
Hotkeys
- Hotkey A: A–Z, 0–9 or F1–F12 (default “1”)
- Hotkey B: optional second hotkey (empty = off)
Timeframe buttons
- Show buttons, font, font size, text color, button color, active button color, margin from right and top edges
For developers
When the seconds candles are switched on or off, the indicator sends a custom chart event (event ID 3333, lparam 0 = seconds chart ON, 1 = OFF). Your own indicators can listen for it in OnChartEvent ( CHARTEVENT_CUSTOM + 3333 ) to hide or show their plots accordingly.
Important notes
- The seconds candles are drawn over the chart’s own bars, so the time axis labels still show the chart’s timeframe, not seconds. The original candles are hidden while the overlay is on and restored when it is off.
- The number of seconds candles shown cannot exceed the number of bars available on the chart.
- Seconds history depends on the tick history your broker provides. If a broker has little or no tick history, fewer past candles may be available when you switch it on. Live candles always build normally.
- Candles are built from the bid price.
- Other indicators on the chart still calculate on the chart’s own data, not on seconds candles.
- This is a visualization tool. It does not open trades and does not give trading signals. Trading involves risk.