Candle Distribution Viewer
- Indicatori
-
J Lucky Anugraha
 I build trading systems the way I build industrial plants—with precision, control loops, and zero tolerance for failure.
By education: B.Tech. Scholar in Industrial Biotechnology | Associate Engineer in Instrumentation & Control. - Versione: 1.0
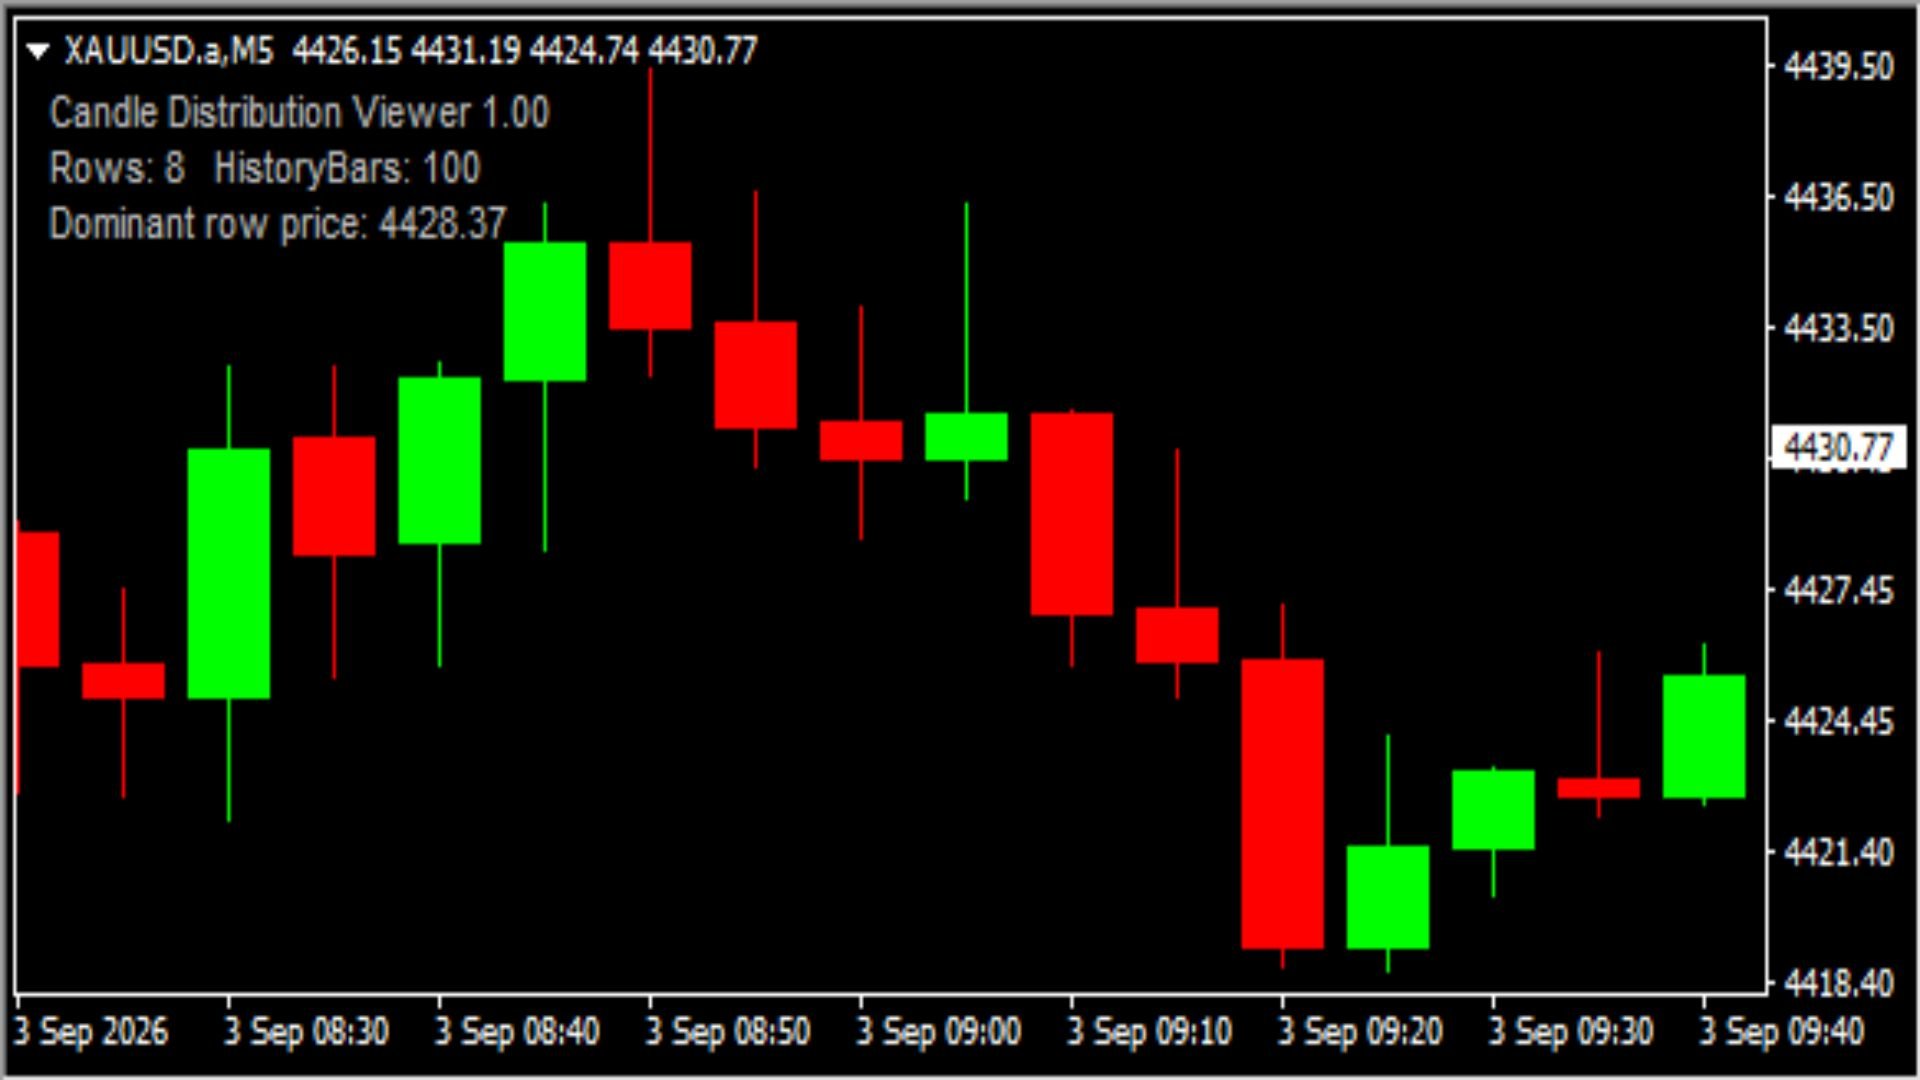
Candle Distribution Viewer is a price-row visualization indicator for MetaTrader 4 and MetaTrader 5. It divides each candle range into configurable horizontal rows and displays an estimate of how the candle's available tick activity is distributed across those rows.
The indicator highlights the Dominant Activity Row, which is the row with the highest estimated activity for that candle. The tool is designed for visual market-structure study and does not generate Buy/Sell signals or execute trades.
Main functions:
- Configurable price rows per candle
- Historical candle distribution display
- Live updating of the current candle where platform data allows
- Dominant Activity Row highlighting
- Optional row values and dominant price label
- Adjustable history depth and visual size
- Clean object handling when the symbol or timeframe changes
Data note:
The indicator uses data available through the MetaTrader terminal. Depending on platform, broker and historical data availability, row activity may be an estimate derived from available tick or tick-volume information. It does not claim exchange level order-flow data when such data is unavailable.
Suggested use:
Use the display to study where activity was concentrated inside individual candles and how concentration changes from one candle to the next. The indicator is analytical and should not be treated as a standalone trading recommendation.
Default settings:
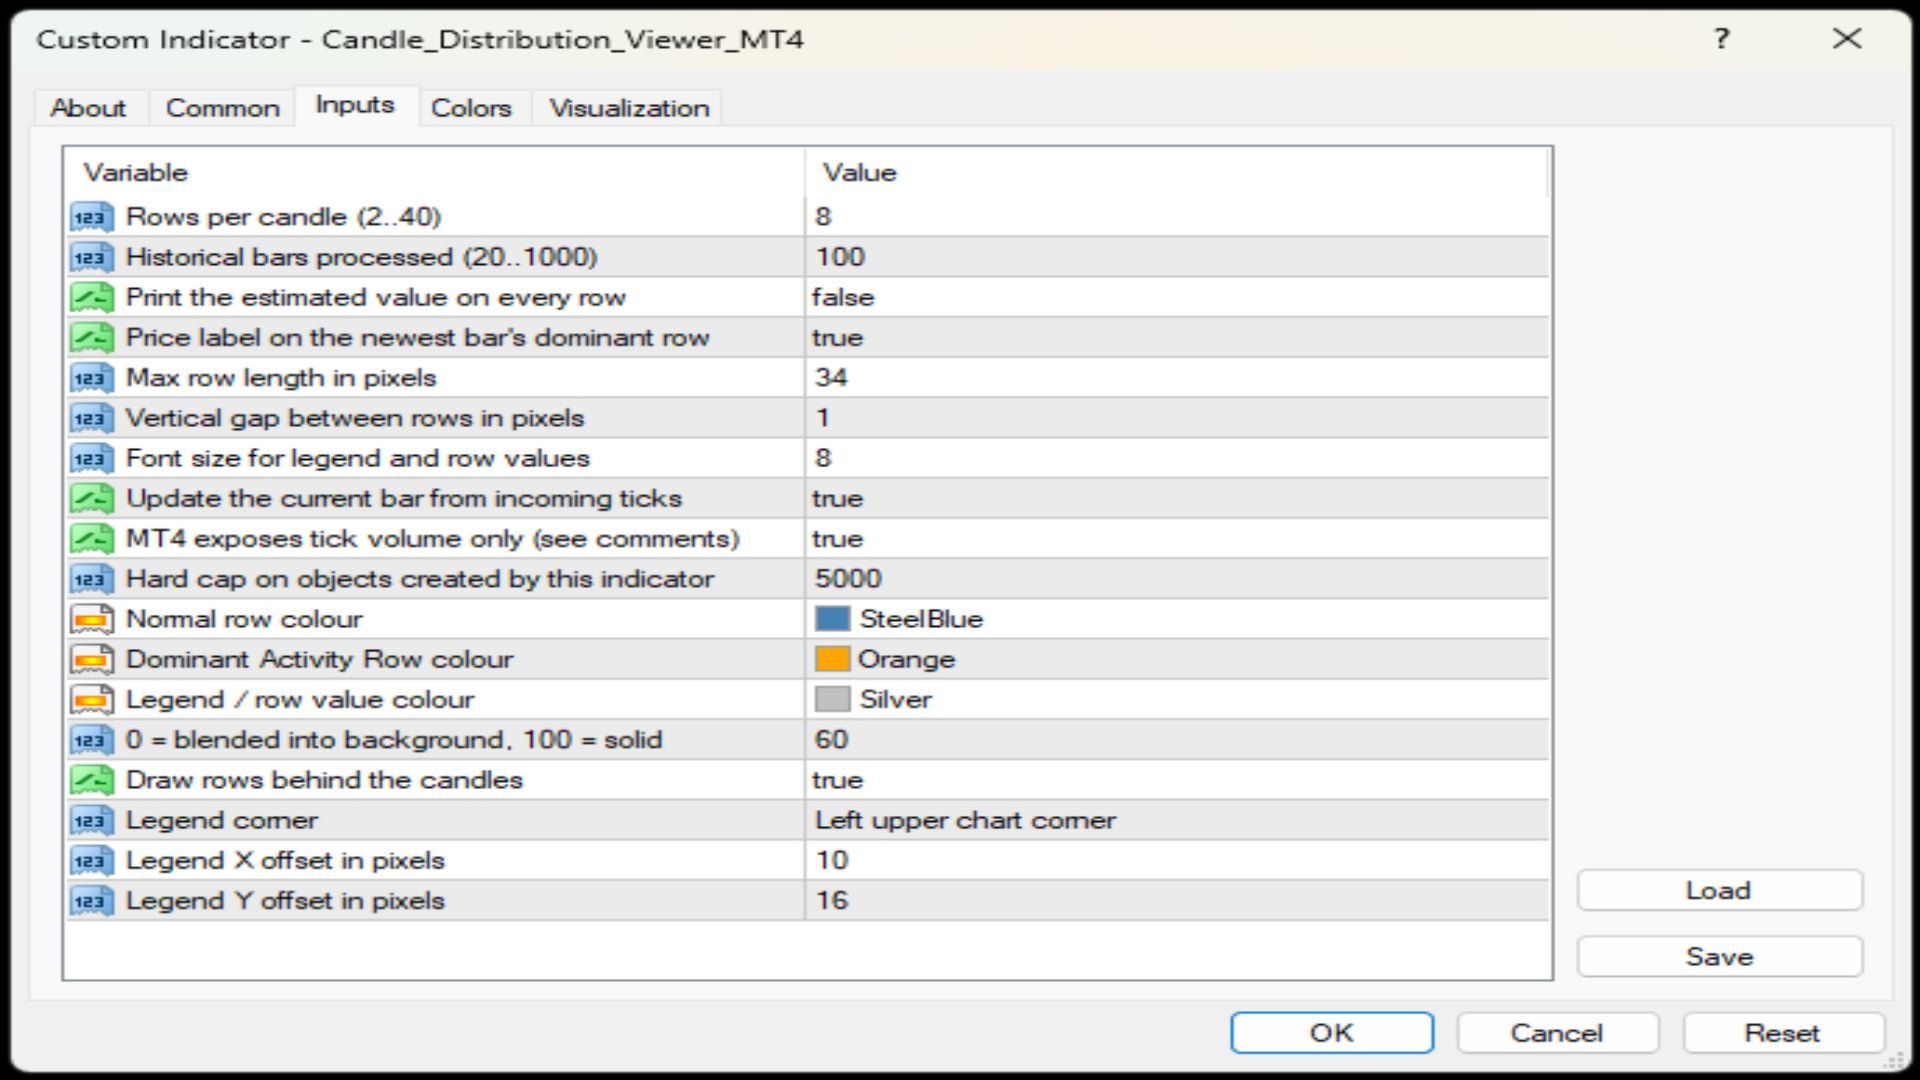
RowsPerCandle: 8
HistoryBars: 100
ShowRowValues: false
ShowDominantPrice: true
LiveCurrentBar: true
The indicator is designed to work across different liquid symbols and timeframes. Visual results depend on the quality and type of data supplied by the broker.