Quantum Gold Probability Map
- Indicatori
-
Guad Bibar
 Founder of Quantum Labs and developer of practical MT4 and MT5 tools for traders who value risk control, transparent logic, and disciplined execution. I build non-repainting indicators, market-regime dashboards, and Expert Advisors with clearly documented rules and realistic risk controls—without
 - Versione: 1.2
- Attivazioni: 5
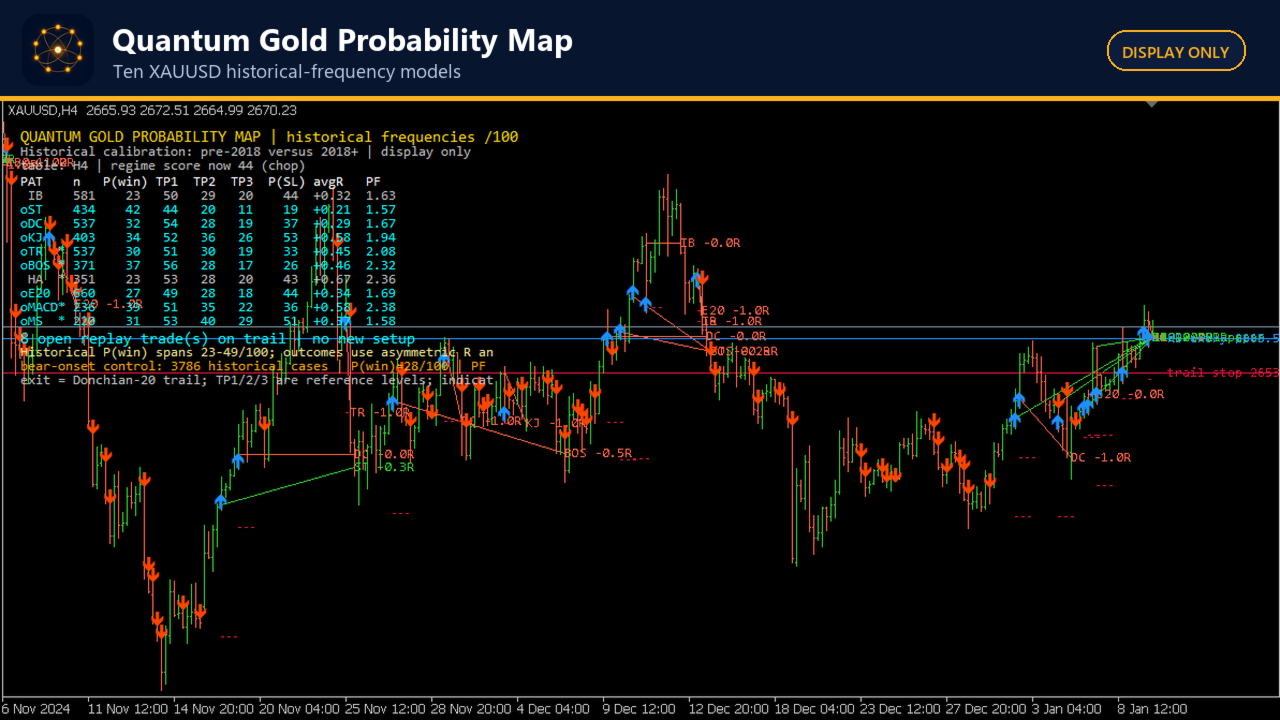
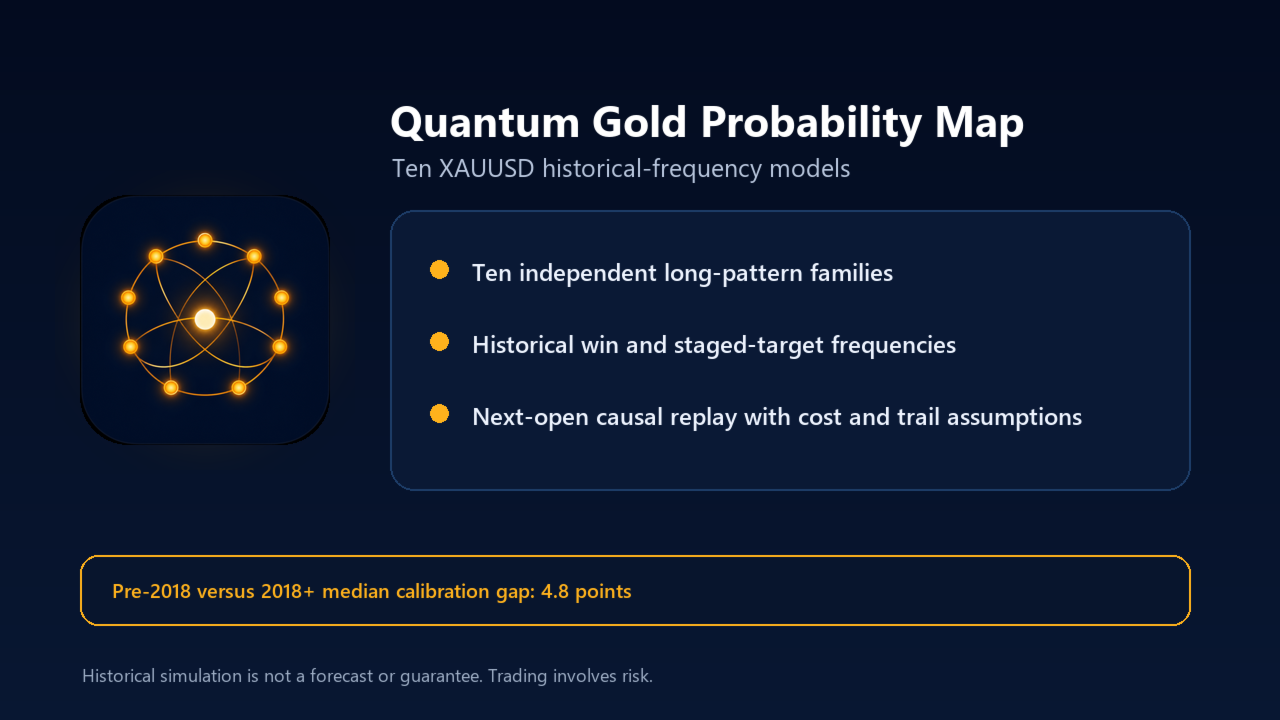
Quantum Gold Probability Map is a display-only XAUUSD historical-frequency and replay indicator. It organizes ten long-pattern families in one chart tool and reports measured replay frequencies rather than issuing automated trades.
PATTERN FAMILIES
- Inside-bar breakout
- Supertrend flip
- Donchian breakout
- Kijun dip-buy
- Trend-rider pullback
- Structure breakout
- Heiken-Ashi resume
- EMA20 reclaim
- MACD cross
- Morning star
The panel displays each model's historical frequency score and regime context. The chart can draw simulated entries, stops, staged targets, trailing outcomes, and optional bear-onset warnings. Push notifications are disabled by default.
METHODOLOGY
The causal replay uses next-open fills, a 0.025% per-side cost model, and a Donchian-20 trailing rule. Pre-2018 fitted frequencies were compared with 2018-and-later results; the median absolute calibration gap was 4.8 percentage points across the included pattern tables. Historical win frequencies vary materially by pattern and regime.
RECOMMENDED SETUP
1. Open XAUUSD H4 or D1.
2. Attach the indicator and begin with history display enabled.
3. Hide individual pattern families to reduce chart density.
4. Interpret every percentage as a historical sample frequency, not as a future probability.
Historical simulation is not a forecast. Trading involves risk.