• Panoramica
  • Recensioni
  • Commenti
  • Novità

ATR Bands Alert

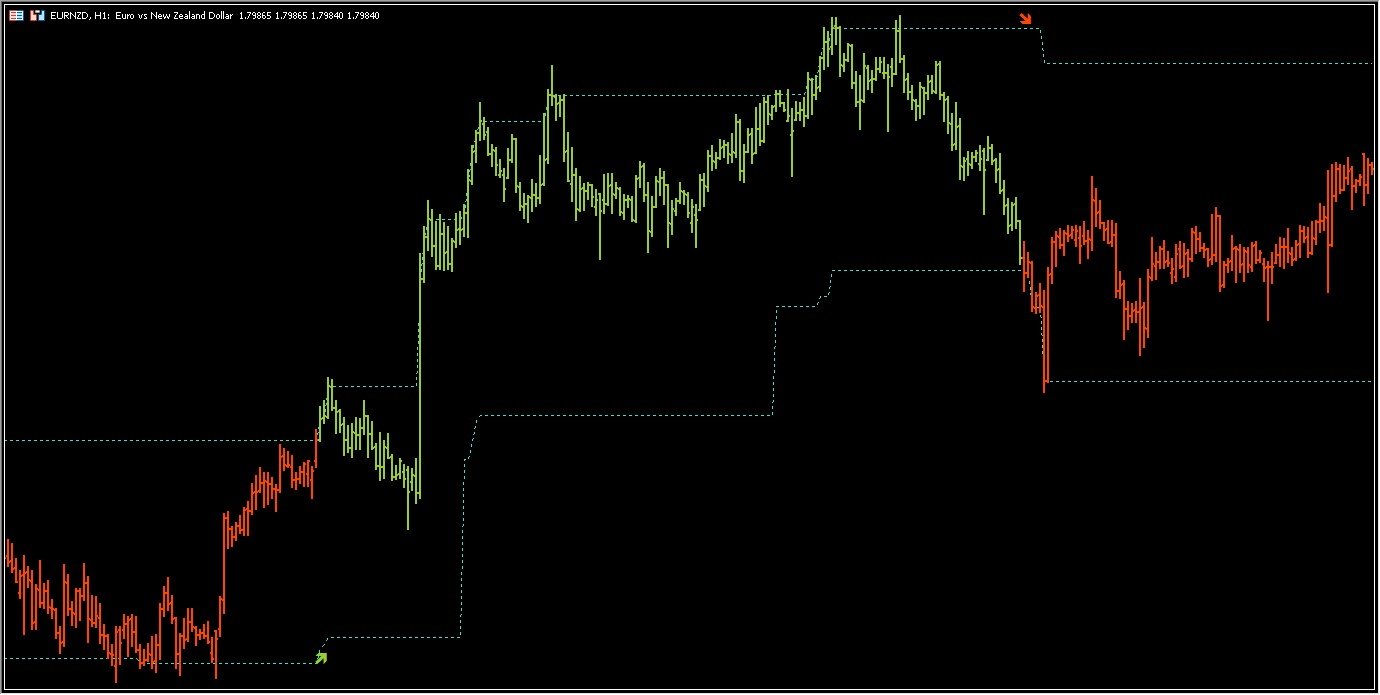
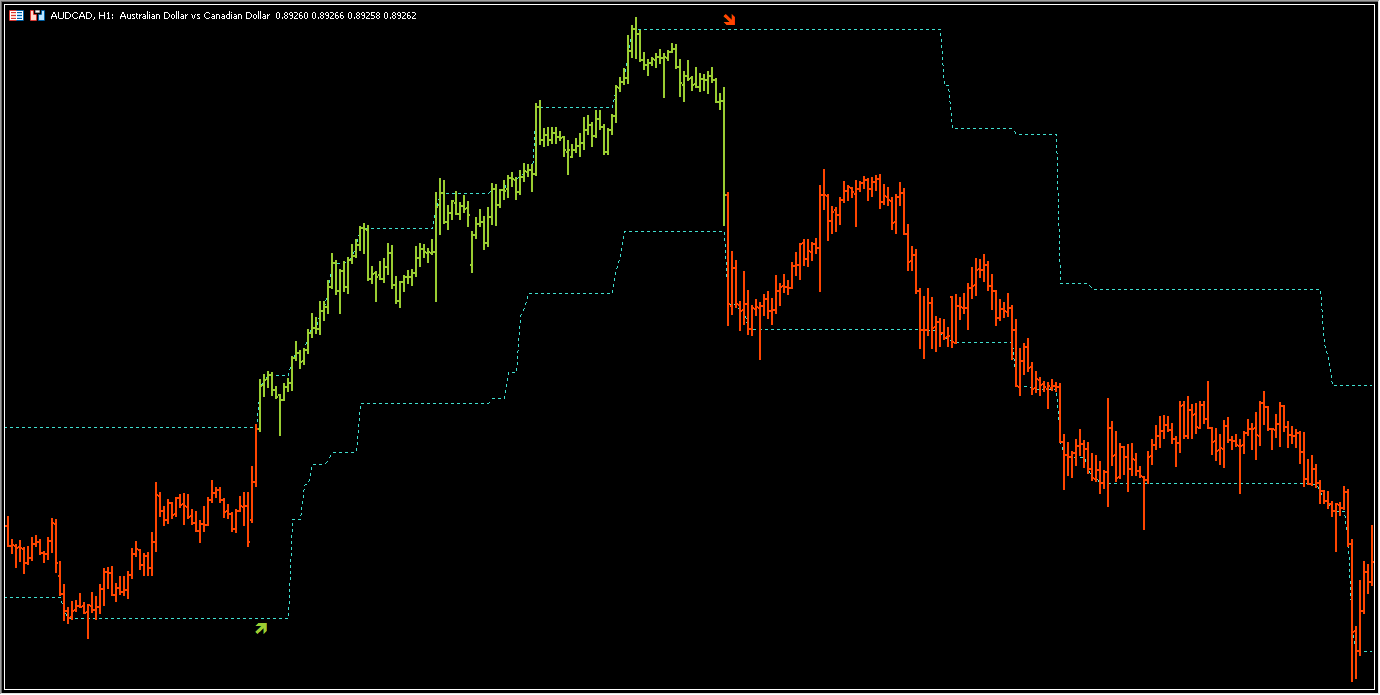
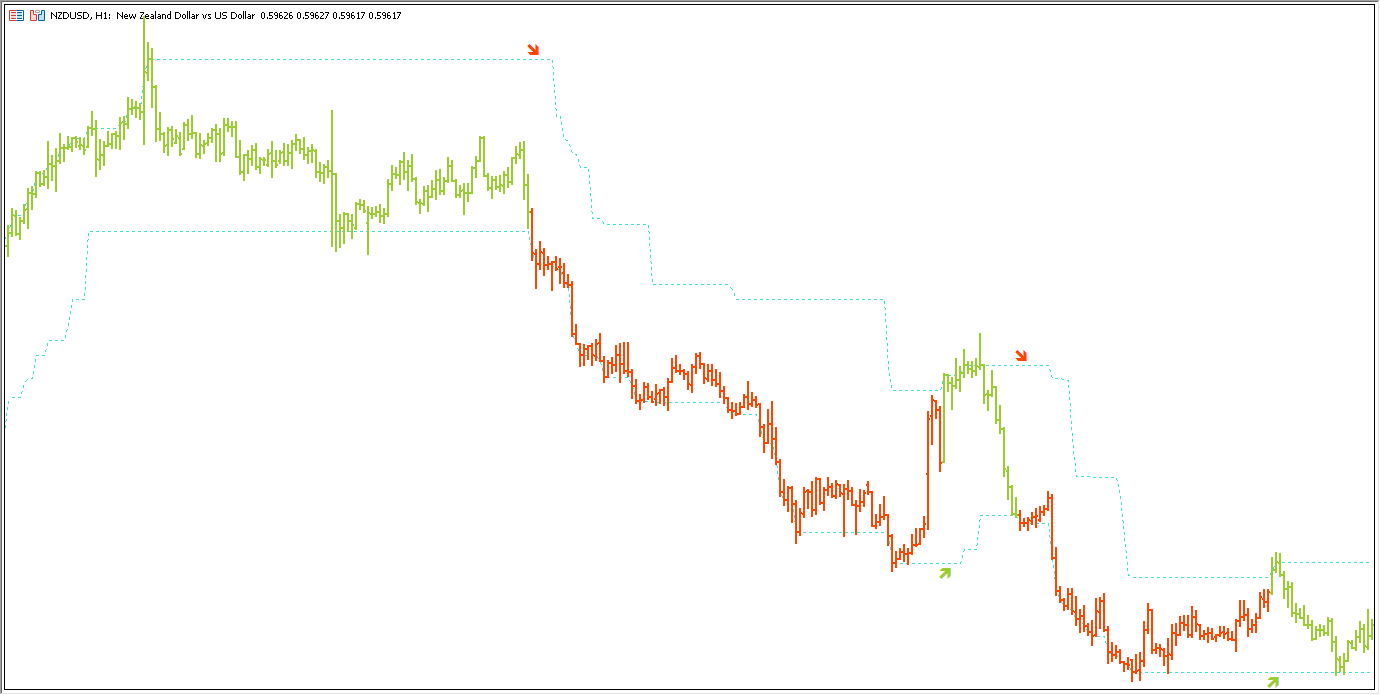
ATR Bands Alert è un indicatore di canale in cui la larghezza del canale viene calcolata come un moltiplicatore costante ("Moltiplicatore") e il valore dell'indicatore "Average True Range". A differenza delle bande di Bollinger, la larghezza di banda non viene modificata così spesso: nell'indicatore ATR Bands Alert, le bande spesso hanno lunghe linee rette.

L'interpretazione dell'ATR Bands Alert si basa sul fatto che il prezzo si trova all'interno delle bande per la maggior parte del tempo e, se il prezzo raggiunge uno dei limiti, potrebbe indicare un cambiamento di tendenza.

Le caratteristiche di questo indicatore includono:
Se i prezzi superano la banda, dovremmo aspettarci la continuazione del trend verso il breakout.

L'indicatore utilizza lo stile DRAW_COLOR_BARS: barre colorate (da non confondere con le candele colorate). Pertanto, è consigliabile passare il grafico alla modalità di visualizzazione a barre.

In caso di inversione di tendenza, l'indicatore visualizza la freccia acquisto o la freccia vendita. Il codice di queste frecce può essere impostato rispettivamente nei parametri "Acquista codice freccia" e "Vendi codice freccia". Il codice della freccia è preso dal carattere "Wingdings".

È anche possibile collegare avvisi in caso di tendenza: è possibile includere un file audio, un avviso, un'e-mail o inviare un push a un terminale mobile.


Prodotti consigliati
Big Player Range
Thalles Nascimento De Carvalho
5 (2)
Benvenuti nell'indicatore "BigPlayerRange", uno strumento di analisi tecnica sviluppato per identificare aree di interesse significative delle istituzioni finanziarie sui mercati. Questo indicatore fornisce un'analisi precisa degli intervalli di prezzo in cui i principali partecipanti al mercato dimostrano un'attività e un interesse considerevoli. Principali caratteristiche: 1. Mappatura delle Aree di Interesse Istituzionale: "BigPlayerRange" evidenzia con precisione le aree nel grafico in
Will Spread
Paulo Henrique Faquineli Garcia
The Larry Wiliams' indicator named WillSpread considers the influence of the secondary Asset (Symbol) on the current Asset (trading). Indicator essence is to transform the correlation between assets in accumulated history data, providing an opportunity to detect various peculiarities and patterns in price dynamics which are invisible to the naked eye. Based on this information, traders can assume further price movement and adjust their strategy accordingly. As exposed on his Book, Larry says: "a
Owl Smart Levels MT5
Sergey Ermolov
4.49 (37)
Versione MT4  |  FAQ L' indicatore Owl Smart Levels è un sistema di trading completo all'interno dell'unico indicatore che include strumenti di analisi di mercato popolari come i frattali avanzati di Bill Williams , Valable ZigZag che costruisce la corretta struttura a onde del mercato, e i livelli di Fibonacci che segnano i livelli esatti di entrata nel mercato e luoghi per prendere profitti. Descrizione dettagliata della strategia Istruzioni per lavorare con l'indicatore Consulente-assistente
All about time and price by ICT. This indicator provides a comprehensive view of ICT killzones, Silver Bullet times, and ICT Macros, enhancing your trading experience.  In those time windows price either seeks liquidity or imbalances and you often find the most energetic price moves and turning points. Features: Automatic Adaptation: The ICT killzones intelligently adapt to the specific chart you are using. For Forex charts, it follows the ICT Forex times: In EST timezone: Session: Asia: 20h00-0
Combined
Ahmed Alaaeldin Abdulrahman Ahmed Elherzawi
5 (1)
Welcome to Investment Castle products This product is exclusively available in the MQL5 market and is not available and will not be available anywehere else. The Combined indicator is a multi-time frame indicator and it is built using 3 indicators: Bands indicator which draws the support and resistance key levels using up to 5 different time frames Patterns indicator which draws the chart patterns using up to 6 different time frames Spots indicator which shows the common candlestick patterns Yo
Renko System
Marco Montemari
This indicator can be considered as a trading system. It offers a different view to see the currency pair: full timeless indicator, can be used for manual trading or for automatized trading with some expert advisor. When the price reaches a threshold a new block is created according to the set mode. The indicator beside the Renko bars, shows also 3 moving averages. Features renko mode median renko custom median renko 3 moving averages wicks datetime indicator for each block custom notificatio
The indicator detects and displays М. Gartley's Butterfly pattern. The pattern is plotted by the extreme values of the ZigZag indicator (included in the resources, no need to install). After detecting the pattern, the indicator notifies of that by the pop-up window, a mobile notification and an email. The pattern and wave parameters are displayed on the screenshots. The default parameters are used for demonstration purposes only in order to increase the amount of detected patterns. Parameters
LT Rainbow Trend
Thiago Duarte
5 (1)
Do you, like me, like to trade with the trend? Then this indicator will help you! Rainbow Trend is a trend indicator, which uses several Moving Averages on the chart. It measures different trend strenght zones for different periods: very long term, long term, mid term, short term and very short term. Each zone has its color, and it is possible to have sound alert when the prices leaves a zone and enters another. Its configuration is very simple. If you find any bug or have any suggestions, co
Point Black
Ignacio Agustin Mene Franco
Black Card Pack indicator 5/1 point black It has the strategy of professional bollingers where each arrow gives you a different entry signal. It is used to operate in m1 and in d1 It is used for scalping and intraday, modified for forex markets ! suitable for all pairs modified for synthetic index markets suitable for all pairs! Ideal for volatility and jumps!
Macd Rsi
Ignacio Agustin Mene Franco
macd rsi It is a macd indicator added to the rsi to capture perfect entries in the average crossovers! As seen in the indicator, it has 2 lines, one of gold color and the other violet line, where the cross of the violet with the gold downwards is a sell signal when it crosses the violet up from the gold it is a buy signal! very good to make shorts works for forex markets and synthetic indices It is used in any temporality! Good profit! World Investor.
Order Book, known also as Market Book, market depth, Level 2, - is a dynamically updated table with current volumes of orders to buy and to sell specific financial instument at price levels near Bid and Ask. MetaTrader 5 provides the means for receiving market book from your broker, but in real time only, without access to its history. The indicator OrderBook Cumulative Indicator accumulates market book data online and visualizes them on the chart. In addition, the indicator can show the market
Ichimoku Aiko MTF
Michael Jonah Randriamampionontsoa
Ichimoku Aiko MTF is a collection of technical indicators that show support and resistance levels, as well as momentum and trend direction. It is a multi-timeframe indicator so you don't need to change the chart timeframe when you want to see the ichimoku clouds on a higher timeframe.  eg. The chart timeframe is M15 and you want to see on the M15 timeframe chart the H1 ichimoku indicators (the ichimoku in Metatrader can't do that) that's why you need to use Ichimoku Aiko MTF.
Range Target
Ignacio Agustin Mene Franco
Range Target! indicator that marks the depletion of strength of the candle where it touches the floor and catches a trend, whether it is up or down The indicator has two support lines where it marks the floor and the ceiling. where on the same line marks the entry for rise or fall, the lines have Gold and Blue colors the gold line shows the purchase the blue line shows the sale works for any season works for forex markets works for synthetic index markets! Good Profit, World Investor.
Ichimoku Kinko Hyo is a purpose-built trend trading charting system that has been successfully used in nearly every tradable market. It is unique in many ways, but its primary strength is its use of multiple data points to give the trader a deeper, more comprehensive view into price action. This deeper view, and the fact that Ichimoku is a very visual system, enables the trader to quickly discern and filter "at a glance" the low-probability trading setups from those of higher probability. This i
MACalcAuto MT5
Tatiana Savkevych
As you know, the main invariable indicator of all traders is the moving average; it is used in some way in most strategies. It is also obvious that this indicator is capable of showing good entries in every local area. For which it usually needs to be optimized or just visually adjusted. This development is intended for automatic optimization of the indicator. Once placed on the chart, the indicator will automatically re-optimize itself with the specified period ( PeriodReOptimization ) and dis
The standard Bollinger Bands indicator has been improved by integrating additional indications from the Standard Deviation indicator (StdDev), which gives an additional filter for confirming trading signals. In addition, the color of the indicator's lines shows the beginning of a trend, its development and exhaustion. This indicator has a signal block that notifies the trader of the beginning of the trend on any time frame to which it is attached. Settings Type of messages - select the type of
L'indicatore costruisce le quotazioni attuali, che possono essere confrontate con quelle storiche e su questa base fanno una previsione del movimento dei prezzi. L'indicatore ha un campo di testo per una rapida navigazione fino alla data desiderata. Opzioni: Simbolo - selezione del simbolo che visualizzerà l'indicatore; SymbolPeriod - selezione del periodo da cui l'indicatore prenderà i dati; IndicatorColor - colore dell'indicatore; HorisontalShift - spostamento delle virgolette d
Golden Hunter MT5
Rodrigo Arana Garcia
ULTIMA COPIA A $75 ---> Avanti: $99 !!!  Versione MT4 Golden Hunter   è stato sviluppato per i trader che operano manualmente sui mercati. Si tratta di uno strumento molto potente composto da 3 diversi indicatori: Potente strategia di ingresso: formata da un indicatore che misura la volatilità della coppia di valute e identifica la tendenza del mercato. LSMA: attenua i dati di prezzo ed è utile per individuare la tendenza a breve termine. Heikin Ashi: una volta collegato l'indicatore al grafico
Donchian Channel DC is the indicator of Donchian Channels, that plots maximum and minimum values of a specific period, besides mean value line. It´s possible to configure simple period for analysis and the indicator will plot all three values. You can trade with this indicator as trend or reversal, according to each strategy. Do not let to test others indicators as soon as others expert advisors.
Slopes are an increasingly key concept in Technical Analysis. The most basic type is to calculate them on the prices, but also on technical indicators such as moving averages and the RSI. In technical analysis, you generally use the RSI to detect imminent reversal moves within a range. In the case of the Blue indicator, we are calculating the slope of the market price and then calculating the RSI of that slope in order to detect instances of reversal. The Blue indicator is therefore used
Size Bars
Viktor Loginov
Size Bars – индикатор отображает на графике максимальный, минимальный, текущий и средний размер баров (свечей) за выбранный период. Отображаемые параметры индикатора Size Bars: 1)       Текущий размер бара в писах (по максимум/минимум, тело бара). 2)       Максимальный, минимальный и средний размер свечей BUY . 3)       Максимальный, минимальный, средний размер свечей SELL . 4)       Количество свечей BUY и количество свечей SELL . 5)       Среднее количество свечей подряд BUY и SELL . 6)    
Ichimoku MTF
Hoang Ngoc Thach
MTF Ichimoku is a MetaTrader 5 indicator based on well known Ichimoku. In MetaTrader 5 we have Ichimoku already included as a standard technical indicator. However it can be used only for the current timeframe. When we are looking for a trend, it is very desirable to have Ichimokuis showing higher timeframes. MTF Ichimoku presented here has additional parameter - TimeFrame. You can use it to set up higher timeframe from which Ichimokuis will calculate its values. Other basic parameters are not c
Il Catturatore di Tendenza: La Strategia del Catturatore di Tendenza con Indicatore di Allarme è uno strumento versatile di analisi tecnica che aiuta i trader a identificare le tendenze di mercato e i potenziali punti di ingresso e uscita. Presenta una Strategia dinamica del Catturatore di Tendenza, adattandosi alle condizioni di mercato per una chiara rappresentazione visiva della direzione della tendenza. I trader possono personalizzare i parametri in base alle loro preferenze e tolleranza
FREE
CrossMAn MT5
Pavel Verveyko
"CrossMAn" is a table indicator that gives signals about the intersection of two moving averages, on selected instruments and time periods. The intersection of moving averages is one of the most popular signals on the stock exchange. The signal is displayed as colored rectangles in the table. Thus, you can assess at a glance which tool should be paid attention to. (Crossman does not add moving averages to the chart.) The indicator table can be dragged with the mouse. The size of the table
Renko Plus
Eadvisors Software Inc.
With Renko Plus you can use the features in the Indicator functionality, just add it to the Metatrader5 chart.             The Renko chart is a type of chart, developed by the Japanese, that is constructed using price movement rather than standardized prices and time intervals like most charts. It is believed to be named after the Japanese word for bricks, "renga", as the graphic looks like a series of bricks.             A new brick is created when the price moves a specified p
Candle Pattern Finder MT5
Pavel Zamoshnikov
4.33 (6)
This indicator searches for candlestick patterns. Its operation principle is based on Candlestick Charting Explained: Timeless Techniques for Trading Stocks and Futures by Gregory L. Morris. If a pattern is detected, the indicator displays a message at a bar closure. If you trade using the MetaTrader 4 terminal, then you can download the full analogue of the " Candle Pattern Finder for MT4 " indicator It recognizes the following patterns: Bullish/Bearish (possible settings in brackets) : Hamme
Follow The Line MT5
Oliver Gideon Amofa Appiah
4.4 (30)
This indicator obeys the popular maxim that: "THE TREND IS YOUR FRIEND" It paints a GREEN line for BUY and also paints a RED line for SELL. (you can change the colors). It gives alarms and alerts of all kinds. IT DOES NOT REPAINT and can be used for all currency pairs and timeframes. Yes, as easy and simple as that. Even a newbie can use it to make great and reliable trades. NB: For best results, get my other premium indicators for more powerful and reliable signals. Get them here: https://www.m
FREE
Gino Renko
Stephane, Andr Valette
1 (1)
Another renko-based indicator. It returns different usable values ​​for an EA, and is directly displayed on the main chart. Its setting is very simple: The size of the renko The number of bars taken into account The falling color The color on the rise Returned values: Buffer 0 : Value of the middle Buffer 1 : Value of the Top Buffer 2 : Value of the Bottom Buffer 3 : Direction of renko (0.0 for top ; 1.0 for bottom) Buffer 4 : Ratio of the renko, for example, if it is twice, 3 times, ro more of
PipFinite Trend PRO MT5
Karlo Wilson Vendiola
4.87 (665)
Breakthrough Solution For Trend Trading And Filtering With All Important Features Built Inside One Tool! Trend PRO's smart algorithm detects the trend, filters out market noise and gives entry signals with exit levels. The new features with enhanced rules for statistical calculation improved the overall performance of this indicator. Important Information Revealed Maximize the potential of Trend Pro, please visit www.mql5.com/en/blogs/post/713938 The Powerful Expert Advisor Version Automa
HLC bar MT5 Wyckoff
Eduardo Da Costa Custodio Santos
L'indicatore "HLC_bar_MT5 Wyckoff" per MT5 è stato creato per facilitare l'analisi al momento del trading. La barra HLC è stata utilizzata da Richard Wyckoff ed è attualmente ampiamente utilizzata nelle operazioni "VSA". Wyckoff ha scoperto che l'utilizzo di High, Low e Close ha reso il grafico molto più pulito e più facile da analizzare. L'indicatore "HLC_bar_MT5 Wyckoff" consente: # Cambia la larghezza della barra; # Lascia la barra dello stesso colore; # Ed evidenzia la barra che si è aperta
Gli utenti di questo prodotto hanno anche acquistato
Innanzitutto è importante sottolineare che questo sistema di trading è un indicatore Non-Repainting, Non-Redrawing e Non-Lagging, il che lo rende ideale sia per il trading manuale che per quello automatico. Il "Sistema di Trading Smart Trend MT5" è una soluzione completa pensata sia per i trader principianti che per quelli esperti. Combina oltre 10 indicatori premium e offre più di 7 robuste strategie di trading, rendendolo una scelta versatile per diverse condizioni di mercato. Strategia di Tre
Atomic Analyst MT5
Issam Kassas
5 (12)
Innanzitutto, vale la pena sottolineare che questo indicatore di trading non è repaint, non è ridisegno e non presenta ritardi, il che lo rende ideale sia per il trading manuale che per quello automatico. L'Analista Atomico è un indicatore di azione del prezzo PA che utilizza la forza e il momentum del prezzo per trovare un miglior vantaggio sul mercato. Dotato di filtri avanzati che aiutano a rimuovere rumori e segnali falsi, e aumentare il potenziale di trading. Utilizzando più strati di in
Quantum Trend Sniper
Bogdan Ion Puscasu
5 (38)
Presentazione       Quantum Trend Sniper Indicator   , l'innovativo indicatore MQL5 che sta trasformando il modo in cui identifichi e scambi le inversioni di tendenza! Sviluppato da un team di trader esperti con un'esperienza di trading di oltre 13 anni,       Indicatore Quantum Trend Sniper       è progettato per spingere il tuo viaggio di trading verso nuove vette con il suo modo innovativo di identificare le inversioni di tendenza con una precisione estremamente elevata. *** Acquista Quant
FX Volume MT5
Daniel Stein
4.94 (17)
Ricevi il tuo aggiornamento quotidiano sul mercato con dettagli e schermate tramite il nostro Morning Briefing qui su mql5 e su Telegram ! FX Volume è il PRIMO e UNICO indicatore di volume che fornisce una visione REALE del sentiment del mercato dal punto di vista del broker. Fornisce informazioni straordinarie su come gli operatori di mercato istituzionali, come i broker, sono posizionati sul mercato Forex, molto più velocemente dei rapporti COT. Vedere queste informazioni direttamente sul vo
Trend Screener Pro MT5
STE S.S.COMPANY
4.87 (62)
Indicatore di tendenza, soluzione unica rivoluzionaria per il trading di tendenze e il filtraggio con tutte le importanti funzionalità di tendenza integrate in un unico strumento! È un indicatore multi-timeframe e multi-valuta al 100% non ridipingibile che può essere utilizzato su tutti i simboli/strumenti: forex, materie prime, criptovalute, indici e azioni. Trend Screener è un indicatore di tendenza che segue un indicatore efficiente che fornisce segnali di tendenza a freccia con punti nel gra
Advanced Supply Demand MT5
Bernhard Schweigert
4.53 (15)
La migliore soluzione per qualsiasi principiante o trader esperto! Questo indicatore è uno strumento di trading unico, di alta qualità e conveniente perché abbiamo incorporato una serie di funzionalità proprietarie e una nuova formula. Con questo aggiornamento, sarai in grado di mostrare fusi orari doppi. Non solo potrai mostrare una TF più alta, ma anche entrambe, la TF del grafico, PIÙ la TF più alta: SHOWING NESTED ZONES. Tutti i trader di domanda di offerta lo adoreranno. :) Informazioni imp
Innanzitutto, vale la pena sottolineare che questo Strumento di Trading è un Indicatore Non-Ridipingente, Non-Ridisegnante e Non-Laggante, il che lo rende ideale per il trading professionale. L'Indicatore Smart Price Action Concepts è uno strumento molto potente sia per i nuovi che per i trader esperti. Racchiude più di 20 utili indicatori in uno solo, combinando idee di trading avanzate come l'Analisi del Trader del Circolo Interno e le Strategie di Trading dei Concetti del Denaro Intelligen
MetaForecast M5
Vahidreza Heidar Gholami
5 (2)
MetaForecast predice e visualizza il futuro di qualsiasi mercato basandosi sull'armonia dei dati dei prezzi. Sebbene il mercato non sia sempre prevedibile, se esiste un modello nei prezzi, MetaForecast può prevedere il futuro con la massima precisione possibile. Rispetto ad altri prodotti simili, MetaForecast può generare risultati più accurati analizzando le tendenze di mercato. Parametri di input Past size (Dimensione passata) Specifica il numero di barre che MetaForecast utilizza per creare
TPSproTREND PrO MT5
Roman Podpora
5 (6)
TPSpro TRENDPRO  - is a trend indicator that automatically analyzes the market and provides information about the trend and each of its changes, as well as giving signals for entering trades without redrawing! The indicator uses each candle, analyzing them separately. referring to different impulses - up or down impulse. Exact entry points into transactions for currencies, crypto, metals, stocks, indices!  -  Version MT4                  DETAILED DESCRIPTION        /       TRADING SETUPS       
A key element in trading is zones or levels from which decisions to buy or sell a trading instrument are made. Despite attempts by major players to conceal their presence in the market, they inevitably leave traces. Our task was to learn how to identify these traces and interpret them correctly. Reversal First Impulse levels (RFI)   -  Version MT4                  INSTRUCTIONS                 RUS                 ENG                         R ecommended to use with an indicator   -  TREND PRO  
AW Trend Predictor MT5
AW Trading Software Limited
4.77 (56)
La combinazione di trend e livelli di rottura in un unico sistema. Un algoritmo di indicatore avanzato filtra il rumore del mercato, determina la tendenza, i punti di ingresso e i possibili livelli di uscita. I segnali indicatori sono registrati in un modulo statistico, che permette di selezionare gli strumenti più adatti, mostrando l'efficacia dello storico dei segnali. L'indicatore calcola i segni Take Profit e Stop Loss. Manuale e istruzioni ->   QUI   / versione MT4 ->   QUI Come fare tradi
Top indicator for MT5   providing accurate signals to enter a trade without repainting! It can be applied to any financial assets:   forex, cryptocurrencies, metals, stocks, indices .  Watch  the video  (6:22) with an example of processing only one signal that paid off the indicator! MT4 version is here It will provide pretty accurate trading signals and tell you when it's best to open a trade and close it. Most traders improve their trading results during the first trading week with the help of
Quantum Heiken Ashi PRO MT5
Bogdan Ion Puscasu
4.5 (8)
Ti presentiamo   Quantum Heiken Ashi PRO Progettate per fornire informazioni chiare sulle tendenze del mercato, le candele Heiken Ashi sono rinomate per la loro capacità di filtrare il rumore ed eliminare i falsi segnali. Dì addio alle confuse fluttuazioni dei prezzi e dai il benvenuto a una rappresentazione grafica più fluida e affidabile. Ciò che rende il Quantum Heiken Ashi PRO davvero unico è la sua formula innovativa, che trasforma i dati tradizionali delle candele in barre colorate di faci
Gartley Hunter Multi
Siarhei Vashchylka
5 (6)
Gartley Hunter Multi - An indicator for searching for harmonic patterns simultaneously on dozens of trading instruments and on all classic timeframes: (m1, m5, m15, m30, H1, H4, D1, Wk, Mn). Manual (Be sure to read before purchasing) | Version for MT4 Advantages 1. Patterns: Gartley, Butterfly, Shark, Crab. Bat, Alternate Bat, Deep Crab, Cypher 2. Simultaneous search for patterns on dozens of trading instruments and on all classic timeframes 3. Search for patterns of all possible sizes. Fr
Noize Absorption Index - is the manual trading system that measures the difference of pressure between bears forces and bulls forces. Green line - is a noize free index that showing curent situation. Zero value of index shows totally choppy/flat market.Values above zero level shows how powerfull bullish wave is and values below zero measures bearish forces.Up arrow appears on bearish market when it's ready to reverse, dn arrow appears on weak bullish market, as a result of reverse expectation.
FX Power MT5 NG
Daniel Stein
5 (5)
Ricevi il tuo aggiornamento quotidiano sul mercato con dettagli e schermate tramite il nostro Morning Briefing qui su mql5 e su Telegram ! FX Power MT5 NG è la nuova generazione del nostro popolare misuratore di forza delle valute, FX Power. Cosa offre questo misuratore di forza di nuova generazione? Tutto ciò che avete amato dell'FX Power originale IN PIÙ Analisi della forza di ORO/XAU Risultati di calcolo ancora più precisi Periodi di analisi configurabili individualmente Limite di calcolo pe
RelicusRoad Pro MT5
Relicus LLC
4.82 (22)
Ora $ 147 (aumentando a $ 499 dopo alcuni aggiornamenti) - account illimitati (PC o MAC) Manuale utente di RelicusRoad + Video di formazione + Accesso al gruppo Discord privato + Stato VIP UN NUOVO MODO DI GUARDARE IL MERCATO RelicusRoad è l'indicatore di trading più potente al mondo per forex, futures, criptovalute, azioni e indici, fornendo ai trader tutte le informazioni e gli strumenti di cui hanno bisogno per rimanere redditizi. Forniamo analisi tecniche e piani di trading per aiutar
ICT, SMC, SMART MONEY CONCEPTS, SMART MONEY, Smart Money Concept, Support and Resistance, Trend Analysis, Price Action, Market Structure, Order Blocks, BOS/CHoCH,   Breaker Blocks ,  Momentum Shift,   Supply&Demand Zone/Order Blocks , Strong Imbalance,   HH/LL/HL/LH,    Fair Value Gap, FVG,  Premium  &   Discount   Zones, Fibonacci Retracement, OTE, Buy Side Liquidity, Sell Side Liquidity, BSL/SSL Taken, Equal Highs & Lows, MTF Dashboard, Multiple Time Frame, BigBar, HTF OB, HTF Market Structure
La soluzione migliore per ogni principiante o trader esperto! Questo indicatore è uno strumento di trading unico, di alta qualità e conveniente perché abbiamo incorporato una serie di caratteristiche proprietarie e una formula segreta. Con un solo grafico fornisce avvisi per tutte le 28 coppie di valute. Immaginate come migliorerà il vostro trading perché sarete in grado di individuare l'esatto punto di innesco di una nuova tendenza o opportunità di scalping! Costruito su nuovi algoritmi so
Professional Scalping Tool on Deriv Attention! The indicator will be sold in limited quantities!!! The previous 5 copies were sold for $250 The next 5 copies will be sold for $350 The next price is $500 Description: This trading indicator is designed for professional traders focused on scalping. Designed with the market in mind, it provides highly accurate spike trading signals. It works on the M1 timeframe and supports the following symbols: Boom 300 Index, Boom 500 Index, Boom 1000 Index,
Volume by Price MT5
Brian Collard
5 (3)
The Volume by Price Indicator for MetaTrader 5 features Volume Profile and Market Profile TPO (Time Price Opportunity). Get valuable insights out of currencies, equities and commodities data. Gain an edge trading financial markets. Volume and TPO histogram bar and line charts. Volume Footprint charts. TPO letter and block marker charts including split structures. Versatile segmentation and compositing methods. Static, dynamic and flexible ranges with relative and/or absolute visualizations. Lay
Blahtech Supply Demand MT5
Blahtech Limited
4.57 (14)
Was: $299  Now: $99   Supply Demand uses previous price action to identify potential imbalances between buyers and sellers. The key is to identify the better odds zones, not just the untouched ones. Blahtech Supply Demand indicator delivers functionality previously unavailable on any trading platform. This 4-in-1 indicator not only highlights the higher probability zones using a multi-criteria strength engine, but also combines it with multi-timeframe trend analysis, previously confirmed swings
Italo Volume Indicator MT5
Italo Santana Gomes
4.73 (15)
BUY INDICATOR AND GET EA FOR FREE AS A BONUS + SOME OTHER GIFTS! ITALO VOLUME INDICATOR  is the best volume indicator ever created, and why is that? The Indicator works on all time-frames and assets, indicator built after 7 years of experience on forex and many other markets. You know many volume indicators around the internet are not complete, does not help, and it's difficult to trade, but the Italo Volume Indicator is different , the Italo Volume Indicator shows the wave volume, when market
Presentazione       Quantum Breakout PRO   , l'innovativo indicatore MQL5 che sta trasformando il modo in cui scambi le zone di breakout! Sviluppato da un team di trader esperti con un'esperienza di trading di oltre 13 anni,       Quantum Breakout PRO       è progettato per spingere il tuo viaggio di trading a nuovi livelli con la sua strategia innovativa e dinamica della zona di breakout. Quantum Breakout Indicator ti fornirà frecce di segnalazione sulle zone di breakout con 5 zone target
Auto Order Block with break of structure based on ICT and Smart Money Concepts Futures Break of Structure ( BoS )             Order block ( OB )            Higher time frame Order block / Point of Interest ( POI )    shown on current chart           Fair value Gap ( FVG ) / Imbalance   ,  MTF      ( Multi Time Frame )    Volume Imbalance     ,  MTF          vIMB Gap’s Equal High / Low’s     ,  MTF             EQH / EQL Liquidity               Current Day High / Low           HOD /
IX Power MT5
Daniel Stein
5 (2)
IX Power   porta finalmente l'imbattibile precisione di FX Power ai simboli non-Forex. Determina con precisione l'intensità delle tendenze a breve, medio e lungo termine dei vostri indici preferiti, azioni, materie prime, ETF e persino criptovalute. Potete   analizzare tutto ciò che   il vostro terminale ha da offrire. Provatelo e sperimentate come   il vostro tempismo migliori significativamente   durante il trading. Caratteristiche principali di IX Power Risultati di calcolo precisi al
Good day! I present to you a trading technical indicator for Deriv broker synthetic indices. This indicator ONLY works with the following indices: Boom 300 Index Boom 500 Index Boom 1000 Index Crash 300 Index Crash 500 Index Crash 1000 Index The indicator was created to give signals to open medium-term trades in the direction of Spikes. But you can open trades in the opposite direction to Spikes, at your own risk. Trade only on M1. Other TFs do not guarantee the correct operation of the indic
Il dashboard di avviso RSI / TDI ti consente di monitorare gli RSI contemporaneamente (selezionabili da te) su ogni coppia principale scambiata. Puoi usarlo in due modi: 1. Seleziona più intervalli di tempo e il trattino ti mostrerà quando ci sono più intervalli di tempo estesi oltre le normali condizioni di trading. Un ottimo indicatore del fatto che il prezzo ha spinto al massimo di recente poiché ha raggiunto un livello di ipercomprato o ipervenduto su più intervalli di tempo, quindi u
Innanzitutto, è importante sottolineare che questo sistema di trading è un indicatore non repainting, non redrawing e non lagging, il che lo rende ideale per il trading professionale. Il "Sistema di Trading di Supporto e Resistenza Intelligente" è un indicatore avanzato progettato per trader nuovi ed esperti. Permette ai trader di ottenere precisione e fiducia sul mercato forex. Questo sistema completo combina più di 7 strategie, 10 indicatori e varie approcci di trading, tra cui strategie di
TrendDecoder Premium MT5
Christophe, Pa Trouillas
5 (1)
Identificare i range e le prossime mosse probabili     |    Ottenere i primi segnali e la forza delle tendenze     |    Ottenere uscite chiare prima dell'inversione     |    Individuare i livelli di Fibo che il prezzo testerà   |  Indicatore non tracciante e non ritardato - ideale per il trading manuale e automatizzato - adatto a tutti gli asset e a tutte le unità temporali 50% di sconto   - per il lancio poi torna a   >>   149 $ Dopo l'acquisto,   contattatemi su questo canale  per le impostazi
Altri dall’autore
La strategia di trading di tendenza "Super Trend flessibile Alert EA" si basa sull'indicatore con lo stesso nome "Super Trend flessibile Alert". L'advisor utilizza tutte le informazioni dell'indicatore, quindi l'advisor ha solo tre parametri, questi sono: “Tempo di lavoro” – specifica il periodo di tempo di lavoro, il periodo di tempo in cui viene creato l’indicatore e anche da cui vengono presi i dati “OHLC”. "Stop Loss" è la dimensione costante dello stop loss, misurata in "punti" (puoi veder
Descrizione: L'indicatore "Struttura del mercato HH HL LH LL" è uno strumento potente e allo stesso tempo semplice per analizzare la dinamica dei prezzi nei mercati finanziari. Questo indicatore aiuta i trader e gli investitori a identificare i cambiamenti nelle tendenze e a identificare i punti importanti nelle serie temporali dei prezzi. Componenti chiave dell’indicatore: HH (Higher High): il massimo al quale il prezzo chiude sopra il massimo precedente. HH indica un rafforzamento del t
L'indicatore di tendenza "   Avviso flessibile Super Trend   " ha un minimo di impostazioni. Questo indicatore è progettato per essere il più facile possibile da usare. L'indicatore mostra il trend con una linea principale colorata (linea "SuperTrend", che puoi vedere nella finestra "Finestre dati"). Inoltre, nei punti in cui il trend cambia, l'indicatore mostra delle frecce colorate (   icone "STBuy" e "   STSell", che puoi vedere nella finestra "Finestre dati"       ). Nei punti in cui la tend
L’indicatore mostra una divergenza rialzista e ribassista. L'indicatore stesso (come il normale stocastico) viene visualizzato in una sottofinestra. Interfaccia grafica   : Nella finestra principale vengono creati oggetti grafici "linea di tendenza" - prodotti dal prezzo "Basso" al prezzo "Basso" (per divergenza rialzista) e prodotti dal prezzo "Alto" al prezzo "Alto" (per divergenza ribassista) ). L'indicatore disegna nella sua finestra utilizzando esclusivamente buffer grafici: “Main”, “Signa
L'indicatore 'Supertrend MetaTrader 5' è la base del più semplice sistema di trend trading. Eppure rimane molto efficace. L'indicatore funziona su qualsiasi periodo di tempo (sul periodo di tempo del grafico corrente). Dal nome puoi vedere che questo indicatore segue la tendenza e quando la tendenza cambia, l'indicatore mostra accuratamente il punto del cambiamento di tendenza. La base di "Supertrend MetaTrader 5" è il confronto dei valori del prezzo e dell'indicatore "Average True Range" molti
The Candle Length Indicator Alarm generates a sound alert, sends a push notification and an email when the size of the current candlestick changes. The size of the current candlestick can be measured in two ways: The first method: the size of the candlestick is measured from the beginning of the candlestick (from the OPEN price). The second method: the size of the candlestick is measured from current price. The indicator has the following settings: sound — a sound file from the folder: "...\Meta
The Buy Sell Color Background indicator changes the background color depending on position direction. It has three settings: Background color for BUY - background color for a Buy position Background color for SELL - background color for a Sell position Default background color - background color with no open position After you detach the indicator from a chart, its background color changes to Default background color .
The calculator of signals operates directly from the MetaTrader 5 terminal, which is a serious advantage, since the terminal provides a preliminary selection and sorts out signals. This way, users can see in the terminal only the signals that ensure a maximum compatibility with their trading accounts. The calculator of signals gives the answer to the one of the questions most frequently asked by users of the Signals service: "Will I be able to subscribe to the signal NNN, and what volume of the
Arrow Signal
Vladimir Karputov
Questo indicatore appartiene alla categoria "Stocastico". Ho cercato di semplificare il più possibile il controllo dell'indicatore, quindi le impostazioni minime sono mostrate nei parametri di input: questa è la scelta di un'icona per le frecce di segnale. Il segnale "Acquista" è codificato con il   parametro "Codice freccia Acquista   " e il segnale "Vendi" è codificato con il parametro "   Codice freccia Vendi".   I codici freccia del segnale per i segnali (si prega di utilizzare i valori da 3
Arrow Signal EA
Vladimir Karputov
An Expert Advisor based on the custom indicator. Search for a signal at every tick. Positions are closed by an opposite signal. No trailing. There is no stop loss. There is no take profit. Has a minimum of settings Money management: Lot OR Risk   - type Money management The value for "Money management"   - Money management value Deviation   - admissible slippage Buy Arrow code   (font Wingdings) - character code from 'Wingdings' font for BUY signals Sell Arrow code   (font Wingdings) - characte
Ma Dema Alert
Vladimir Karputov
L'indicatore visualizza tre linee e monitora due tipi di intersezioni. Tre linee dell'indicatore: "   MA   " - indicatore lento "Media mobile", "   DEMA Slow   " - indicatore lento "   Double Exponential Moving Average" e "   DEMA Fast   " - indicatore veloce "Double Exponential Moving Average". Due tipi di intersezioni       : "   Alert Price MA   " - il prezzo attraversa la   linea "MA" e   "   Alert DEMA DEMA   " - le linee si incrociano       "DEMA lento" e   "DEMA veloce   ". Durante l'attr
Questo Expert Advisor appartiene alla classe delle utilità per il trading manuale e semiautomatico. L'"   ordine in sospeso agli estremi del giorno   " EA colloca due ordini in sospeso agli estremi del giorno precedente. Parametro "   Ordini in sospeso: ...       " permette di selezionare il tipo di ordini pendenti: "   Buy Stop e Sell Stop   " o "   Buy Limit e Sell Limit   "   .       estremo       L'offset "Basso" viene eseguito verso il basso). "   Nuovi pendenti -> cancella precedenti   " i
Il pannello di utilità "Panel Partial Closure" è destinato alla rapida chiusura parziale di una posizione che ha un profitto. Ha solo due parametri: "   Chiusura parziale #1   " e "   Chiusura parziale #2   ". Funziona per qualsiasi simbolo e per qualsiasi "numero magico", ovvero l'utilità è destinata principalmente al trading manuale. Come funziona: Ad esempio, hai diverse posizioni su "EURUSD", "Jump 100 Index" e "XAUUSD" (oro). L'utility trova la posizione con il maggior profitto - nello scre
Indicatore MQL5 "Resistenza e supporto giornalieri": disegna linee di supporto e resistenza giornaliere. Il disegno viene eseguito solo con l'ausilio di oggetti grafici (linee di tendenza) - i buffer indicatori non vengono utilizzati in questo indicatore. L'indicatore non ha impostazioni - la ricerca dei livelli viene effettuata sulle ultime 500 barre dall'intervallo di tempo "D1" e questo parametro è cablato all'interno del codice. Trading manuale: Quando si fa trading manualmente, si consigli
L'utility "   Multi Symbol Trailing   " sposta lo Stop Loss per tutte le posizioni attualmente aperte (multi-symbol trailing). È destinato principalmente ad assistere nel trading manuale. Non ci sono restrizioni per l'utilità né per il nome della coppia di valute né per l'identificatore individuale (numero magico): l'utilità elabora assolutamente tutte le posizioni attualmente aperte. L'unità di misura dei parametri "   Trailing Stop   " e "   Trailing Step   " è il punto (la differenza tra il p
L'indicatore di tendenza "Trend Two Moving Average" utilizza due tipi di freccia per visualizzare i risultati del calcolo: "Trend UP" e "Trend DN".       Frecce "Trend Up"       sono disegnate       Di       prezzo       'Basso'       barra   ,       UN       Frecce "Trend DN" -       Di       prezzo       'alto'. L'algoritmo di ricerca dei trend si basa sull'analisi del prezzo di una barra e dei valori di due indicatori di 'Media Mobile'. La direzione del trend è calcolata sulla barra corrente
Three TimeFrames
Vladimir Karputov
Pannello indicatore a tre TimeFrames. L'indicatore è realizzato sotto forma di un pannello basato sulla classe CAppDialog. Il pannello può essere ridotto a icona o spostato all'interno del grafico corrente utilizzando il mouse. L'indicatore mostra tre tempi del simbolo corrente nel pannello. Nella versione attuale, l'indicatore ha un numero minimo di impostazioni: questi sono i parametri di tre periodi di tempo: "Frame di tempo più giovane", "   Frame di tempo   medio   " e "   Frame di tempo  
L'indicatore "   Market Session Times   " mostra il tempo di quattro sessioni di negoziazione: Asia, Europa, America e Pacifico. L'orario delle sessioni di negoziazione è impostato   nel formato       GMT e quindi non dipende affatto dal server di trading. Vengono utilizzati i seguenti dati: Sessione di negoziazione Città GMT Asia Tokio Singapore Shangai 00:00-06:00 01:00-09:00 01:30-07:00 Europa Londra Francoforte 07:00-15:30 07:00-15:30 America New York Chicago 13:30-20:00 13:30-
Constant stream
Vladimir Karputov
Sistema di trading per una varietà di transazioni commerciali. Consente di impostare il saldo in modo che oscilli intorno allo zero, utilizzato per attività di sconto specifiche o simili. Configurato per funzionare con   conti di copertura.   Non può esserci più di una posizione nel mercato   . Un'impostazione generale, il parametro "   Step, Stop Loss, Take Profit   " viene misurato in punti (esempio per EURUSD: 1.00055-1.00045 = 10 punti). L'advisor interrompe il trading (rimanendo sul grafico
L'indicatore mostra i frattali dal periodo di tempo più elevato. È possibile visualizzare due tipi di frattali: 'Frattale regolare' e 'Frattale BW'. Consideriamo la formazione del frattale 'SU'. Il "frattale regolare" è un frattale molto rigoroso in cui ogni successivo prezzo "alto" (a sinistra e a destra della barra centrale) è più piccolo. Mentre in 'BW Fractal' c'è una sola condizione: la barra centrale (il suo prezzo 'alto') deve essere la più alta. Visivamente, la differenza tra queste due
Resistenza al supporto dell'IA Questo è un indicatore che cerca le linee “Supporto” e “Resistenza”. La ricerca viene effettuata utilizzando un algoritmo per l'analisi numerica e l'elaborazione dei dati. Sono disponibili tre opzioni di ricerca (“modalità n. 1”, “modalità n. 2” e “modalità n. 3”). Ognuna di queste opzioni differisce nel suo algoritmo interno (al momento si tratta di impostazioni completamente interne, non sono disponibili per l'utente). Possiamo dire che queste opzioni differiscon
Open Time Manager
Vladimir Karputov
L'utilità "   Open Time Manager   " apre una posizione a un'ora specificata e quindi attiva il trailing classico. L'ora ("   Ora   ":"   Minuti   ") è sempre impostata nel fuso orario GMT con un offset GMT Offset. E' possibile selezionare tre opzioni per l'apertura di una posizione utilizzando il parametro '   Modalità Trade   ': '   ACQUISTARE   ' '   VENDERE   ' '   ACQUISTA e VENDI (contemporaneamente)   ' '   OFF (no scambi, solo lavori finali)   ' Il quarto parametro viene utilizzato quand
Indicatore           mostra le linee "Supporto" e "Resistenza" (queste linee sono disegnate utilizzando lo stile di disegno DRAW_LINE - cioè non sono oggetti grafici). La ricerca di nuovi minimi e massimi avviene a sinistra e a destra della "barra del segnale" - la "barra del segnale" è il centro convenzionale di ogni nuova costruzione. Perché la parola Flessibile nel nome dell'indicatore? Perché abbiamo la possibilità di specificare un numero diverso di barre a sinistra (“Left Bars”) e a destra
Il dashboard scansiona le letture di due indicatori: "MACD" e "Stocastico". Visualizza i segnali in tre colonne: per MACD, per Stocastico e la colonna risultante (se il segnale è lo stesso per entrambi gli indicatori). La scansione può essere selezionata su uno o più intervalli temporali. Se disabiliti tutti gli intervalli di tempo, la dashboard verrà comunque caricata, ma con impostazioni specifiche per questi casi. I segnali vengono sempre controllati per la barra zero (la barra zero è la barr
Filtro:
Nessuna recensione
Rispondi alla recensione
Versione 1.1 2024.04.25
New extension