• Panoramica
  • Recensioni
  • Commenti
  • Novità

Support and Resistance Flexible Bars

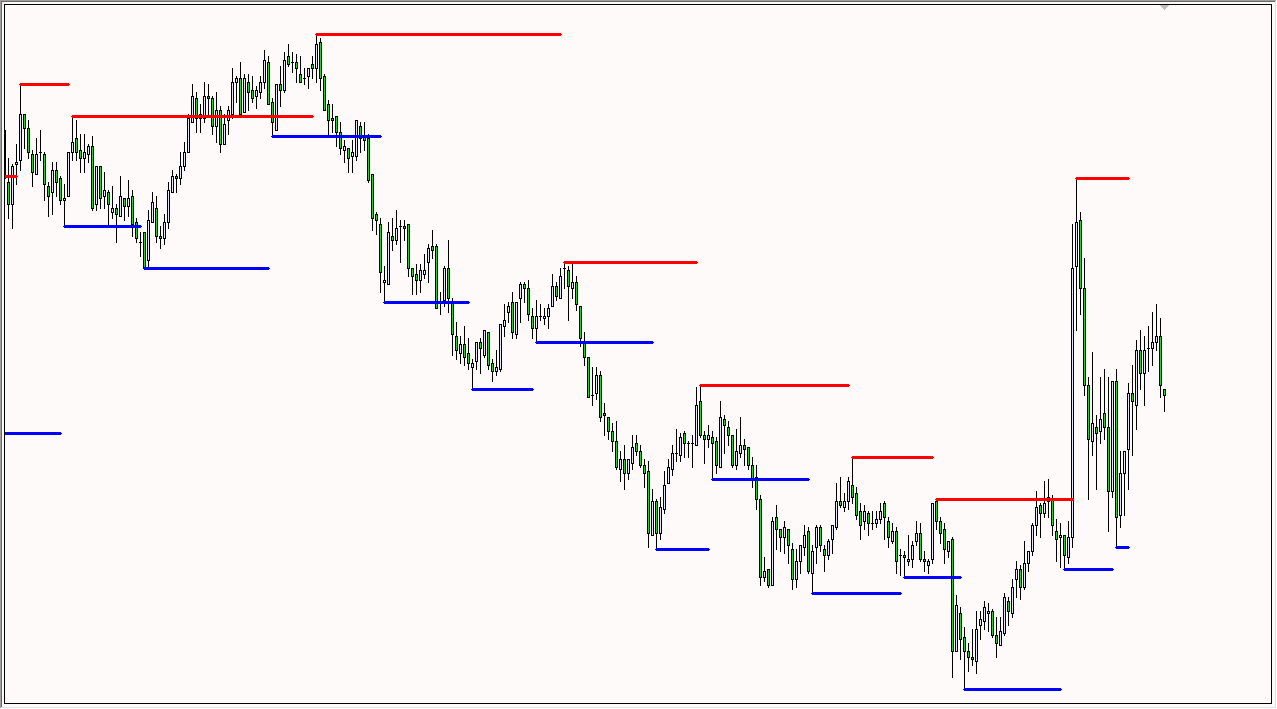
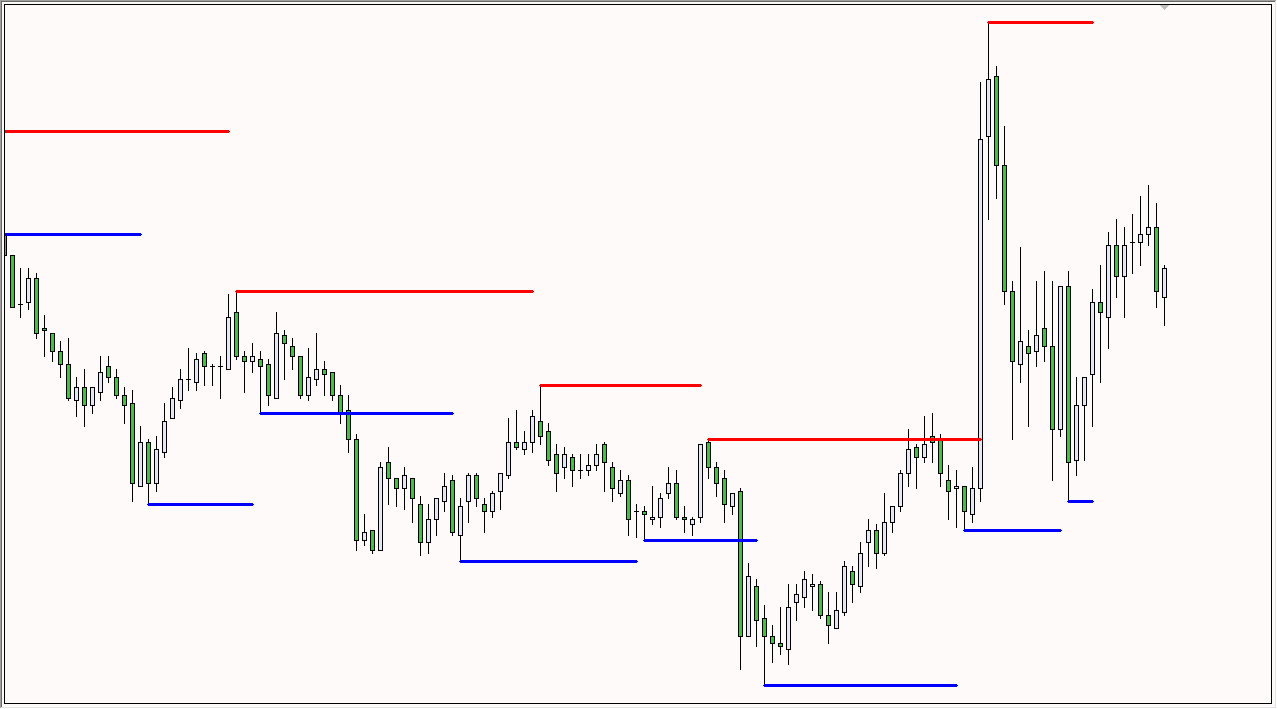
Indicatore     mostra le linee "Supporto" e "Resistenza" (queste linee sono disegnate utilizzando lo stile di disegno DRAW_LINE - cioè non sono oggetti grafici).

La ricerca di nuovi minimi e massimi avviene a sinistra e a destra della "barra del segnale" - la "barra del segnale" è il centro convenzionale di ogni nuova costruzione.

Perché la parola Flessibile nel nome dell'indicatore? Perché abbiamo la possibilità di specificare un numero diverso di barre a sinistra (“Left Bars”) e a destra (“Right Bars”) della “barra del segnale”.

Le linee degli indicatori vengono disegnate sul grafico dalla “Barra del segnale” a destra sulle barre delle “Barre di destra”.

Caratteristiche   :

Per una visualizzazione più bella nell'indicatore vengono utilizzati due buffer "Supporto" e due buffer "Resistenza" (questa soluzione tecnica è legata alle limitazioni degli stili di disegno in MQL5).

Cosa potrebbe apparire in futuro   :

Avviso sonoro o (e) nuovi indicatori (Freccia).

Come utilizzare l'indicatore   :

Questo indicatore è stato creato principalmente per il trading manuale, quindi l'utente deve solo monitorare i due buffer dell'indicatore "Supporto" e "Resistenza", nonché il prezzo corrente. Particolare attenzione dovrebbe essere prestata ai momenti in cui il prezzo attraversa la linea dell'indicatore e poi ritorna (dopo diverse barre).


Prodotti consigliati
Volume Waves
Paulo Henrique Faquineli Garcia
One of the best tools for analyzing volume, Weis Wave was devised by David Weis to facilitate reading the directional flow. For the disciples of the Wyckoff method, this means an evolution, facilitating a predictive reading of the market, always looking for Accumulation and Distribution zones for traded assets. For better understanding, in this indicator we try to cover every reading of EFFORT (traded volume) versus RESULT (price change). Thus, you can apply the indicator on the chart twice
AliPivot Points is a Meta Trader 5 Indicator that draws you the latest pivot points. You can choose from timeframes ranging from 1 Minute to 1 Month. Calculation methods for pivot points includes: Classic Pivot Points Camarilla Pivot Points Fibonacci Pivot Points Woodie Pivot Points You can personalize the line colors, style, and width to suit your preference. The indicator displays values on the right side of the chart. AliPivot Points values can also be utilized by developers for creating Expe
FREE
Are you tired of drawing trendlines every time you're analyzing charts? Or perhaps you would like more consistency in your technical analysis. Then this is for you. This indicator will draw trend lines automatically when dropped on a chart. How it works Works similar to standard deviation channel found on mt4 and mt5. It has 2 parameters: 1. Starting Bar 2. Number of bars for calculation The   starting bar   is the bar which drawing of the trend lines will begin, while the   number of bars for c
FREE
Renko Chart
Marcin Konieczny
4.27 (11)
This indicator allows to display Renko charts in the indicator window. Renko charts show only price movements that are bigger than the specified box size. It helps to eliminate noise and allows to focus on main trends. Time is not a factor here. Only price movements are taken into account. That's why Renko chart is not synchronized with the main chart it is attached to. Indicator works in two modes: CLOSE - only close prices are taken into account while building the chart HIGH_LOW - only high/
FREE
JCStatistics
Hai Dong Zhang
JCStatistics 简繁数据统计 1.显示账户信息:内容显示 交易员、账号、本金、杠杆、保证金、保证金比例、余额、净值; 日周月开盘余额、持仓收益、日收益、周收益、月收益; 收益为正时显示红色字体,收益为负时显示绿色字体; 日收益低于-5%时显示CircuitBreak; 总收益低于-10%时显示MarginCall; 2.显示统计数据: 收益(收益率)(交易量)(胜率) 5日数据;4周数据;12月数据; 3.当前标的统计:Symbol()收益(交易量)(胜率) 4.主流标的统计:收益(交易量)(胜率) 可以选择性显示账户信息、数据信息,调整显示颜色,调整字体,调整字体大小。 指标删除后自动删除桌面文字及背景。 备注:如遇使用问题,请联系邮箱:16692618587@qq.com.
FREE
BTFX Pivot Points
Bradley Thomas Farrington
The BTFX Pivot Points is an indicator which calculates the Support and Resistance levels for each day. By using this indicator the pivot levels point out clear targets to aim for. The resistance levels are shown in purple above the silver pivot line. The support levels are shown in Orange and can be found below the silver pivot line. This indicators works very well when used with The BTFX Daybreak Indicator. For a more in depth explanation of these indicators please watch the Youtube video attac
MT5 Swing High Low Indicator
Muhammad Shamsuddeen Muhammad
This indicator plots any and every swing high or swing low on your chart. A swing high or low candle formation comprises of a minimum of 3 candles whereby the middle candles high/low is the highest or lowest point amongst the three candles. The direction (bullish/bearish) of the middle candle is irrelevant. Swings are very useful patterns that can be used to determine market structure as well as potential price reversal points on a chart. This indicator is derived from the Bill Williams Frac
Basic Renko MT5
Mehran Sepah Mansoor
L'indicatore Renko di base mostra le caselle Renko sul grafico principale. Versione MT4 Il suo vantaggio è che hai accesso contemporaneamente sia al grafico principale che al grafico Renko. Inoltre, puoi scoprire quante barre sono necessarie per formare ciascuna scatola Renko. Quando si verifica un'inversione, l'indicatore ti avviserà con avvisi pop-up, push ed e-mail. Questo indicatore non ha impostazioni complicate e principianti e professionisti possono utilizzarlo facilmente nelle l
FREE
Cybertrade Double Bollinger Bands - MT5  The Bollinger Bands indicator shows the levels of different highs and lows that a security price has reached in a given duration and also their relative strength, where the highs are close to the upper line and the lows are close to the lower line. Our differential is to present this indicator in a double form, with the availability of its values ​​to simplify automation. It works on periods longer than the period visible on the chart. All values ​​are
FREE
Automatic Trendlines
Pasi Hakamaki
4.63 (49)
The indicator draws trendlines on chart. This indicator has six inputs. User can specify alternative labels for both lines. If multiple instances of the indicator are used, the labels must differ. User can set width and color of the lines and depth which specifies what significant peaks should be used. For example, Depth=10 sets trendlines using the current peaks and valleys that have at least 10 bars to the right and to the left and that have highs/lows less/greater than the peak's high/low. In
FREE
Candlestick Pattern Teller
Flavio Javier Jarabeck
5 (1)
Minions Labs' Candlestick Pattern Teller It shows on your chart the names of the famous Candlesticks Patterns formations as soon as they are created and confirmed. No repainting. That way beginners and also professional traders who have difficulties in visually identifying candlestick patterns will have their analysis in a much easier format. Did you know that in general there are 3 types of individuals: Visual, Auditory, and Kinesthetic? Don't be ashamed if you cannot easily recognize Candlest
HLC bar MT5 Wyckoff
Eduardo Da Costa Custodio Santos
L'indicatore "HLC_bar_MT5 Wyckoff" per MT5 è stato creato per facilitare l'analisi al momento del trading. La barra HLC è stata utilizzata da Richard Wyckoff ed è attualmente ampiamente utilizzata nelle operazioni "VSA". Wyckoff ha scoperto che l'utilizzo di High, Low e Close ha reso il grafico molto più pulito e più facile da analizzare. L'indicatore "HLC_bar_MT5 Wyckoff" consente: # Cambia la larghezza della barra; # Lascia la barra dello stesso colore; # Ed evidenzia la barra che si è aperta
This is a buyer and seller aggression indicator that analyzes the shape of each candle and project this data in a histogram form. There are 4 histograms in one. On the front we have two: Upper - Buyer force. Lower - Seller force. At the background we also have two histogram, both with same color. They measure the combined strenght of buyers and sellers. This histograms can be turned off in Input Parameters. It is also possible to have the real or tick volume to help on this force measurement. IN
FREE
Wave Box Market Frenquency
Jean Jacques Huve Ribeiro
4.83 (6)
Totally linked to the result of a movement and the duration he had. Its height records how many ticks the asset walked during a given movement, its width shows us the duration that movement had. Its configuration must be in line with the Weis Wave Indicator configuration to observe the movement force and can indicate a possible accumulation or distribution of the movement;
FREE
Donchian Pro
Paulo Henrique Faquineli Garcia
5 (2)
The Donchian Channel Channels are among the most popular tools of technical analysis, as they visually convey to the analyst the limits within which most price movement tends to occur. Channel users know that valuable information can be obtained at any time, whether prices are in the central region of a band or close to one of the border lines. One of the best known techniques to explore these concepts is Bollinger Bands. However, John Bollinger was not the only one to research the applicatio
FREE
A professional tool for trading - the divergence indicator between the WPR and the price, which allows you to receive a signal about a trend reversal in a timely manner or catch price pullback movements (depending on the settings). The indicator settings allow you to adjust the strength of the divergence due to the angle of the WPR peaks and the percentage change in price, which makes it possible to fine-tune the signal strength. The indicator code is optimized and is tested very quickly as par
FREE
WAPV Box Effort x Result
Eduardo Da Costa Custodio Santos
RISULTATO WA_PV_BOX_EFFORT X per MT5 Il WAPV Box Effort x Result Indicator fa parte del gruppo Package Indicators (Wyckoff Academy Wave Market). L'indicatore WAPV Box Effort x Result Indicator per MT5 ti aiuta a leggere il prezzo e il volume. La sua lettura consiste nell'assistere nell'identificazione dello sforzo x risultato in onde create dal grafico. L'indicatore WAPV Box Effort x Result Indicator per MT5 quando la casella è verde significa che il volume è a favore della domanda e quando la c
Renko Plus
Eadvisors Software Inc.
With Renko Plus you can use the features in the Indicator functionality, just add it to the Metatrader5 chart.             The Renko chart is a type of chart, developed by the Japanese, that is constructed using price movement rather than standardized prices and time intervals like most charts. It is believed to be named after the Japanese word for bricks, "renga", as the graphic looks like a series of bricks.             A new brick is created when the price moves a specified p
This indicator is stand alone version from  MP Pivot Levels  (All in one) containing Demark's Pivots. Calculations:     PP = X / 4     R1 = X / 2 - LOWprev     S1 = X / 2 - HIGHprev Uses: When the pair currency price may change the direction of movement. Possible constraints of support and resistance that creates plateaus for the currency pair prices. Tendency identification by comparing the present prices according to current day's pivot point and also the prior day's pivot points. ___________
FREE
AutomaticZigZag
Stanislav Korotky
4.67 (3)
This is a non-parametric ZigZag providing 4 different methods of calculation. Upward edge continues on new bars while their `highs` are above highest `low` among previous bars, downward edge continues on next bars while their `lows` are below lowest `high` among previous; Gann swing: upward edge continues while `highs` and `lows` are higher than on the left adjacent bar, downward edge continues while `highs` and `lows` are lower than on the left adjacent bar. Inside bars (with lower `high` and
FREE
Swiss VWAPsimple
Terence Gronowski
5 (4)
Swiss VWAPsimple Motivation Did not find free VWAP that works, the one that I found craseh. So I created a VWAP which calculates values only for the actual day. So computer resouces are not over stressed. What is VWAP, how is it used?  VWAP stands for Volume Weighed Average Price, it calculates the running sum of tick volume and the runnung sum of price times tickvolume. The division of these sums result in a weighed price (Sum P*V/Sum V). The calculation starts normally at midnight. The value
FREE
Pivot Point Supertrend (corresponds to Pivot Point Super Trend indicator from Trading View) Pivot Point Period:    Pivot point defined as highest high and highest low... input 2 = defining highest high and highest low with 2 bars on each side which are lower (for highest high) and are higher (for lowest low calculation) ATR Length  : the  ATR  calculation is based on 10 periods ATR Factor: ATR multiplied by 3
FREE
Free automatic Fibonacci is an indicator that automatically plots a Fibonacci retracement based on the number of bars you select on the BarsToScan setting in the indicator. The Fibonacci is automatically updated in real time as new highest and lowest values appears amongst the selected bars. You can select which level values to be displayed in the indicator settings. You can also select the color of the levels thus enabling the trader to be able to attach the indicator several times with differe
FREE
Vwap Bar
Jean Jacques Huve Ribeiro
VWAP BAR  It´s power full indicator of candle by candle when lined up   with greate analysis, you have great opportunity, finder defense candle. Is a good ideia from order flow method, now your meta trader 5   inside you time frame chart .   What is the Volume Weighted Average Price (VWAP)? The volume weighted average price (VWAP) is a trading benchmark used by traders that gives the average price a security has traded at throughout the day, based on both volume and price. It is important
FREE
目前全额购买折扣中  !   任何交易者的最佳伙伴! 该指标具有独有的支撑阻力计算方案, 是独一无二的交易系统  。 指标特性 想象一下,如果您能提前精确的判断出重要的交易支撑阻力区域以及点位, 您的交易将如何改善?基于独特的计算方式,我们可以看到波段走势中清晰的支撑和阻力。将过去重要的支撑阻力区域经过独特的计算,将关键位置在图表中显示. 本指标支持周期设置,可以设置其他周期.   大周期重要支撑阻力,以及小周期辅助判断可以在同一图表中完成. 基本显示 显示支撑阻力的价格标签。 显示实时的支撑和阻力。 显示历史的支撑和阻力.   基本设置 设置支撑阻力计算的周期 。 警报设置 接近报警 碰触报警 报警弹窗 报警邮件发送 发送推送警报 颜色设定 可以设置不用的实时支撑阻力颜色 可以设置不用的历史支撑阻力颜色 可以设置价格标签颜色 可以点击价格标签或者点击显示区域改变区域填充方式 任何问题,相互交流
This indicator allows you to measure retracements of price between any two points in either direction. It displays the price points, percentages and also displays the extension levels. User may Modify and Add addition levels and extensions." User may also Add multiple Fibonacci indicators on the chart and change their colors, style and sizes. Can be used on any timeframe. This is the only Fibonacci Tool you'll need to measure and trade on Structure. MT4 Version Available as well. ADDI
FREE
Il Catturatore di Tendenza: La Strategia del Catturatore di Tendenza con Indicatore di Allarme è uno strumento versatile di analisi tecnica che aiuta i trader a identificare le tendenze di mercato e i potenziali punti di ingresso e uscita. Presenta una Strategia dinamica del Catturatore di Tendenza, adattandosi alle condizioni di mercato per una chiara rappresentazione visiva della direzione della tendenza. I trader possono personalizzare i parametri in base alle loro preferenze e tolleranza
FREE
Auto Fibonacci
Ali Gokay Duman
5 (1)
This indicator calculates fibonacci levels via moving averages trend and draw these lines. You can change fast and slow Moving Averages settings for customization. Inputs: Fast MA Time Period :  64 Fast MA Shift: 0 Fast MA Method: Smoothed Fast MA Apply To: Median Price Slow MA Time Period: 32 Slow MA Shift: 0 Slow MA Method: Smoothed Slow MA Apply To: Median Price ZigZag: False ZigZag Color: Red ZigZag Type: DashDot ZigZag Width: VeryThin Fibo Settings TrendFibonacci: True FiboTrendColor: Blac
FREE
Volume Zone Fractal
Eduardo Da Costa Custodio Santos
VZO Plus è un indicatore che mostra le regioni di ipercomprato e ipervenduto in base al volume scambiato. #Quando la linea dell'indicatore è compresa tra -40 e -60 è ipervenduta #Quando la linea dell'indicatore è tra 40 e 60 è ipercomprato. Al di fuori di queste regioni, il mercato segue per inerzia il suo percorso naturale. Sopra la linea verde, significa che il mercato è positivo, Un altro modo per analizzare l'indicatore è attraverso le regioni di divergenza. Quando abbiamo il minimo più alto
ADR ST Patterns Strategy
Vladimir Poltoratskiy
4.5 (4)
ADR ST Patterns Strategy  is a modification of the classical  ADR  indicator. This simple indicator corresponds to the parameters specified in the  ST Patterns Strategy ( https://stpatterns.com/ ) .  Structural Target Patterns represents the market consistently divided into components. No trend lines, geometric proportions of the model itself, trading volume, or open market interest are needed for the formation of  ST Patterns . They are easily recognized and built only on the basis of breaking
FREE
Gli utenti di questo prodotto hanno anche acquistato
Innanzitutto è importante sottolineare che questo sistema di trading è un indicatore Non-Repainting, Non-Redrawing e Non-Lagging, il che lo rende ideale sia per il trading manuale che per quello automatico. Il "Sistema di Trading Smart Trend MT5" è una soluzione completa pensata sia per i trader principianti che per quelli esperti. Combina oltre 10 indicatori premium e offre più di 7 robuste strategie di trading, rendendolo una scelta versatile per diverse condizioni di mercato. Strategia di Tre
Atomic Analyst MT5
Issam Kassas
4.82 (11)
Innanzitutto, vale la pena sottolineare che questo indicatore di trading non è repaint, non è ridisegno e non presenta ritardi, il che lo rende ideale sia per il trading manuale che per quello automatico. L'Analista Atomico è un indicatore di azione del prezzo PA che utilizza la forza e il momentum del prezzo per trovare un miglior vantaggio sul mercato. Dotato di filtri avanzati che aiutano a rimuovere rumori e segnali falsi, e aumentare il potenziale di trading. Utilizzando più strati di in
FX Volume MT5
Daniel Stein
4.94 (17)
Ricevi il tuo aggiornamento quotidiano sul mercato con dettagli e schermate tramite il nostro Morning Briefing qui su mql5 e su Telegram ! FX Volume è il PRIMO e UNICO indicatore di volume che fornisce una visione REALE del sentiment del mercato dal punto di vista del broker. Fornisce informazioni straordinarie su come gli operatori di mercato istituzionali, come i broker, sono posizionati sul mercato Forex, molto più velocemente dei rapporti COT. Vedere queste informazioni direttamente sul vo
Quantum Trend Sniper
Bogdan Ion Puscasu
5 (37)
Presentazione       Quantum Trend Sniper Indicator   , l'innovativo indicatore MQL5 che sta trasformando il modo in cui identifichi e scambi le inversioni di tendenza! Sviluppato da un team di trader esperti con un'esperienza di trading di oltre 13 anni,       Indicatore Quantum Trend Sniper       è progettato per spingere il tuo viaggio di trading verso nuove vette con il suo modo innovativo di identificare le inversioni di tendenza con una precisione estremamente elevata. *** Acquista Quant
Trend Screener Pro MT5
STE S.S.COMPANY
4.89 (61)
Indicatore di tendenza, soluzione unica rivoluzionaria per il trading di tendenze e il filtraggio con tutte le importanti funzionalità di tendenza integrate in un unico strumento! È un indicatore multi-timeframe e multi-valuta al 100% non ridipingibile che può essere utilizzato su tutti i simboli/strumenti: forex, materie prime, criptovalute, indici e azioni. Trend Screener è un indicatore di tendenza che segue un indicatore efficiente che fornisce segnali di tendenza a freccia con punti nel gra
Innanzitutto, vale la pena sottolineare che questo Strumento di Trading è un Indicatore Non-Ridipingente, Non-Ridisegnante e Non-Laggante, il che lo rende ideale per il trading professionale. L'Indicatore Smart Price Action Concepts è uno strumento molto potente sia per i nuovi che per i trader esperti. Racchiude più di 20 utili indicatori in uno solo, combinando idee di trading avanzate come l'Analisi del Trader del Circolo Interno e le Strategie di Trading dei Concetti del Denaro Intelligen
Top indicator for MT5   providing accurate signals to enter a trade without repainting! It can be applied to any financial assets:   forex, cryptocurrencies, metals, stocks, indices .  Watch  the video  (6:22) with an example of processing only one signal that paid off the indicator! MT4 version is here It will provide pretty accurate trading signals and tell you when it's best to open a trade and close it. Most traders improve their trading results during the first trading week with the help of
FX Power MT5 NG
Daniel Stein
5 (4)
Ricevi il tuo aggiornamento quotidiano sul mercato con dettagli e schermate tramite il nostro Morning Briefing qui su mql5 e su Telegram ! FX Power MT5 NG è la nuova generazione del nostro popolare misuratore di forza delle valute, FX Power. Cosa offre questo misuratore di forza di nuova generazione? Tutto ciò che avete amato dell'FX Power originale IN PIÙ Analisi della forza di ORO/XAU Risultati di calcolo ancora più precisi Periodi di analisi configurabili individualmente Limite di calcolo pe
RelicusRoad Pro MT5
Relicus LLC
4.82 (22)
Ora $ 147 (aumentando a $ 499 dopo alcuni aggiornamenti) - account illimitati (PC o MAC) Manuale utente di RelicusRoad + Video di formazione + Accesso al gruppo Discord privato + Stato VIP UN NUOVO MODO DI GUARDARE IL MERCATO RelicusRoad è l'indicatore di trading più potente al mondo per forex, futures, criptovalute, azioni e indici, fornendo ai trader tutte le informazioni e gli strumenti di cui hanno bisogno per rimanere redditizi. Forniamo analisi tecniche e piani di trading per aiutar
Auto Order Block with break of structure based on ICT and Smart Money Concepts Futures Break of Structure ( BoS )             Order block ( OB )            Higher time frame Order block / Point of Interest ( POI )    shown on current chart           Fair value Gap ( FVG ) / Imbalance   ,  MTF      ( Multi Time Frame )    Volume Imbalance     ,  MTF          vIMB Gap’s Equal High / Low’s     ,  MTF             EQH / EQL Liquidity               Current Day High / Low           HOD /
XQ Indicator MetaTrader 5
Marzena Maria Szmit
5 (1)
Step into the realm of Forex trading with confidence and precision using XQ, a cutting-edge Forex indicator designed to elevate your trading game to unprecedented heights. Whether you're a seasoned trader or just stepping into the world of currency exchange, XQ Forex Indicator empowers you with the insights and signals needed to make informed trading decisions. The signal conditions are a combination of three indicators, and XQ Forex Indicator only display  medium and long-term trends . The ind
Blahtech Supply Demand MT5
Blahtech Limited
4.57 (14)
Was: $299  Now: $99   Supply Demand uses previous price action to identify potential imbalances between buyers and sellers. The key is to identify the better odds zones, not just the untouched ones. Blahtech Supply Demand indicator delivers functionality previously unavailable on any trading platform. This 4-in-1 indicator not only highlights the higher probability zones using a multi-criteria strength engine, but also combines it with multi-timeframe trend analysis, previously confirmed swings
Advanced Supply Demand MT5
Bernhard Schweigert
4.53 (15)
La migliore soluzione per qualsiasi principiante o trader esperto! Questo indicatore è uno strumento di trading unico, di alta qualità e conveniente perché abbiamo incorporato una serie di funzionalità proprietarie e una nuova formula. Con questo aggiornamento, sarai in grado di mostrare fusi orari doppi. Non solo potrai mostrare una TF più alta, ma anche entrambe, la TF del grafico, PIÙ la TF più alta: SHOWING NESTED ZONES. Tutti i trader di domanda di offerta lo adoreranno. :) Informazioni imp
ICT, SMC, SMART MONEY CONCEPTS, SMART MONEY, Smart Money Concept, Support and Resistance, Trend Analysis, Price Action, Market Structure, Order Blocks, BOS/CHoCH,   Breaker Blocks ,  Momentum Shift,   Supply&Demand Zone/Order Blocks , Strong Imbalance,   HH/LL/HL/LH,    Fair Value Gap, FVG,  Premium  &   Discount   Zones, Fibonacci Retracement, OTE, Buy Side Liquidity, Sell Side Liquidity, BSL/SSL Taken, Equal Highs & Lows, MTF Dashboard, Multiple Time Frame, BigBar, HTF OB, HTF Market Structure
L'indicatore Quadrato di Gann è uno strumento potente di analisi di mercato basato sull'articolo "Formula Matematica per le Previsioni di Mercato" scritto da W.D. Gann. Questo strumento utilizza concetti matematici e teorie di Gann per effettuare un'analisi precisa del mercato. Utilizza i quadrati di 144, 90, 52 e anche il quadrato di 9. Inoltre, integra il metodo del  per il quadrato di 9 e la sua relazione con canali e modelli stellari di quel quadrato. Manuale Utente e Applicazione: Prima di
AW Trend Predictor MT5
AW Trading Software Limited
4.76 (54)
La combinazione di trend e livelli di rottura in un unico sistema. Un algoritmo di indicatore avanzato filtra il rumore del mercato, determina la tendenza, i punti di ingresso e i possibili livelli di uscita. I segnali indicatori sono registrati in un modulo statistico, che permette di selezionare gli strumenti più adatti, mostrando l'efficacia dello storico dei segnali. L'indicatore calcola i segni Take Profit e Stop Loss. Manuale e istruzioni ->   QUI   / versione MT4 ->   QUI Come fare tradi
Il profitto dalla struttura del mercato cambia quando il prezzo si inverte e si ritira. L'indicatore di avviso di inversione della struttura del mercato identifica quando una tendenza o un movimento di prezzo si sta avvicinando all'esaurimento e pronto a invertire. Ti avvisa dei cambiamenti nella struttura del mercato che in genere si verificano quando stanno per verificarsi un'inversione o un forte pullback. L'indicatore identifica inizialmente i breakout e lo slancio del prezzo, ogni volta
Volume by Price MT5
Brian Collard
5 (3)
The Volume by Price Indicator for MetaTrader 5 features Volume Profile and Market Profile TPO (Time Price Opportunity). Get valuable insights out of currencies, equities and commodities data. Gain an edge trading financial markets. Volume and TPO histogram bar and line charts. Volume Footprint charts. TPO letter and block marker charts including split structures. Versatile segmentation and compositing methods. Static, dynamic and flexible ranges with relative and/or absolute visualizations. Lay
Presentazione       Quantum Breakout PRO   , l'innovativo indicatore MQL5 che sta trasformando il modo in cui scambi le zone di breakout! Sviluppato da un team di trader esperti con un'esperienza di trading di oltre 13 anni,       Quantum Breakout PRO       è progettato per spingere il tuo viaggio di trading a nuovi livelli con la sua strategia innovativa e dinamica della zona di breakout. Quantum Breakout Indicator ti fornirà frecce di segnalazione sulle zone di breakout con 5 zone target
TrendLine PRO MT5
Evgenii Aksenov
4.78 (49)
The Trend Line PRO indicator is an independent trading strategy. It shows the trend change, the entry point to the transaction, as well as automatically calculates three levels of Take Profit and Stop Loss protection Trend Line PRO is perfect for all Meta Trader symbols: currencies, metals, cryptocurrencies, stocks and indices Advantages of Trend Line PRO Never redraws its signals The possibility of using it as an independent strategy It has three automatic levels Take Profit and Stop Loss lev
Owl Smart Levels MT5
Sergey Ermolov
4.47 (36)
Versione MT4  |  FAQ L' indicatore Owl Smart Levels è un sistema di trading completo all'interno dell'unico indicatore che include strumenti di analisi di mercato popolari come i frattali avanzati di Bill Williams , Valable ZigZag che costruisce la corretta struttura a onde del mercato, e i livelli di Fibonacci che segnano i livelli esatti di entrata nel mercato e luoghi per prendere profitti. Descrizione dettagliata della strategia Istruzioni per lavorare con l'indicatore Consulente-assistente
Gartley Hunter Multi
Siarhei Vashchylka
5 (5)
Gartley Hunter Multi - An indicator for searching for harmonic patterns simultaneously on dozens of trading instruments and on all classic timeframes: (m1, m5, m15, m30, H1, H4, D1, Wk, Mn). Manual (Be sure to read before purchasing) | Version for MT4 Advantages 1. Patterns: Gartley, Butterfly, Shark, Crab. Bat, Alternate Bat, Deep Crab, Cypher 2. Simultaneous search for patterns on dozens of trading instruments and on all classic timeframes 3. Search for patterns of all possible sizes. Fr
Trend Line Map Pro MT5
STE S.S.COMPANY
4.67 (9)
Trend Line Map indicator is an addons for   Trend Screener Indicator . It's working as a scanner for all signals generated by Trend screener ( Trend Line Signals ) . It's a Trend Line Scanner based on Trend Screener Indicator.  If you don't have Trend Screener Pro Indicator,   the Trend Line Map Pro will not work.     LIMITED TIME OFFER : Trend Line Map Indicator is available for only 50 $ and lifetime. ( Original price 125$ ) By accessing to our MQL5 Blog,  you can find all our premium indica
TrendDecoder Premium MT5
Christophe, Pa Trouillas
5 (1)
Identificare i range e le prossime mosse probabili     |    Ottenere i primi segnali e la forza delle tendenze     |    Ottenere uscite chiare prima dell'inversione     |    Individuare i livelli di Fibo che il prezzo testerà   |  Indicatore non tracciante e non ritardato - ideale per il trading manuale e automatizzato - adatto a tutti gli asset e a tutte le unità temporali 50% di sconto   - per il lancio poi torna a   >>   149 $ Dopo l'acquisto,   contattatemi su questo canale  per le impostazi
MetaBands M5
Vahidreza Heidar Gholami
4.67 (3)
MetaBands uses powerful and unique algorithms to draw channels and detect trends so that it can provide traders with potential points for entering and exiting trades. It’s a channel indicator plus a powerful trend indicator. It includes different types of channels which can be merged to create new channels simply by using the input parameters. MetaBands uses all types of alerts to notify users about market events. Features Supports most of the channel algorithms Powerful trend detection algorith
TPSproTREND PrO MT5
Roman Podpora
5 (5)
TPSpro TRENDPRO  - is a trend indicator that automatically analyzes the market and provides information about the trend and each of its changes, as well as giving signals for entering trades without redrawing! The indicator uses each candle, analyzing them separately. referring to different impulses - up or down impulse. Exact entry points into transactions for currencies, crypto, metals, stocks, indices!  -  Version MT4                  DETAILED DESCRIPTION        /       TRADING SETUPS       
Was: $249  Now: $99   Market Profile defines a number of day types that can help the trader to determine market behaviour. A key feature is the Value Area, representing the range of price action where 70% of trading took place. Understanding the Value Area can give traders valuable insight into market direction and establish the higher odds trade. It is an excellent addition to any system you may be using. Inspired by Jim Dalton’s book “Mind Over Markets”, this indicator is designed to suit the
Disegna automaticamente i livelli di supporto e resistenza PIÙ i gap delle candele di propulsione sul vostro grafico, in modo da poter vedere dove il prezzo potrebbe dirigersi successivamente e/o potenzialmente invertire. Questo indicatore è stato progettato per essere utilizzato come parte della metodologia di trading di posizione insegnata sul mio sito web (The Market Structure Trader) e visualizza informazioni chiave per il targeting e le potenziali entrate. MT4 Version:  https://www.mql5.
Golden Spikes Detector
Batsirayi L Marango
5 (1)
Golden Spikes Detector This indicator is based on an advanced strategy primarily for trading spikes on Boom and Crash Indices. Complex algorithms were implemented to detect high probability entries only. It alerts on potential Buy and Sell entries. To trade spikes on the Deriv or Binary broker, only take Buy Boom and Sell Cash alerts. It was optimised to be loaded on 5-minute timeframe although multiple timeframe analysis is done in the background. Features ·             Desktop pop up and sound
IX Power MT5
Daniel Stein
5 (2)
IX Power   porta finalmente l'imbattibile precisione di FX Power ai simboli non-Forex. Determina con precisione l'intensità delle tendenze a breve, medio e lungo termine dei vostri indici preferiti, azioni, materie prime, ETF e persino criptovalute. Potete   analizzare tutto ciò che   il vostro terminale ha da offrire. Provatelo e sperimentate come   il vostro tempismo migliori significativamente   durante il trading. Caratteristiche principali di IX Power Risultati di calcolo precisi al
Altri dall’autore
La strategia di trading di tendenza "Super Trend flessibile Alert EA" si basa sull'indicatore con lo stesso nome "Super Trend flessibile Alert". L'advisor utilizza tutte le informazioni dell'indicatore, quindi l'advisor ha solo tre parametri, questi sono: “Tempo di lavoro” – specifica il periodo di tempo di lavoro, il periodo di tempo in cui viene creato l’indicatore e anche da cui vengono presi i dati “OHLC”. "Stop Loss" è la dimensione costante dello stop loss, misurata in "punti" (puoi veder
Descrizione: L'indicatore "Struttura del mercato HH HL LH LL" è uno strumento potente e allo stesso tempo semplice per analizzare la dinamica dei prezzi nei mercati finanziari. Questo indicatore aiuta i trader e gli investitori a identificare i cambiamenti nelle tendenze e a identificare i punti importanti nelle serie temporali dei prezzi. Componenti chiave dell’indicatore: HH (Higher High): il massimo al quale il prezzo chiude sopra il massimo precedente. HH indica un rafforzamento del t
L'indicatore di tendenza "   Avviso flessibile Super Trend   " ha un minimo di impostazioni. Questo indicatore è progettato per essere il più facile possibile da usare. L'indicatore mostra il trend con una linea principale colorata (linea "SuperTrend", che puoi vedere nella finestra "Finestre dati"). Inoltre, nei punti in cui il trend cambia, l'indicatore mostra delle frecce colorate (   icone "STBuy" e "   STSell", che puoi vedere nella finestra "Finestre dati"       ). Nei punti in cui la tend
L’indicatore mostra una divergenza rialzista e ribassista. L'indicatore stesso (come il normale stocastico) viene visualizzato in una sottofinestra. Interfaccia grafica   : Nella finestra principale vengono creati oggetti grafici "linea di tendenza" - prodotti dal prezzo "Basso" al prezzo "Basso" (per divergenza rialzista) e prodotti dal prezzo "Alto" al prezzo "Alto" (per divergenza ribassista) ). L'indicatore disegna nella sua finestra utilizzando esclusivamente buffer grafici: “Main”, “Signa
L'indicatore 'Supertrend MetaTrader 5' è la base del più semplice sistema di trend trading. Eppure rimane molto efficace. L'indicatore funziona su qualsiasi periodo di tempo (sul periodo di tempo del grafico corrente). Dal nome puoi vedere che questo indicatore segue la tendenza e quando la tendenza cambia, l'indicatore mostra accuratamente il punto del cambiamento di tendenza. La base di "Supertrend MetaTrader 5" è il confronto dei valori del prezzo e dell'indicatore "Average True Range" molti
The Candle Length Indicator Alarm generates a sound alert, sends a push notification and an email when the size of the current candlestick changes. The size of the current candlestick can be measured in two ways: The first method: the size of the candlestick is measured from the beginning of the candlestick (from the OPEN price). The second method: the size of the candlestick is measured from current price. The indicator has the following settings: sound — a sound file from the folder: "...\Meta
The Buy Sell Color Background indicator changes the background color depending on position direction. It has three settings: Background color for BUY - background color for a Buy position Background color for SELL - background color for a Sell position Default background color - background color with no open position After you detach the indicator from a chart, its background color changes to Default background color .
The calculator of signals operates directly from the MetaTrader 5 terminal, which is a serious advantage, since the terminal provides a preliminary selection and sorts out signals. This way, users can see in the terminal only the signals that ensure a maximum compatibility with their trading accounts. The calculator of signals gives the answer to the one of the questions most frequently asked by users of the Signals service: "Will I be able to subscribe to the signal NNN, and what volume of the
Arrow Signal
Vladimir Karputov
Questo indicatore appartiene alla categoria "Stocastico". Ho cercato di semplificare il più possibile il controllo dell'indicatore, quindi le impostazioni minime sono mostrate nei parametri di input: questa è la scelta di un'icona per le frecce di segnale. Il segnale "Acquista" è codificato con il   parametro "Codice freccia Acquista   " e il segnale "Vendi" è codificato con il parametro "   Codice freccia Vendi".   I codici freccia del segnale per i segnali (si prega di utilizzare i valori da 3
Arrow Signal EA
Vladimir Karputov
An Expert Advisor based on the custom indicator. Search for a signal at every tick. Positions are closed by an opposite signal. No trailing. There is no stop loss. There is no take profit. Has a minimum of settings Money management: Lot OR Risk   - type Money management The value for "Money management"   - Money management value Deviation   - admissible slippage Buy Arrow code   (font Wingdings) - character code from 'Wingdings' font for BUY signals Sell Arrow code   (font Wingdings) - characte
Ma Dema Alert
Vladimir Karputov
L'indicatore visualizza tre linee e monitora due tipi di intersezioni. Tre linee dell'indicatore: "   MA   " - indicatore lento "Media mobile", "   DEMA Slow   " - indicatore lento "   Double Exponential Moving Average" e "   DEMA Fast   " - indicatore veloce "Double Exponential Moving Average". Due tipi di intersezioni       : "   Alert Price MA   " - il prezzo attraversa la   linea "MA" e   "   Alert DEMA DEMA   " - le linee si incrociano       "DEMA lento" e   "DEMA veloce   ". Durante l'attr
Questo Expert Advisor appartiene alla classe delle utilità per il trading manuale e semiautomatico. L'"   ordine in sospeso agli estremi del giorno   " EA colloca due ordini in sospeso agli estremi del giorno precedente. Parametro "   Ordini in sospeso: ...       " permette di selezionare il tipo di ordini pendenti: "   Buy Stop e Sell Stop   " o "   Buy Limit e Sell Limit   "   .       estremo       L'offset "Basso" viene eseguito verso il basso). "   Nuovi pendenti -> cancella precedenti   " i
Il pannello di utilità "Panel Partial Closure" è destinato alla rapida chiusura parziale di una posizione che ha un profitto. Ha solo due parametri: "   Chiusura parziale #1   " e "   Chiusura parziale #2   ". Funziona per qualsiasi simbolo e per qualsiasi "numero magico", ovvero l'utilità è destinata principalmente al trading manuale. Come funziona: Ad esempio, hai diverse posizioni su "EURUSD", "Jump 100 Index" e "XAUUSD" (oro). L'utility trova la posizione con il maggior profitto - nello scre
Indicatore MQL5 "Resistenza e supporto giornalieri": disegna linee di supporto e resistenza giornaliere. Il disegno viene eseguito solo con l'ausilio di oggetti grafici (linee di tendenza) - i buffer indicatori non vengono utilizzati in questo indicatore. L'indicatore non ha impostazioni - la ricerca dei livelli viene effettuata sulle ultime 500 barre dall'intervallo di tempo "D1" e questo parametro è cablato all'interno del codice. Trading manuale: Quando si fa trading manualmente, si consigli
L'utility "   Multi Symbol Trailing   " sposta lo Stop Loss per tutte le posizioni attualmente aperte (multi-symbol trailing). È destinato principalmente ad assistere nel trading manuale. Non ci sono restrizioni per l'utilità né per il nome della coppia di valute né per l'identificatore individuale (numero magico): l'utilità elabora assolutamente tutte le posizioni attualmente aperte. L'unità di misura dei parametri "   Trailing Stop   " e "   Trailing Step   " è il punto (la differenza tra il p
L'indicatore di tendenza "Trend Two Moving Average" utilizza due tipi di freccia per visualizzare i risultati del calcolo: "Trend UP" e "Trend DN".       Frecce "Trend Up"       sono disegnate       Di       prezzo       'Basso'       barra   ,       UN       Frecce "Trend DN" -       Di       prezzo       'alto'. L'algoritmo di ricerca dei trend si basa sull'analisi del prezzo di una barra e dei valori di due indicatori di 'Media Mobile'. La direzione del trend è calcolata sulla barra corrente
Three TimeFrames
Vladimir Karputov
Pannello indicatore a tre TimeFrames. L'indicatore è realizzato sotto forma di un pannello basato sulla classe CAppDialog. Il pannello può essere ridotto a icona o spostato all'interno del grafico corrente utilizzando il mouse. L'indicatore mostra tre tempi del simbolo corrente nel pannello. Nella versione attuale, l'indicatore ha un numero minimo di impostazioni: questi sono i parametri di tre periodi di tempo: "Frame di tempo più giovane", "   Frame di tempo   medio   " e "   Frame di tempo  
L'indicatore "   Market Session Times   " mostra il tempo di quattro sessioni di negoziazione: Asia, Europa, America e Pacifico. L'orario delle sessioni di negoziazione è impostato   nel formato       GMT e quindi non dipende affatto dal server di trading. Vengono utilizzati i seguenti dati: Sessione di negoziazione Città GMT Asia Tokio Singapore Shangai 00:00-06:00 01:00-09:00 01:30-07:00 Europa Londra Francoforte 07:00-15:30 07:00-15:30 America New York Chicago 13:30-20:00 13:30-
Constant stream
Vladimir Karputov
Sistema di trading per una varietà di transazioni commerciali. Consente di impostare il saldo in modo che oscilli intorno allo zero, utilizzato per attività di sconto specifiche o simili. Configurato per funzionare con   conti di copertura.   Non può esserci più di una posizione nel mercato   . Un'impostazione generale, il parametro "   Step, Stop Loss, Take Profit   " viene misurato in punti (esempio per EURUSD: 1.00055-1.00045 = 10 punti). L'advisor interrompe il trading (rimanendo sul grafico
L'indicatore mostra i frattali dal periodo di tempo più elevato. È possibile visualizzare due tipi di frattali: 'Frattale regolare' e 'Frattale BW'. Consideriamo la formazione del frattale 'SU'. Il "frattale regolare" è un frattale molto rigoroso in cui ogni successivo prezzo "alto" (a sinistra e a destra della barra centrale) è più piccolo. Mentre in 'BW Fractal' c'è una sola condizione: la barra centrale (il suo prezzo 'alto') deve essere la più alta. Visivamente, la differenza tra queste due
Resistenza al supporto dell'IA Questo è un indicatore che cerca le linee “Supporto” e “Resistenza”. La ricerca viene effettuata utilizzando un algoritmo per l'analisi numerica e l'elaborazione dei dati. Sono disponibili tre opzioni di ricerca (“modalità n. 1”, “modalità n. 2” e “modalità n. 3”). Ognuna di queste opzioni differisce nel suo algoritmo interno (al momento si tratta di impostazioni completamente interne, non sono disponibili per l'utente). Possiamo dire che queste opzioni differiscon
Open Time Manager
Vladimir Karputov
L'utilità "   Open Time Manager   " apre una posizione a un'ora specificata e quindi attiva il trailing classico. L'ora ("   Ora   ":"   Minuti   ") è sempre impostata nel fuso orario GMT con un offset GMT Offset. E' possibile selezionare tre opzioni per l'apertura di una posizione utilizzando il parametro '   Modalità Trade   ': '   ACQUISTARE   ' '   VENDERE   ' '   ACQUISTA e VENDI (contemporaneamente)   ' '   OFF (no scambi, solo lavori finali)   ' Il quarto parametro viene utilizzato quand
Il dashboard scansiona le letture di due indicatori: "MACD" e "Stocastico". Visualizza i segnali in tre colonne: per MACD, per Stocastico e la colonna risultante (se il segnale è lo stesso per entrambi gli indicatori). La scansione può essere selezionata su uno o più intervalli temporali. Se disabiliti tutti gli intervalli di tempo, la dashboard verrà comunque caricata, ma con impostazioni specifiche per questi casi. I segnali vengono sempre controllati per la barra zero (la barra zero è la barr
ATR Bands Alert
Vladimir Karputov
ATR Bands Alert è un indicatore di canale in cui la larghezza del canale viene calcolata come un moltiplicatore costante ("Moltiplicatore") e il valore dell'indicatore "Average True Range". A differenza delle bande di Bollinger, la larghezza di banda non viene modificata così spesso: nell'indicatore ATR Bands Alert, le bande spesso hanno lunghe linee rette. L'interpretazione dell'ATR Bands Alert si basa sul fatto che il prezzo si trova all'interno delle bande per la maggior parte del tempo e,
Filtro:
Nessuna recensione
Rispondi alla recensione
Versione 1.10 2024.03.01
1.10. Acceleration of the launch of the indicator