Gartley Guard Harmonics mt5
- Indicatori
- Ely Alsedy
- Versione: 1.0
- Attivazioni: 5
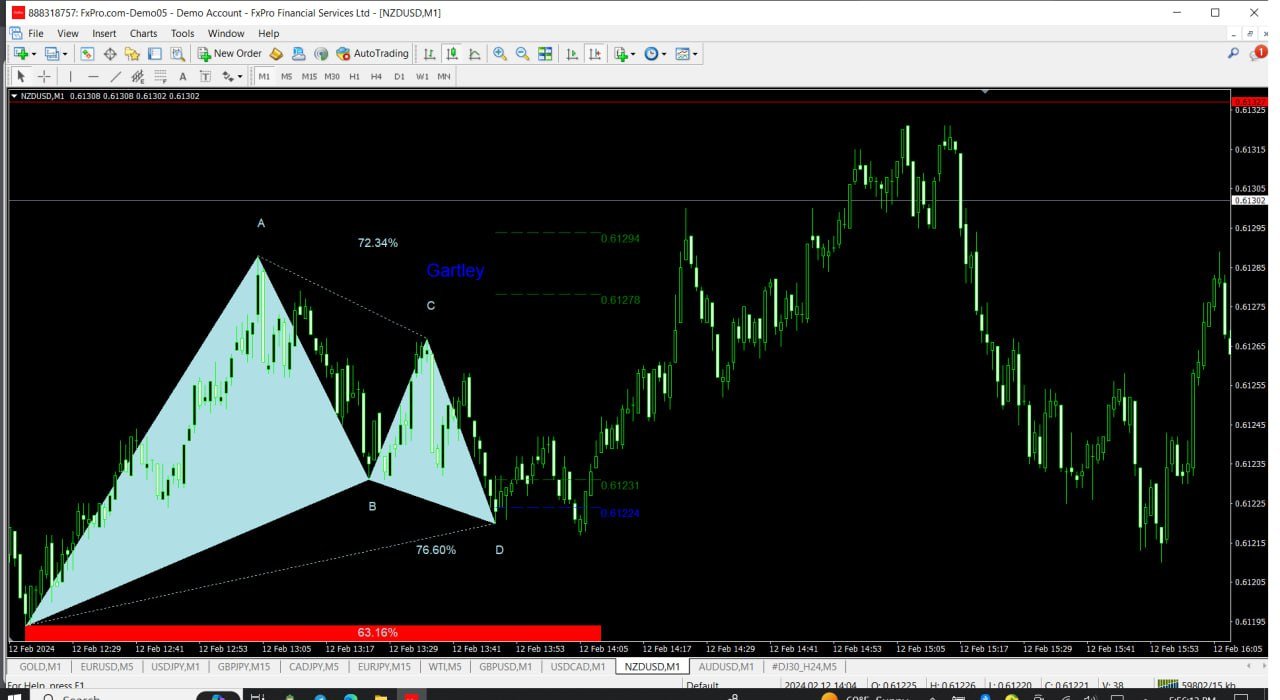
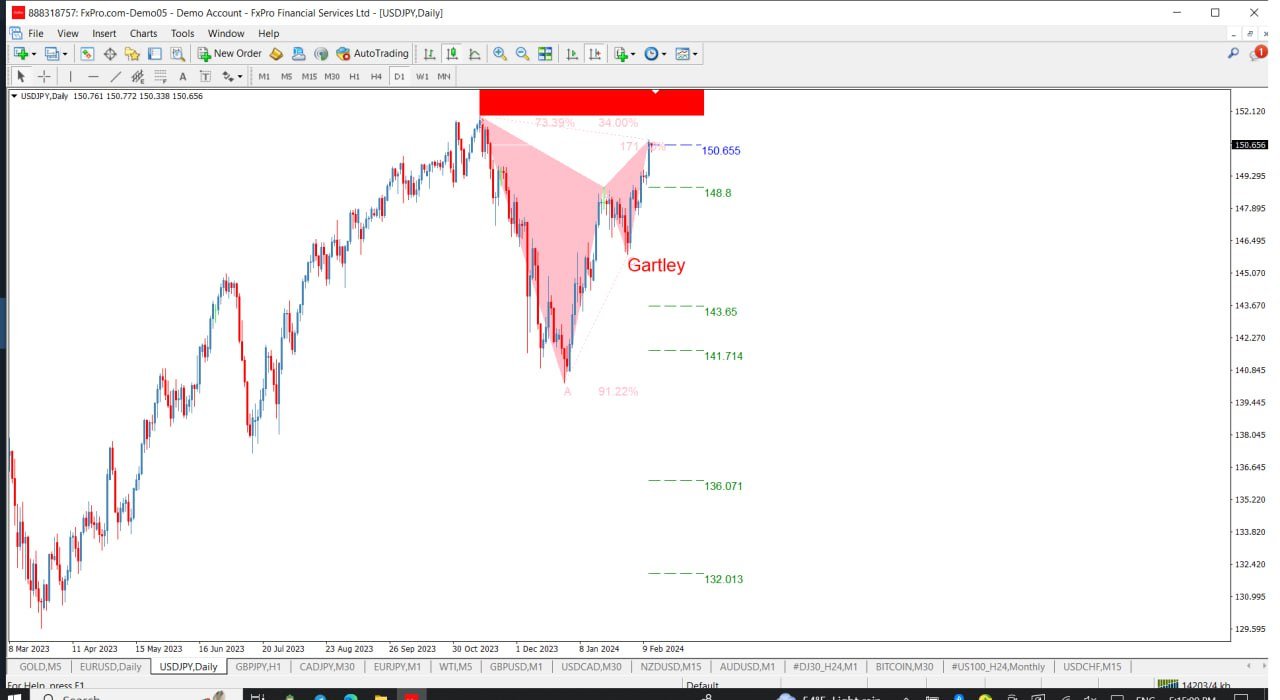
I pattern armonici sono ideali per prevedere i punti di inversione del mercato. Offrono un'elevata percentuale di successo e numerose opportunità di trading in un singolo giorno. Il nostro indicatore identifica i pattern armonici più popolari basandosi sui principi della letteratura sul trading armonico.
NOTE IMPORTANTI:
- L'indicatore non ridisegna, non è in ritardo (rileva un pattern nel punto D) e non ridisegna (il pattern è valido o annullato).
COME UTILIZZARE:
- Trascina e rilascia l'indicatore sul tuo grafico MT5.
- Imposta il rilevamento dei pattern su TRUE (ABCD; Gartley).
- Regola la deviazione a tuo piacimento (deviazione elevata per più pattern, deviazione bassa per meno pattern).
- Personalizza i colori secondo le tue preferenze.
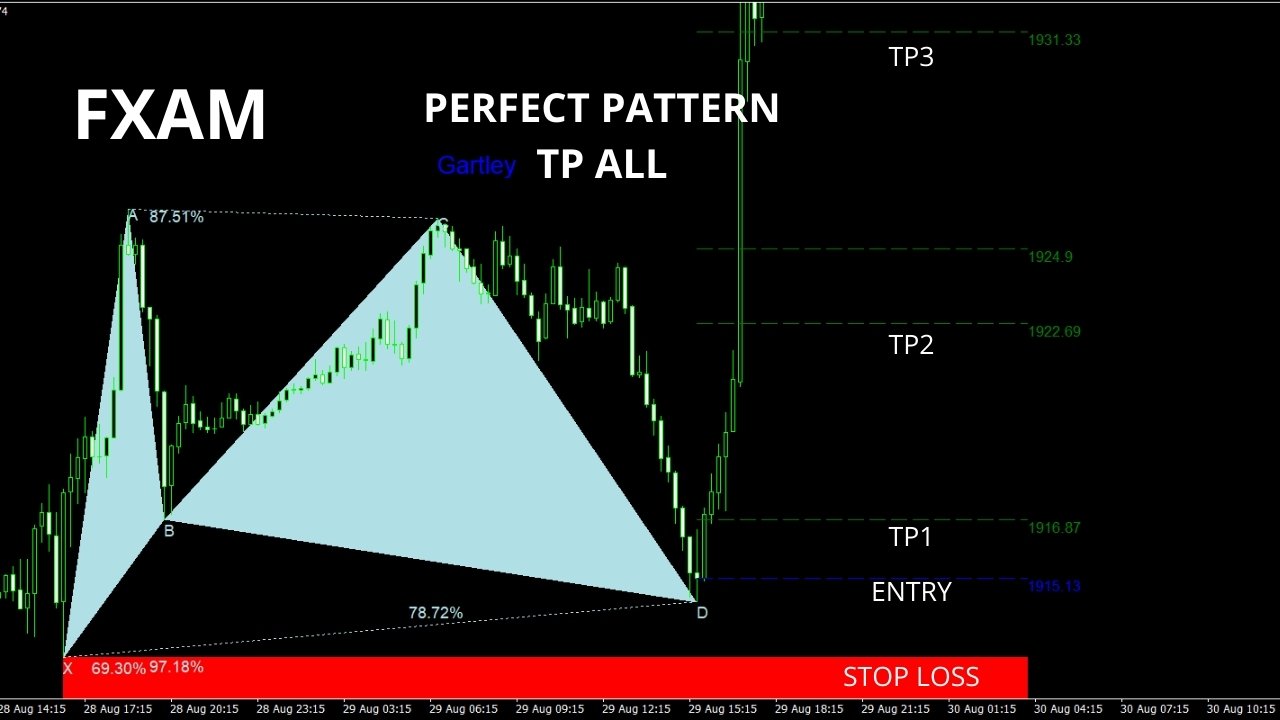
- Abilita o disabilita gli avvisi per ENTRY POINT, TP e SL a tua discrezione.
QUANDO VIENE RILEVATO UN PATTERN:
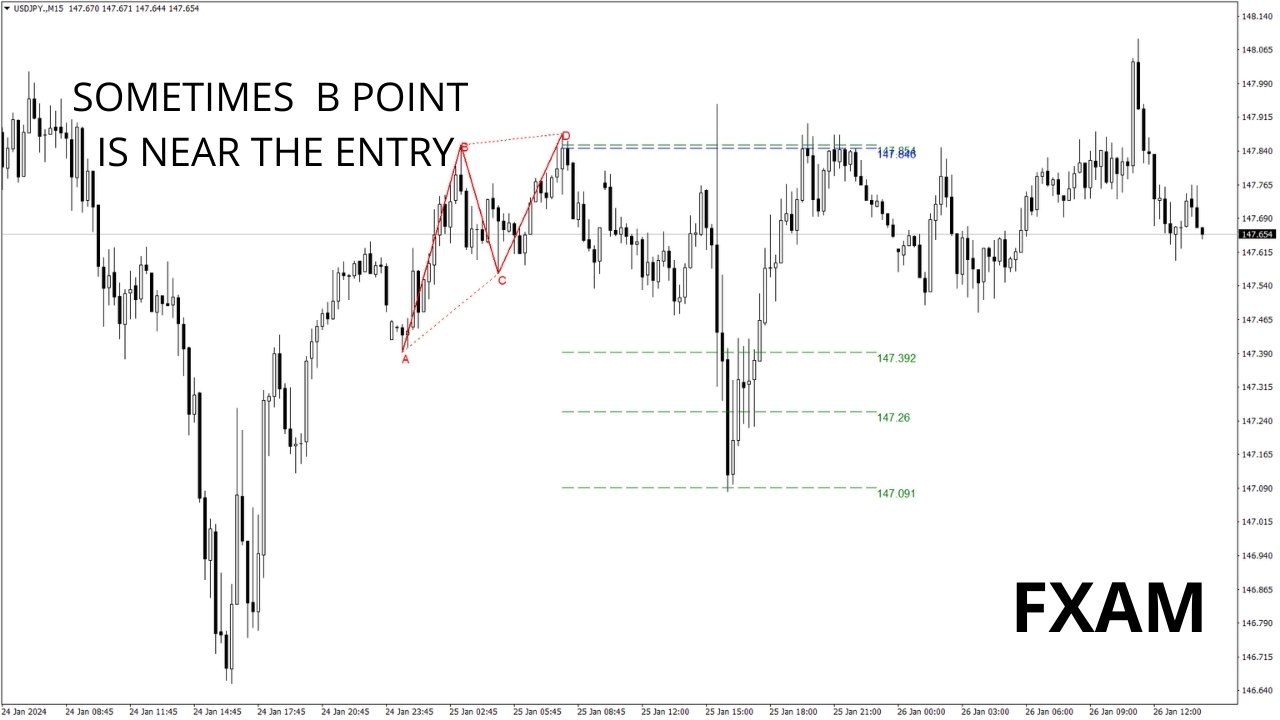
- L'algoritmo rileva un pattern nel punto D.
- Se gli avvisi sono attivati, verrai avvisato del rilevamento del pattern.
- Se un pattern viene invalidato, viene attivato un avviso con il messaggio "PATTERN ANNULLATO".
- I pattern di successo attivano un ALERT DI INGRESSO al termine della candela.
- Vengono inviati avvisi quando si raggiungono TP1, TP2, TP3, TP4 o SL.
Il prezzo attuale è di $40 e sono disponibili solo poche copie. Il prezzo finale sarà di $70.
PIANO DI SVILUPPO:
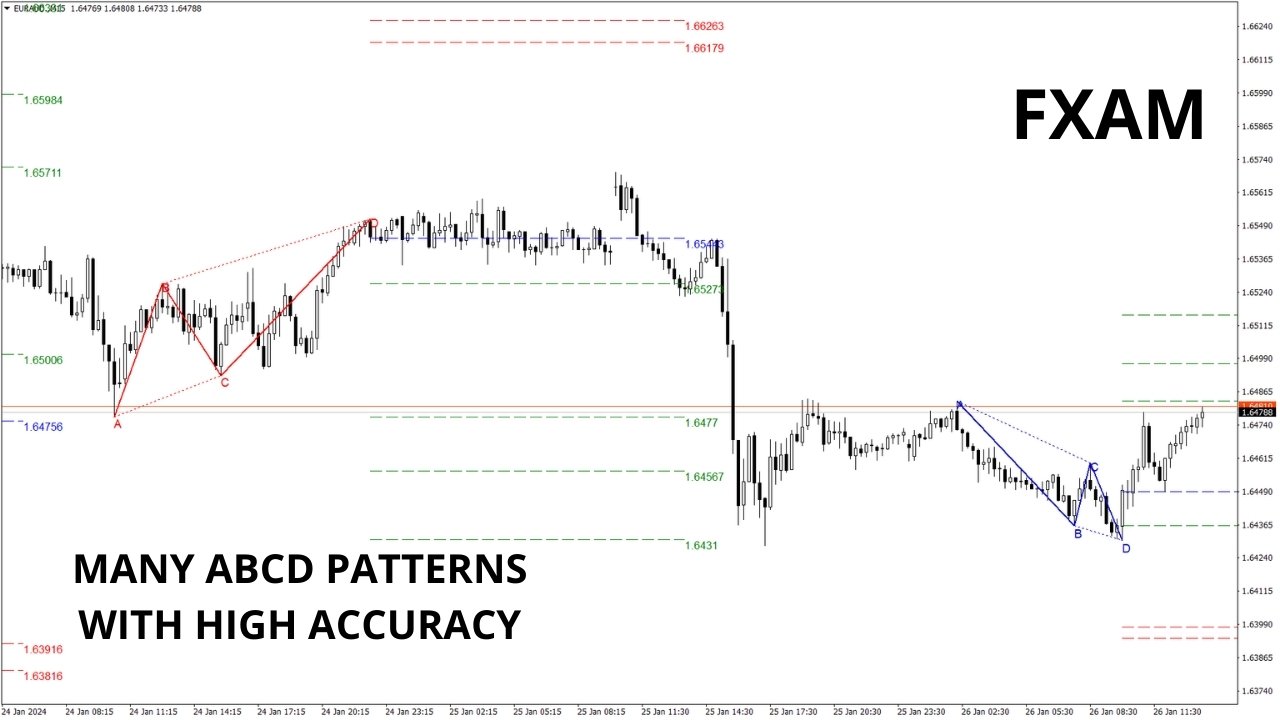
- La versione attuale (1.1) di questo indicatore rileverà i pattern Gartley e ABCD.
- La versione 1.1 includerà i pattern Butterfly, Bat e Crab.
- Le versioni future includeranno pattern aggiuntivi, rilevamento potenziale PRZ e avvisi per ogni evento del pattern (apparizione, completamento, ingresso, SL/TP).
- La versione 1.4 introdurrà uno scanner per individuare pattern su tutte le coppie di valute e time frame, aggiornato a intervalli regolari.
- La versione 1.5 includerà un DASHBOARD sotto la finestra del grafico per monitorare i pattern.
Acquistando questo indicatore, contribuirai al suo sviluppo completo.
Principali caratteristiche:
- Interfaccia semplice da usare e user-friendly.
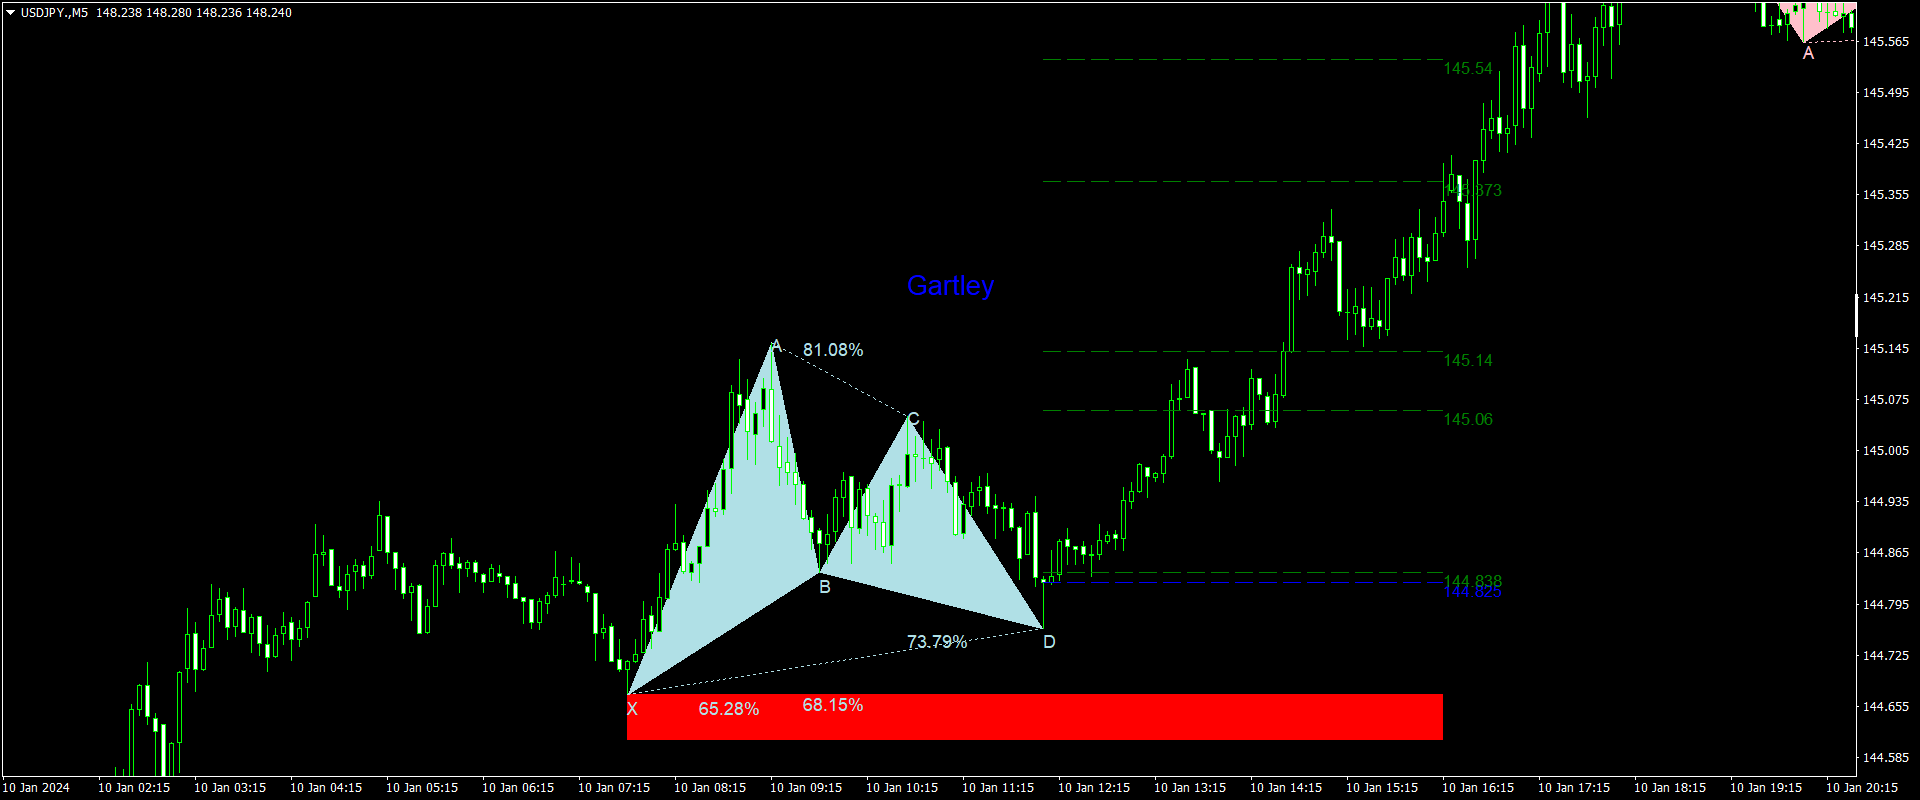
- Utilizza i livelli di Fibonacci per il rilevamento dei pattern.
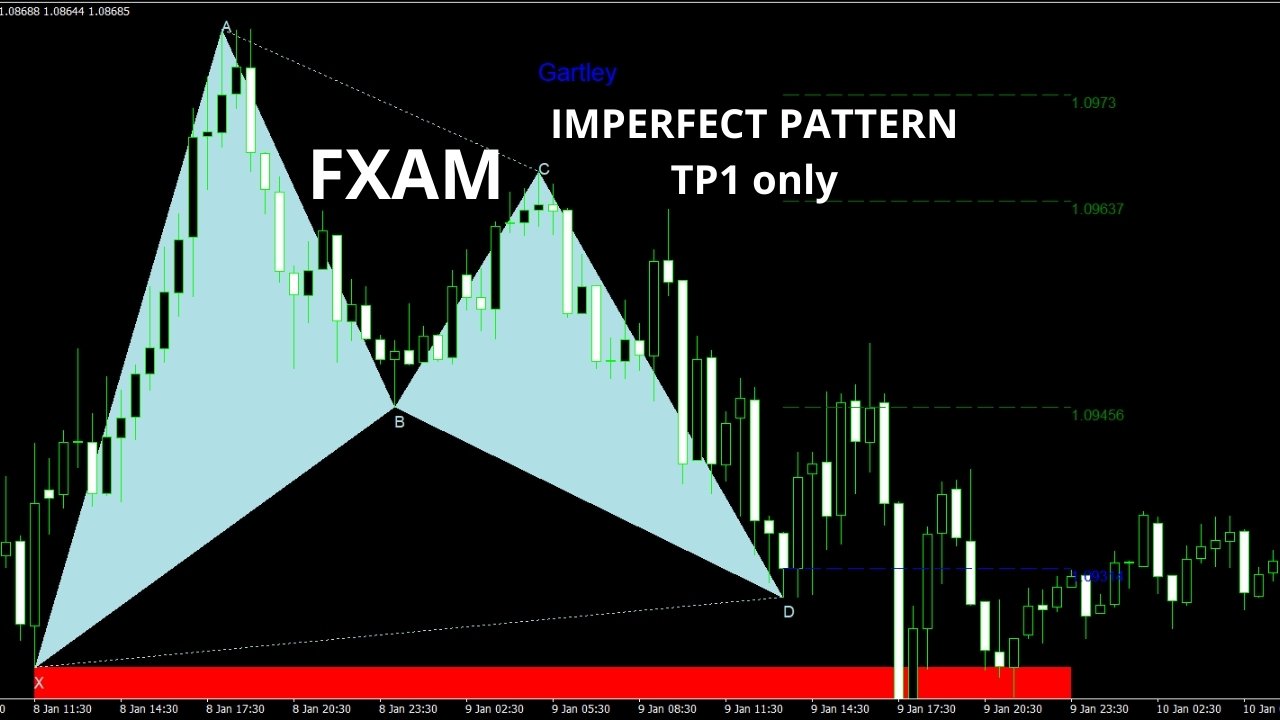
- Identifica pattern perfetti che possono arrivare fino all'ultimo TP e pattern imperfetti che raggiungono almeno TP1.
PARAMETRI DI INPUT:
- Le impostazioni generali includono Profondità, Modalità di rilevamento, Utilizzo della cronologia, Mostra rapporti, Mostra etichette dei punti e Distanza dei punti dal pattern.
- Le impostazioni Gartley consentono la personalizzazione dei colori rialzisti e ribassisti, percentuale di deviazione e opzioni di visualizzazione.
- Le impostazioni ABCD includono percentuale di deviazione e personalizzazione del colore.
L'utente non ha lasciato alcun commento sulla valutazione.