• Panoramica
  • Recensioni
  • Commenti

CapitalSupportResistance

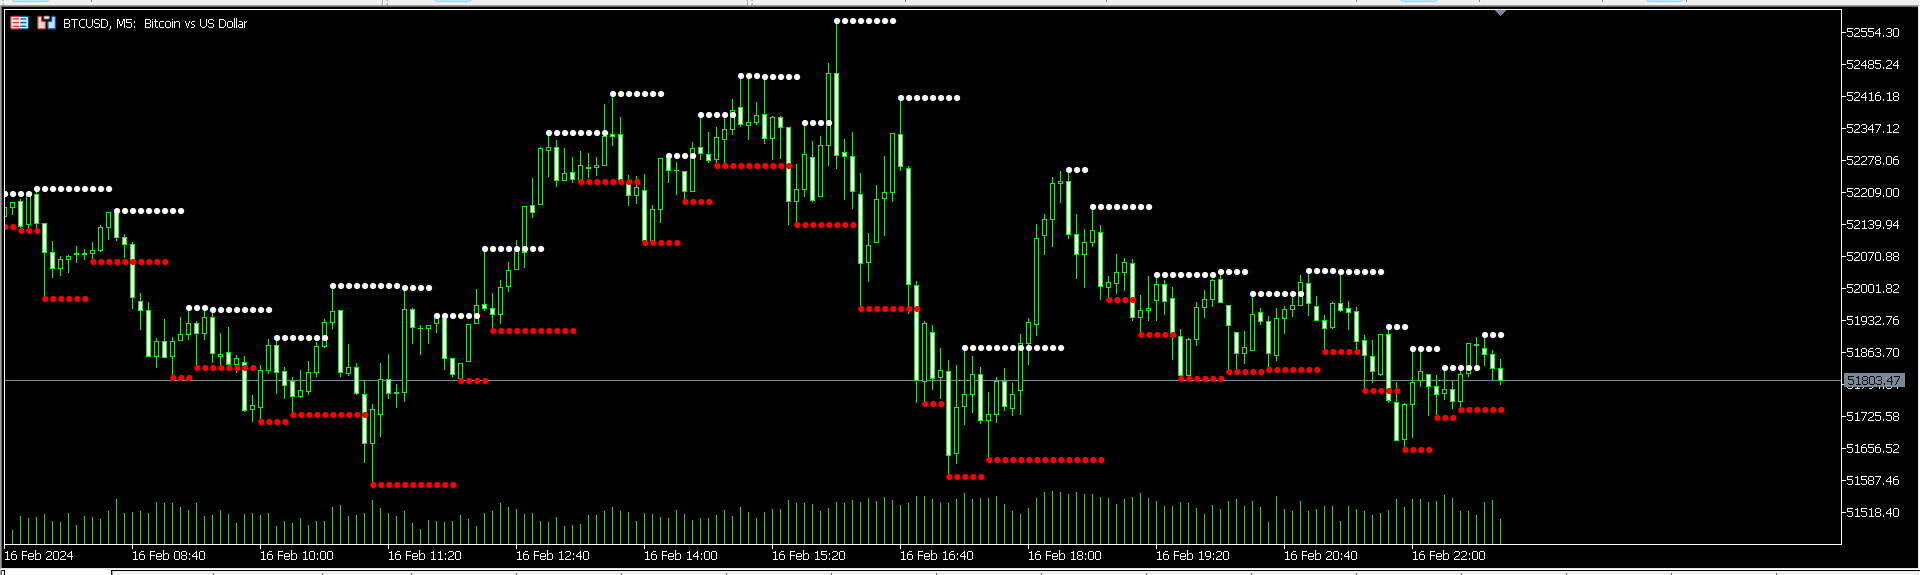
"Support and Resistance" is a fundamental concept in technical analysis for trading stocks, currencies, or other assets in financial markets. Here's how to use it:

Identifying Support

  1. Support is a price level where buying is strong. When the price drops to this level, there tends to be significant buying activity, preventing the price from falling further.
  2. Identifing Support: Look for the lowest points in a given period and find levels where the price has bounced back up multiple times.
  3. Usage: Support levels can be used as buying points or to set stop-loss orders.

Identifying Resistance

  1. Resistance is a price level where selling pressure is strong. When the price rises to this level, there tends to be significant selling activity, preventing the price from rising further.
  2. Identifying Resistance: Look for the highest points in a given period and find levels where the price has been pushed down multiple times.
  3. Usage: Resistance levels can be used as selling points or to set stop-loss orders.

Tips for Usage

  • Confirming Support/Resistance: Wait for confirmation signals before buying or selling, such as a close above resistance or below support.
  • Role Reversal: Sometimes support or resistance levels may switch roles after being breached.
  • Combine with Other Indicators: It's advisable to use support and resistance levels in conjunction with other technical indicators to increase reliability.
  • Risk Management: Set stop-loss orders and determine appropriate investment proportions.

Using support and resistance levels involves analyzing price movements and determining potential entry or exit points based on these key levels.


"Support and Resistance" เป็นหลักการที่สำคัญในการวิเคราะห์ทางเทคนิคสำหรับการเทรดหุ้น, สกุลเงิน, หรือสินทรัพย์อื่นๆ ในตลาดการเงิน แนวทางการใช้งานมีดังนี้:

การระบุแนวรับ (Support)

  1. แนวรับคือระดับราคา ที่ซื้อขายเกิดขึ้นอย่างหนาแน่น เมื่อราคาลดลงมาถึงจุดนี้ มักจะมีการซื้อเข้ามากันราคาไม่ให้ตกต่ำลงไปอีก
  2. การระบุแนวรับ: สังเกตที่ราคาต่ำสุดในช่วงเวลาหนึ่ง และหาจุดที่ราคาดีดกลับขึ้นมาหลายครั้ง
  3. การใช้งาน: แนวรับสามารถใช้เป็นจุดซื้อหรือตั้งจุดหยุดขาดทุน

การระบุแนวต้าน (Resistance)

  1. แนวต้านคือระดับราคา ที่ขายออกเกิดขึ้นอย่างหนาแน่น เมื่อราคาขึ้นไปถึงจุดนี้ มักจะมีการขายออกมากันราคาไม่ให้สูงขึ้นไปอีก
  2. การระบุแนวต้าน: สังเกตที่ราคาสูงสุดในช่วงเวลาหนึ่ง และหาจุดที่ราคาถูกกดลงมาหลายครั้ง
  3. การใช้งาน: แนวต้านสามารถใช้เป็นจุดขายหรือตั้งจุดหยุดขาดทุน

คำแนะนำในการใช้งาน

  • การยืนยันแนวรับ/ต้าน: รอให้มีสัญญาณยืนยันก่อนทำการซื้อหรือขาย เช่น ราคาปิดเหนือแนวต้านหรือต่ำกว่าแนวรับ
  • เปลี่ยนแปลงบทบาท: บางครั้งแนวรับหรือแนวต้านอาจเปลี่ยนบทบาทกัน เมื่อราคาผ่านไป
  • ใช้ร่วมกับตัวชี้วัดอื่น: ควรใช้ร่วมกับตัวชี้วัดทางเทคนิคอื่นๆ เพื่อเพิ่มความน่าเชื่อถือ
  • การจัดการความเสี่ยง: ตั้งจุดหยุดขาดทุนและกำหนดสัดส่วนการลงทุนที่เหมาะสม


Prodotti consigliati
Owl Smart Levels MT5
Sergey Ermolov
4.49 (37)
Versione MT4  |  FAQ L' indicatore Owl Smart Levels è un sistema di trading completo all'interno dell'unico indicatore che include strumenti di analisi di mercato popolari come i frattali avanzati di Bill Williams , Valable ZigZag che costruisce la corretta struttura a onde del mercato, e i livelli di Fibonacci che segnano i livelli esatti di entrata nel mercato e luoghi per prendere profitti. Descrizione dettagliata della strategia Istruzioni per lavorare con l'indicatore Consulente-assistente
L'indicatore calcola e traccia automaticamente i livelli di supporto e resistenza di Fibonacci, uno degli strumenti più efficaci per l'analisi di mercato. Il calcolo utilizza i dati del prezzo medio per il periodo e l'intervallo di tempo selezionati. Il minimo e il massimo per questo periodo sono presi come inizio e fine del movimento. I livelli di Fibonacci ti consentono di vedere potenziali punti di riferimento, attorno ai quali il movimento dei prezzi può rallentare o invertire, ovvero vengon
PipFinite Trend PRO MT5
Karlo Wilson Vendiola
4.87 (665)
Breakthrough Solution For Trend Trading And Filtering With All Important Features Built Inside One Tool! Trend PRO's smart algorithm detects the trend, filters out market noise and gives entry signals with exit levels. The new features with enhanced rules for statistical calculation improved the overall performance of this indicator. Important Information Revealed Maximize the potential of Trend Pro, please visit www.mql5.com/en/blogs/post/713938 The Powerful Expert Advisor Version Automa
Atomic Analyst MT5
Issam Kassas
5 (12)
Innanzitutto, vale la pena sottolineare che questo indicatore di trading non è repaint, non è ridisegno e non presenta ritardi, il che lo rende ideale sia per il trading manuale che per quello automatico. Manuale utente: impostazioni, input e strategia. L'Analista Atomico è un indicatore di azione del prezzo PA che utilizza la forza e il momentum del prezzo per trovare un miglior vantaggio sul mercato. Dotato di filtri avanzati che aiutano a rimuovere rumori e segnali falsi, e aumentare il pote
Il livello Premium è un indicatore unico con una precisione superiore all'80% delle previsioni corrette! Questo indicatore è stato testato dai migliori Specialisti di Trading per più di due mesi! L'indicatore dell'autore che non troverai da nessun'altra parte! Dagli screenshot puoi vedere di persona la precisione di questo strumento! 1 è ottimo per il trading di opzioni binarie con un tempo di scadenza di 1 candela. 2 funziona su tutte le coppie di valute, azioni, materie prime, cript
Noize Absorption Index - is the manual trading system that measures the difference of pressure between bears forces and bulls forces. Green line - is a noize free index that showing curent situation. Zero value of index shows totally choppy/flat market.Values above zero level shows how powerfull bullish wave is and values below zero measures bearish forces.Up arrow appears on bearish market when it's ready to reverse, dn arrow appears on weak bullish market, as a result of reverse expectation.
All Harmonics 26
Alexey Isavnin
3.8 (5)
Harmonic patterns are characteristic series of price movements with respect to Fibonacci levels, which statistically precede price reversals. This indicator searches for harmonic patterns. It is capable of recognising 26 classical and non-classical harmonic patterns : Classical Gartley Butterfly Alternate Butterfly Bat Alternate Bat Crab Deep Crab Three Drives Non-classical Shark Alternate Shark Cypher 5-0 Anti Gartley Anti Butterfly Anti Alternate Butterfly Anti Bat Anti Alternate Bat Anti Crab
Cumulative delta indicator As most traders believe, the price moves under the pressure of market buying or selling. When someone redeems an offer standing in the cup, the deal is a "buy". If someone pours into the bid standing in the cup - the deal goes with the direction of "sale". The delta is the difference between purchases and sales. A cumulative delta - the difference between the cumulative sum of purchases and sales for a certain period of time. It allows you to see who is currently contr
Double HMA MTF for MT5
Pavel Zamoshnikov
5 (2)
This is an advanced multi-timeframe version of the popular Hull Moving Average (HMA) Features Two lines of the Hull indicator of different timeframes on the same chart. The HMA line of the higher timeframe defines the trend, and the HMA line of the current timeframe defines the short-term price movements. A graphical panel with HMA indicator data from all timeframes at the same time . If the HMA switched its direction on any timeframe, the panel displays a question or exclamation mark with a tex
Renko Gold
Ignacio Agustin Mene Franco
Renko Gold! clearly indicates the floors and ceilings where it goes from 4 lines, the line below that marks the floor in green confirming with the thinnest line clarifies the purchase entry, the same is for sale, the top line marks the ceiling and the thinnest red line marks the sale, This indicator works for all temporalities! For Forex and Synthetic Indices markets! It also works for crypto markets! Good profit! World Investor.
MetaTrend M5
Vahidreza Heidar Gholami
5 (2)
Meta Trend Indicator is an efficient way to forecast and detect the trend in any market. It reveals the trend, support and resistance levels, volatility and the maximum potential target, all in one indicator. To adapt to the price and to decrease consecutive trend failures, the internal trend detector algorithm studies the market and dynamically chooses the right values for the internal parameters. This indicator is a perfect trend filter for any strategy or expert advisor. Features Super Adapti
PipFinite Exit EDGE MT5
Karlo Wilson Vendiola
4.89 (35)
Did You Have A Profitable Trade But Suddenly Reversed? In a solid strategy, exiting a trade is equally important as entering. Exit EDGE helps maximize your current trade profit and avoid turning winning trades to losers. Never Miss An Exit Signal Again Monitor all pairs and timeframes in just 1 chart www.mql5.com/en/blogs/post/726558 How To Trade You can close your open trades as soon as you receive a signal Close your Buy orders if you receive an Exit Buy Signal. Close your Sell orde
Innanzitutto, vale la pena sottolineare che questo Strumento di Trading è un Indicatore Non-Ridipingente, Non-Ridisegnante e Non-Laggante, il che lo rende ideale per il trading professionale. L'Indicatore Smart Price Action Concepts è uno strumento molto potente sia per i nuovi che per i trader esperti. Racchiude più di 20 utili indicatori in uno solo, combinando idee di trading avanzate come l'Analisi del Trader del Circolo Interno e le Strategie di Trading dei Concetti del Denaro Intelligen
Market Structure Patterns
Samuel Manoel De Souza
4.7 (20)
Market Structure Patterns   is an indicator based on   smart money concepts   that displays   SMC/ICT   elements that can take your trading decisions to the next level. Take advantage of the   alerts ,   push notifications   and   email messages   to keep informed from when an element is formed on the chart, the price crosses a level and/or enters in a box/zone. Developers can access the values of the elements of the indicator using the   global variables  what allows the automation of trading
Your Trend Friend
Luigi Nunes Labigalini
The trend is your friend! Look at the color of the indicator and trade on that direction. It does not  repaint. After each candle is closed, that's the color of the trend. You can focus on shorter faster trends or major trends, just test what's most suitable for the symbol and timeframe you trade. Simply change the "Length" parameter and the indicator will automatically adapt. You can also change the color, thickness and style of the lines. Download and give it a try! There are big movements
Laguerre SuperTrend Clouds   adds an Adaptive Laguerre averaging algorithm and alerts to the widely popular SuperTrend indicator. As the name suggests,   Laguerre SuperTrend Clouds (LSC)   is a trending indicator which works best in trendy (not choppy) markets. The SuperTrend is an extremely popular indicator for intraday and daily trading, and can be used on any timeframe. Incorporating Laguerre's equation to this can facilitate more robust trend detection and smoother filters. The LSC uses the
Magic Finger can help you identify trends and trading opportunities clearly. The finger points to the open position signal, and the discoloration line is confirmed by the trend. If you are a day trader, you can choose to trade during a period of active trading, referring to the discoloration line as the basis for the next order, finger signal as a filter. If you are a trend trader, you can choose a period above H1, wait for the appearance of the finger signal in the key price area, and enter
An indicator of pattern #31 ("Long Island") from Encyclopedia of Chart Patterns by Thomas N. Bulkowski. The second gap is in the opposite direction. Parameters: Alerts - show alert when an arrow appears   Push - send a push notification when an arrow appears (requires configuration in the terminal) GapSize - minimum gap size in points ArrowType - a symbol from 1 to 17 ArrowVShift - vertical shift of arrows in points   ShowLevels - show levels ColUp - color of an upward line ColDn - color of a
This indicator obeys the popular maxim that: "THE TREND IS YOUR FRIEND" It paints a Blue line for BUY and also paints a RED line for SELL. (you can change the colors). It gives alarms and alerts of all kinds. IT DOES NOT REPAINT COLOR and can be used for all currency pairs and timeframes. Yes, as easy and simple as that. Even a newbie can use it to make great and reliable trades. https://www.mql5.com/en/market/product/115553
PZ Trend Trading MT5
PZ TRADING SLU
3.67 (3)
Trend Trading is an indicator designed to profit as much as possible from trends taking place in the market, by timing pullbacks and breakouts. It finds trading opportunities by analyzing what the price is doing during established trends. [ Installation Guide | Update Guide | Troubleshooting | FAQ | All Products ] Trade financial markets with confidence and efficiency Profit from established trends without getting whipsawed Recognize profitable pullbacks, breakouts and early reversals The ind
Price Breakout pattern Scanner is the automatic scanner for traders and investors. It can detect following patterns automatically from your chart. Head and Shoulder - Common tradable pattern. Reverse Head and Shoulder - This pattern is the reverse formation of the Head and Shoulder. Double Top - When the price hits resistance level twice and decline toward the support level, the trader can anticipate sudden bearish breakout through the support level. Double Bottom - The double bottom pattern is
Ultimate Supply Demand MT5
Ramon Sobrevals Arce
5 (4)
After working during many months, with the help of Neural Networks, we have perfected the ultimate tool you are going to need for identifying key price levels (Supports and Resistances) and Supply and Demand zones. Perfectly suitable to trigger your trades, set up your future actions, decide your Take Profit and Stop Loss levels, and confirm the market direction. Price will always move between those levels, bouncing or breaking; from one zone to another, all the remaining movements are just mark
The 123 Pattern is one of the most popular, powerful and flexible chart patterns. The pattern is made up of three price points: a bottom, a peak or valley, and a Fibonacci retracement between 38.2% and 71.8%. A pattern is considered valid when the price breaks beyond the last peak or valley, moment at which the indicator plots an arrow, rises an alert, and the trade can be placed. [ Installation Guide | Update Guide | Troubleshooting | FAQ | All Products ] Clear trading signals Customizable c
Seconds Timeframes Chart MT5
Abdelkhabir Yassine Alaoui
5 (1)
Grafico dei secondi per MetaTrader 5 Gli indicatori ti consentono di creare grafici nel terminale MetaTrader 5 con un intervallo di tempo in secondi. L'intervallo di tempo su tale grafico è impostato in secondi, non in minuti o ore. Pertanto, puoi creare grafici con un intervallo di tempo inferiore a M1. Ad esempio, S15 è un intervallo di tempo con un periodo di 15 secondi. È possibile applicare indicatori, Expert Advisor e script al grafico risultante. Ottieni un grafico completamente funz
FREE
How to use Pair Trading Station Pair Trading Station is recommended for H1 time frame and you can use it for any currency pairs. To generate buy and sell signal, follow few steps below to apply Pair Trading Station to your MetaTrader terminal. When you load Pair Trading Station on your chart, Pair Trading station will assess available historical data in your MetaTrader platforms for each currency pair. On your chart, the amount of historical data available will be displayed for each currency pai
Was: $249  Now: $99   Market Profile defines a number of day types that can help the trader to determine market behaviour. A key feature is the Value Area, representing the range of price action where 70% of trading took place. Understanding the Value Area can give traders valuable insight into market direction and establish the higher odds trade. It is an excellent addition to any system you may be using. Inspired by Jim Dalton’s book “Mind Over Markets”, this indicator is designed to suit the
Orbit Rage Final 2
BILLY ARANDUQUE ABCEDE
Note : i only sell this EA on MQL5, any other sellers is fake. Orbit Rage Final, a cutting-edge trading strategy meticulously designed around the bull/bear candle approach and divergence analysis. This powerful tool is engineered to empower you to shape the life you desire. To embark on this transformative journey, simply download and seamlessly integrate it into your MetaTrader 4 platform by placing it in the experts advisors folder. Orbit Rage Final revolutionizes trading by offering a risk-f
QM Pattern Scanner MT5
Reza Aghajanpour
5 (3)
QM (Quasimodo) Pattern is based on Read The Market(RTM) concepts. The purpose of this model is to face the big players of the market (financial institutions and banks), As you know in financial markets, big traders try to fool small traders, but RTM prevent traders from getting trapped. This style is formed in terms of price candles and presented according to market supply and demand areas and no price oscillator is used in it. RTM concepts are very suitable for all kinds of investments, includi
Golden Spikes Detector
Batsirayi L Marango
5 (1)
Golden Spikes Detector This indicator is based on an advanced strategy primarily for trading spikes on Boom and Crash Indices. Complex algorithms were implemented to detect high probability entries only. It alerts on potential Buy and Sell entries. To trade spikes on the Deriv or Binary broker, only take Buy Boom and Sell Cash alerts. It was optimised to be loaded on 5-minute timeframe although multiple timeframe analysis is done in the background. Features ·             Desktop pop up and sound
Trend Master Chart MT5
Frederic Jacques Collomb
5 (2)
Trend Master Chart è l'indicatore di tendenza di cui hai bisogno. Si sovrappone al grafico e utilizza la codifica a colori per definire le diverse tendenze/mosse del mercato. Utilizza un algoritmo che combina due medie mobili e diversi oscillatori. I periodi di questi tre elementi sono modificabili. Funziona su qualsiasi intervallo di tempo e su qualsiasi coppia. A colpo d'occhio sarai in grado di identificare una tendenza al rialzo o al ribasso e i diversi punti di ingresso in questa tendenz
FREE
Gli utenti di questo prodotto hanno anche acquistato
Innanzitutto è importante sottolineare che questo sistema di trading è un indicatore Non-Repainting, Non-Redrawing e Non-Lagging, il che lo rende ideale sia per il trading manuale che per quello automatico. Corso online, manuale e download di preset. Il "Sistema di Trading Smart Trend MT5" è una soluzione completa pensata sia per i trader principianti che per quelli esperti. Combina oltre 10 indicatori premium e offre più di 7 robuste strategie di trading, rendendolo una scelta versatile per div
FX Volume MT5
Daniel Stein
4.94 (17)
Ricevi il tuo aggiornamento quotidiano sul mercato con dettagli e schermate tramite il nostro Morning Briefing qui su mql5 e su Telegram ! FX Volume è il PRIMO e UNICO indicatore di volume che fornisce una visione REALE del sentiment del mercato dal punto di vista del broker. Fornisce informazioni straordinarie su come gli operatori di mercato istituzionali, come i broker, sono posizionati sul mercato Forex, molto più velocemente dei rapporti COT. Vedere queste informazioni direttamente sul vo
Quantum Trend Sniper
Bogdan Ion Puscasu
5 (39)
Presentazione       Quantum Trend Sniper Indicator   , l'innovativo indicatore MQL5 che sta trasformando il modo in cui identifichi e scambi le inversioni di tendenza! Sviluppato da un team di trader esperti con un'esperienza di trading di oltre 13 anni,       Indicatore Quantum Trend Sniper       è progettato per spingere il tuo viaggio di trading verso nuove vette con il suo modo innovativo di identificare le inversioni di tendenza con una precisione estremamente elevata. *** Acquista Quant
Gold Stuff mt5
Vasiliy Strukov
4.89 (170)
Gold Stuff mt5 è un indicatore di tendenza progettato specificamente per l'oro e può essere utilizzato anche su qualsiasi strumento finanziario. L'indicatore non ridisegna e non è in ritardo. Periodo consigliato H1. Contattami subito dopo l'acquisto per avere le impostazioni e un bonus personale!   IMPOSTAZIONI Disegna freccia - acceso spento. disegnando frecce sul grafico. Avvisi: avvisi acustici disattivati. Notifica e-mail - on off. notifiche di posta elettronica. Notifica Puch - on of
Presentazione       Quantum Breakout PRO   , l'innovativo indicatore MQL5 che sta trasformando il modo in cui scambi le zone di breakout! Sviluppato da un team di trader esperti con un'esperienza di trading di oltre 13 anni,       Quantum Breakout PRO       è progettato per spingere il tuo viaggio di trading a nuovi livelli con la sua strategia innovativa e dinamica della zona di breakout. Quantum Breakout Indicator ti fornirà frecce di segnalazione sulle zone di breakout con 5 zone target
RelicusRoad Pro MT5
Relicus LLC
4.82 (22)
Ora $ 147 (aumentando a $ 499 dopo alcuni aggiornamenti) - account illimitati (PC o MAC) Manuale utente di RelicusRoad + Video di formazione + Accesso al gruppo Discord privato + Stato VIP UN NUOVO MODO DI GUARDARE IL MERCATO RelicusRoad è l'indicatore di trading più potente al mondo per forex, futures, criptovalute, azioni e indici, fornendo ai trader tutte le informazioni e gli strumenti di cui hanno bisogno per rimanere redditizi. Forniamo analisi tecniche e piani di trading per aiutar
TPSproTREND PrO MT5
Roman Podpora
5 (6)
TPSpro TRENDPRO  - is a trend indicator that automatically analyzes the market and provides information about the trend and each of its changes, as well as giving signals for entering trades without redrawing! The indicator uses each candle, analyzing them separately. referring to different impulses - up or down impulse. Exact entry points into transactions for currencies, crypto, metals, stocks, indices!  -  Version MT4                  DETAILED DESCRIPTION        /       TRADING SETUPS       
FX Power MT5 NG
Daniel Stein
5 (5)
Ricevi il tuo aggiornamento quotidiano sul mercato con dettagli e schermate tramite il nostro Morning Briefing qui su mql5 e su Telegram ! FX Power MT5 NG è la nuova generazione del nostro popolare misuratore di forza delle valute, FX Power. Cosa offre questo misuratore di forza di nuova generazione? Tutto ciò che avete amato dell'FX Power originale IN PIÙ Analisi della forza di ORO/XAU Risultati di calcolo ancora più precisi Periodi di analisi configurabili individualmente Limite di calcolo pe
A key element in trading is zones or levels from which decisions to buy or sell a trading instrument are made. Despite attempts by major players to conceal their presence in the market, they inevitably leave traces. Our task was to learn how to identify these traces and interpret them correctly. Reversal First Impulse levels (RFI)   -  Version MT4                  INSTRUCTIONS                 RUS                 ENG                         R ecommended to use with an indicator   -  TREND PRO  
Advanced Supply Demand MT5
Bernhard Schweigert
4.53 (15)
La migliore soluzione per qualsiasi principiante o trader esperto! Questo indicatore è uno strumento di trading unico, di alta qualità e conveniente perché abbiamo incorporato una serie di funzionalità proprietarie e una nuova formula. Con questo aggiornamento, sarai in grado di mostrare fusi orari doppi. Non solo potrai mostrare una TF più alta, ma anche entrambe, la TF del grafico, PIÙ la TF più alta: SHOWING NESTED ZONES. Tutti i trader di domanda di offerta lo adoreranno. :) Informazioni imp
This is arguably the most complete harmonic price formation auto-recognition indicator you can find for the MetaTrader Platform. It detects 19 different patterns, takes fibonacci projections as seriously as you do, displays the Potential Reversal Zone (PRZ) and finds suitable stop-loss and take-profit levels. [ Installation Guide | Update Guide | Troubleshooting | FAQ | All Products ] It detects 19 different harmonic price formations It plots primary, derived and complementary Fibonacci p
Gartley Hunter Multi
Siarhei Vashchylka
5 (6)
Gartley Hunter Multi - An indicator for searching for harmonic patterns simultaneously on dozens of trading instruments and on all classic timeframes: (m1, m5, m15, m30, H1, H4, D1, Wk, Mn). Manual (Be sure to read before purchasing) | Version for MT4 Advantages 1. Patterns: Gartley, Butterfly, Shark, Crab. Bat, Alternate Bat, Deep Crab, Cypher 2. Simultaneous search for patterns on dozens of trading instruments and on all classic timeframes 3. Search for patterns of all possible sizes. Fr
MetaForecast M5
Vahidreza Heidar Gholami
5 (2)
MetaForecast predice e visualizza il futuro di qualsiasi mercato basandosi sull'armonia dei dati dei prezzi. Sebbene il mercato non sia sempre prevedibile, se esiste un modello nei prezzi, MetaForecast può prevedere il futuro con la massima precisione possibile. Rispetto ad altri prodotti simili, MetaForecast può generare risultati più accurati analizzando le tendenze di mercato. Parametri di input Past size (Dimensione passata) Specifica il numero di barre che MetaForecast utilizza per creare
Top indicator for MT5   providing accurate signals to enter a trade without repainting! It can be applied to any financial assets:   forex, cryptocurrencies, metals, stocks, indices .  Watch  the video  (6:22) with an example of processing only one signal that paid off the indicator! MT4 version is here It will provide pretty accurate trading signals and tell you when it's best to open a trade and close it. Most traders improve their trading results during the first trading week with the help of
Golden Gate Algo MT5
James David Lane
4 (6)
40% DI SCONTO PER NATALE! AUMENTO DEL PREZZO A $250 IL 1 GENNAIO! Presentiamo GoldenGate Entries: una soluzione di trading all'avanguardia! Scopri un approccio rivoluzionario al trading con GoldenGate Entries (GGE), un indicatore avanzato progettato per migliorare la tua esperienza di trading. GGE offre un set completo di funzionalità per fornire agli utenti precisione e fiducia nelle loro decisioni di trading. Coppie: Qualsiasi (FX - Materie prime - Azioni - Azioni - Cripto) TimeFrame
Good day! I present to you a trading technical indicator for Deriv broker synthetic indices. This indicator ONLY works with the following indices: Boom 300 Index Boom 500 Index Boom 1000 Index Crash 300 Index Crash 500 Index Crash 1000 Index The indicator was created to give signals to open medium-term trades in the direction of Spikes. But you can open trades in the opposite direction to Spikes, at your own risk. Trade only on M1. Other TFs do not guarantee the correct operation of the indic
FxaccurateLS
Shiv Raj Kumawat
WHY IS OUR FXACCCURATE LS MT5 THE PROFITABLE ? PROTECT YOUR CAPITAL WITH RISK MANAGEMENT Gives entry, stop and target levels from time to time. It finds Trading opportunities by analyzing what the price is doing during established trends. POWERFUL INDICATOR FOR A RELIABLE STRATEGIES We have made these indicators with a lot of years of hard work. It is made at a very advanced level. Established trends provide dozens of trading opportunities, but most trend indicators completely ignore them!
La soluzione migliore per ogni principiante o trader esperto! Questo indicatore è uno strumento di trading unico, di alta qualità e conveniente perché abbiamo incorporato una serie di caratteristiche proprietarie e una formula segreta. Con un solo grafico fornisce avvisi per tutte le 28 coppie di valute. Immaginate come migliorerà il vostro trading perché sarete in grado di individuare l'esatto punto di innesco di una nuova tendenza o opportunità di scalping! Costruito su nuovi algoritmi so
XQ Indicator MetaTrader 5
Marzena Maria Szmit
5 (1)
Step into the realm of Forex trading with confidence and precision using XQ, a cutting-edge Forex indicator designed to elevate your trading game to unprecedented heights. Whether you're a seasoned trader or just stepping into the world of currency exchange, XQ Forex Indicator empowers you with the insights and signals needed to make informed trading decisions. The signal conditions are a combination of three indicators, and XQ Forex Indicator only display  medium and long-term trends . The ind
Strong Support mt5
Vasiliy Strukov
5 (9)
I livelli di supporto e resistenza sono stati a lungo uno strumento potente per l'analisi del mercato. L'indicatore di supporto forte costruisce livelli di supporto ai minimi di prezzo locali e livelli di resistenza ai massimi di prezzo locali.  Gli altri miei sviluppi possono essere visualizzati qui Si consiglia di utilizzare insieme a un indicatore di tendenza, ad esempio, Gold Stuff : ciò consentirà di negoziare sulla tendenza e allo stesso tempo determinare le zone di consolidamento o i
Royal Scalping Indicator M5
Vahidreza Heidar Gholami
5 (8)
My products are currently 50% off. Explore them and build your own strategy. Royal Scalping Indicator is an advanced price adaptive indicator designed to generate high-quality trading signals. Built-in multi-timeframe and multi-currency capabilities make it even more powerful to have configurations based on different symbols and timeframes. This indicator is perfect for scalp trades as well as swing trades. Royal Scalping is not just an indicator, but a trading strategy itself. Features Price A
TrendMaestro5
Stefano Frisetti
nota: questo indicatore e' per METATRADER5, se vuoi la versione per  METATRADER4 questo e' il link:   https://www.mql5.com/it/market/product/108106 TRENDMAESTRO ver 2.4 TRENDMAESTRO   riconosce un nuovo TREND sul nascere, non sbaglia mai. La sicurezza di identificare un nuovo TREND non ha prezzo. DESCRIZIONE TRENDMAESTRO identifica un nuovo TREND sul nascere, questo indicatore prende in esame la volatilita' i volumi ed il momentum per identificare il momento in cui c'e' un'esplosione di uno
Trend Scanner mt5 GS
Vasiliy Strukov
4.93 (15)
Trend Scanner scansiona le tendenze del mercato da Multi-Simboli e Multi-Time frame e lo visualizza su un pannello mobile sul grafico che utilizza l'indicatore di roba Gold per l'analisi Le funzionalità includono avvisi ed e-mail, nonché notifiche push. Il trader può selezionare più coppie di sua scelta per la visualizzazione. Trend Scanner è un ottimo strumento per vedere la direzione del trend e può essere utilizzato per il trading manuale o il trading EA consentendo solo di acquistare o vend
TPA True Price Action indicator reveals the true price action of the market makers through 100% non-repainting signals strictly at the close of a candle! TPA shows entries and re-entries, every time the bulls are definitely stronger than the bears and vice versa. Not to confuse with red/green candles. The shift of power gets confirmed at the earliest stage and is ONE exit strategy of several. There are available now two free parts of the TPA User Guide for our customers. The first "The Basics"
Professional Scalping Tool on Deriv Attention! The indicator will be sold in limited quantities!!! The previous 5 copies were sold for $250 The next 5 copies will be sold for $350 The next price is $500 Description: This trading indicator is designed for professional traders focused on scalping. Designed with the market in mind, it provides highly accurate spike trading signals. It works on the M1 timeframe and supports the following symbols: Boom 300 Index, Boom 500 Index, Boom 1000 Index,
L'indicatore Quadrato di Gann è uno strumento potente di analisi di mercato basato sull'articolo "Formula Matematica per le Previsioni di Mercato" scritto da W.D. Gann. Questo strumento utilizza concetti matematici e teorie di Gann per effettuare un'analisi precisa del mercato. Utilizza i quadrati di 144, 90, 52 e anche il quadrato di 9. Inoltre, integra il metodo del  per il quadrato di 9 e la sua relazione con canali e modelli stellari di quel quadrato. Manuale Utente e Applicazione: Prima di
Bill Williams Advanced
Siarhei Vashchylka
5 (5)
Bill Williams Advanced is designed for automatic chart analysis using Bill Williams' "Profitunity" system. The indicator analyzes four timeframes at once. Manual (Be sure to read before purchasing) Advantages 1. Automatically analyzes the chart using the "Profitunity" system of Bill Williams. The found signals are placed in a table in the corner of the screen. 2. Equipped with a trend filter based on the Alligator indicator. Most of the system signals are recommended to be used only accordi
PZ Swing Trading MT5
PZ TRADING SLU
5 (4)
Swing Trading is the first indicator designed to detect swings in the direction of the trend and possible reversal swings. It uses the baseline swing trading approach, widely described in trading literature. The indicator studies several price and time vectors to track the aggregate trend direction and detects situations in which the market is oversold or overbought and ready to correct. [ Installation Guide | Update Guide | Troubleshooting | FAQ | All Products ] Profit for market swings with
MetaBands M5
Vahidreza Heidar Gholami
4.67 (3)
MetaBands uses powerful and unique algorithms to draw channels and detect trends so that it can provide traders with potential points for entering and exiting trades. It’s a channel indicator plus a powerful trend indicator. It includes different types of channels which can be merged to create new channels simply by using the input parameters. MetaBands uses all types of alerts to notify users about market events. Features Supports most of the channel algorithms Powerful trend detection algorith
Eng Gold
Ely Alkrar Xshkaky
ENG-GOLD Scalper It is an auxiliary indicator that identifies potential targets and determines the place of entry with a stop loss that works on Heiken Ashi candles  The green lines are usually the targets, the red lines are the stop loss, and the yellow lines are the entry location.  This file is recognized on small and medium frames, usually less than the watch frame I highly recommend using XAUUSD US100 US30 USOIL 
Altri dall’autore
GT0TSBtrader
Mr Nisit Noijeam
"Grid Trading" is a trading strategy in the financial markets that focuses on systematic risk control and position management by using a grid of buy and sell orders. Generally, Grid Trading involves setting two target price levels: the buy limit price and the sell limit price, with the buy target price being lower than the current market price and the sell target price being higher than the current market price. The Grid Trading strategy typically consists of the following main steps: Set Targ
FREE
Expert Advisor (EA),  MA Following  commonly known as a trading bot. It implements a grid trading strategy with the following characteristics: Moving Average and Standard Deviation : The EA uses a Moving Average (MA) as the core of its trading strategy, combined with Standard Deviation (SD) for trade entry and exit decisions. There are four types of MAs available: Simple, Exponential, Smoothed, and Linear Weighted. Users can select the MA type and set its period, as well as the period and fact
FREE
CapitalTrendline2
Mr Nisit Noijeam
EnJoy  trend line It is a basic tool in technical analysis which is used to track and predict the direction of price movements. It is created by connecting the lowest or highest points of prices on the chart. To create a straight line that helps in interpreting market direction. For example: Uptrend Line: Connects multiple low points on the chart. It indicates a continuous increase in prices. Downtrend Line: Connects multiple highs. It indicates a continuous decrease in prices. เส้นเทรนด์ไลน์ เป
Capital Pivot
Mr Nisit Noijeam
Pivot Points และระดับ (Support) และ(Resistance) บนแผนภูมิการเทรดใน MetaTrader 4 สำหรับตลาด Forex : คำนวณ Pivot Points : สคริปต์คำนวณจุด Pivot โดยใช้ข้อมูลราคาประวัติศาสตร์ เช่น ราคาเปิด, ราคาสูงสุด, ราคาต่ำสุด, และราคาปิด จากช่วงเวลาที่กำหนด (เช่น วัน, ชั่วโมง, ฯลฯ) จุด Pivot และระดับต่างๆ เช่น R1, R2, R3 (ระดับการต้านทาน) และ S1, S2, S3 (ระดับการสนับสนุน) ถูกคำนวณออกมา แสดงบนแผนภูมิ : หลังจากคำนวณจุด Pivot และระดับต่างๆ, สคริปต์จะแสดงเส้นเหล่านี้บนแผนภูมิ MT4 เพื่อช่วยให้นักเทรดสามารถเห็นจุดที่
CapitalCraft
Mr Nisit Noijeam
A Grid EA (Grid Expert Advisor) is an automated trading system used in the financial markets that employs a grid trading strategy. Grid trading involves opening buy and sell orders at predetermined price levels, with a specified price interval, known as the price grid. This trading strategy is similar to placing Buy Limit and Sell Limit orders at pre-defined price and time intervals. The EA operates automatically based on predefined rules and typically includes the following features: Price G
Capital Trend
Mr Nisit Noijeam
indicator named "MTRADER" designed to be used with the MetaTrader 4 trading platform. It appears to be a technical analysis tool for forex or stock market trading. Here's a breakdown of its key components and functionalities: Indicator Properties and Inputs : The code begins by setting up basic properties of the indicator, such as its name, version, and drawing styles. It defines two indicator buffers with blue and red colors, likely used for graphical representation on charts. Input parameters
CapitalTrendline
Mr Nisit Noijeam
EnJoy  trend line It is a basic tool in technical analysis which is used to track and predict the direction of price movements. It is created by connecting the lowest or highest points of prices on the chart. To create a straight line that helps in interpreting market direction. For example: Uptrend Line: Connects multiple low points on the chart. It indicates a continuous increase in prices. Downtrend Line: Connects multiple highs. It indicates a continuous decrease in prices. เส้นเทรนด์ไลน์
CapitalMAGL
Mr Nisit Noijeam
GRID MA TRADING Trading Strategy Overview Moving Average (MA) Based Decisions : The EA uses a Moving Average (MA) as a key indicator for its trading decisions. The type (Simple, Exponential, Smooth, Linear Weighted), period, and shift of the MA are configurable. It decides whether to buy or sell based on the position of the price relative to the MA. For example, it may stop buying if the price is below the MA or stop selling if the price is above the MA. Grid Trading System : The EA appears to i
การดำเนินงานพื้นฐาน : EA ทำงานโดยใช้หลักการของการเทรดแบบกริด ซึ่งหมายถึงการวางคำสั่งซื้อและขายเป็นระยะๆ (กำหนดเป็นเปอร์เซ็นต์ของราคา) ภายในโซนที่กำหนดไว้ พารามิเตอร์ป้อนข้อมูล : EA ใช้พารามิเตอร์หลายอย่าง เช่น ขนาดกริด, กำไรที่คาดหวัง, การหยุดขาดทุน (ทั้งหมดเป็นเปอร์เซ็นต์), โซนสำหรับการซื้อและขาย, ขนาดล็อต, และจำนวนคำสั่งสูงสุดที่อนุญาต พารามิเตอร์เหล่านี้มีความสำคัญในการกำหนดวิธีการทำงานของ EA การเริ่มต้น (OnInit) : เมื่อ EA เริ่มทำงาน, มันจะทำการเริ่มต้นโดยสร้างป้ายบนกราฟ (ชื่อ "MTRADER_Labe
CapitalAsgard
Mr Nisit Noijeam
This EA, named "MTRADER," is designed for the MT4 (MetaTrader 4) trading platform. It operates based on a grid trading strategy and includes functionality for both buy and sell orders. Here's an overview of its key features and functionalities: Trading Zones: The EA operates within specified price zones for buying and selling. BuyZoneStart and BuyZoneEnd define the range within which the EA will consider placing buy orders, while SellZoneStart and SellZoneEnd define the range for sell orders. Or
CapitalRoyal
Mr Nisit Noijeam
MA trend following 1sd signal  The EA appears to use a combination of moving averages and standard deviation to make trading decisions, with the option to increase lot sizes after consecutive losses, potentially aiming for a martingale-like strategy. It's important to note that while EAs can automate trading, they come with risks, especially when using strategies like lot size increase on loss. Users should thoroughly backtest and understand the EA's strategy and risks before using it in live tr
Capital ATR
Mr Nisit Noijeam
Expert Advisor (EA) for MetaTrader 4 (MT4) platform, named MTRADER. Its primary strategy appears to be a grid trading strategy based on moving averages and average true range (ATR) volatility. Here's a breakdown of its key components and functionalities: Initialization Parameters : It defines various input parameters such as Moving Average Type (Simple, Exponential, Smoothed, or Linear Weighted), Moving Average Period, ATR Period, ATR Factor, Initial Lot Size, etc. These parameters can be adjust
Volume Profile เป็นเครื่องมือที่ใช้สำหรับการวิเคราะห์ระดับการซื้อขายของตลาดในแต่ละระยะเวลาโดยใช้ปริมาณการซื้อขาย (volume) ซึ่งช่วยให้เราเข้าใจว่ามีการซื้อขายเกิดขึ้นมากที่สุดที่ราคาใด รวมทั้งช่วยในการหาจุดที่มีความนิยมในการซื้อขาย (Point of Control: POC) และระดับการซื้อขายอื่น ๆ ที่สำคัญ เรียกว่า Value Area. การใช้งาน Volume Profile ในการวิเคราะห์ตลาดมักจะมีขั้นตอนดังนี้: กำหนดระยะเวลาที่ต้องการวิเคราะห์ : เราต้องกำหนดระยะเวลาที่เราสนใจในการวิเคราะห์ Volume Profile เช่น ชั่วโมง, วัน, หรือสัปดาห์
CapitalSMC
Mr Nisit Noijeam
The "SMC Trading Strategy" or "Smart Money Concept" is a trading strategy that focuses on understanding and following the movements of "large capital" or "Smart Money", which usually refers to institutional investors or major players who can influence the stock or asset markets. This strategy relies on technical and behavioral market analysis to predict market or stock price directions by observing the actions of Smart Money. These investors are believed to have more information, resources, and
CapitalMIXindy
Mr Nisit Noijeam
The indicator plots up/down buffer arrows in the chart window two of the following indicator conditions are met. Moving Average ; Moving Average Convergence/Divergence (MACD ); Oscillator of Moving Averages (OsMA ); Stochastic Oscillator ; Relative Strength Index (RSI) ; Commodity Channel Index (CCI) ; Relative Vigor Index (RVI ); Average Directional Index (ADX) ; Triple Exponential Average ; Bollinger Bands ; ตัวบ่งชี้จะพล็อตลูกศรขึ้น/ลงในหน้าต่างแผนภูมิเมื่อตรงตามเงื่อนไขของตัวบ่งชี้สองตัวต่
Filtro:
Nessuna recensione
Rispondi alla recensione