• Panoramica
  • Recensioni (1)
  • Commenti (1)

Trading In The Zone

Ciò richiede che un frattale si chiuda ancora, quindi l'indicatore calcolerà di nuovo se cambiato e il frattale non si è chiuso. Questa è proprio la natura di un frattale.

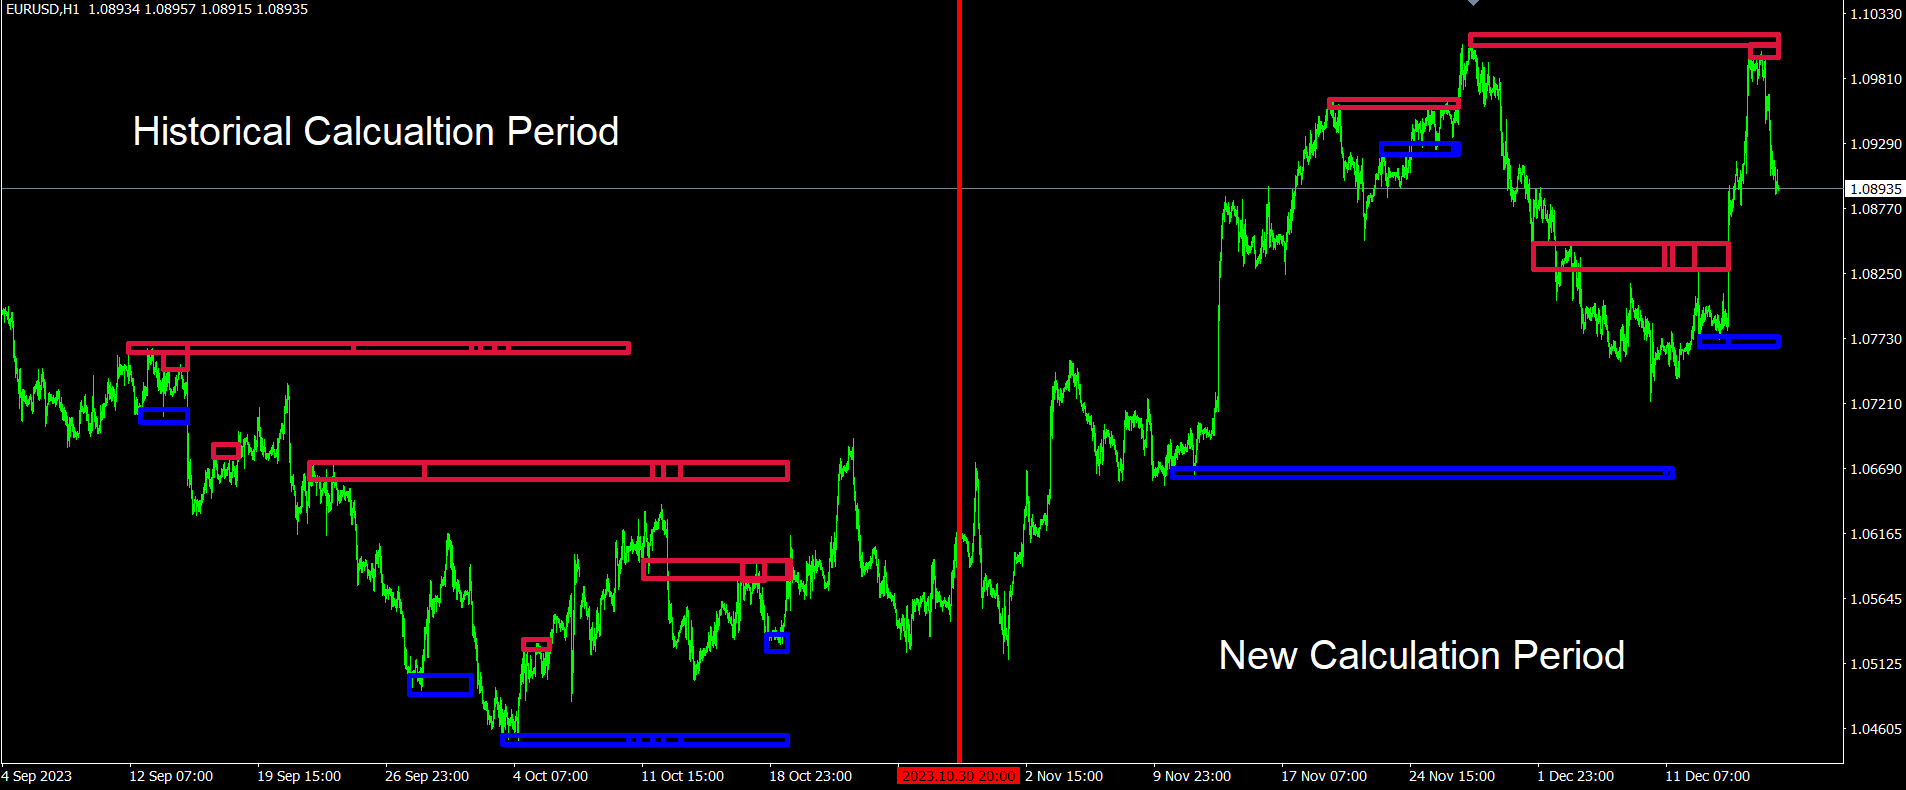
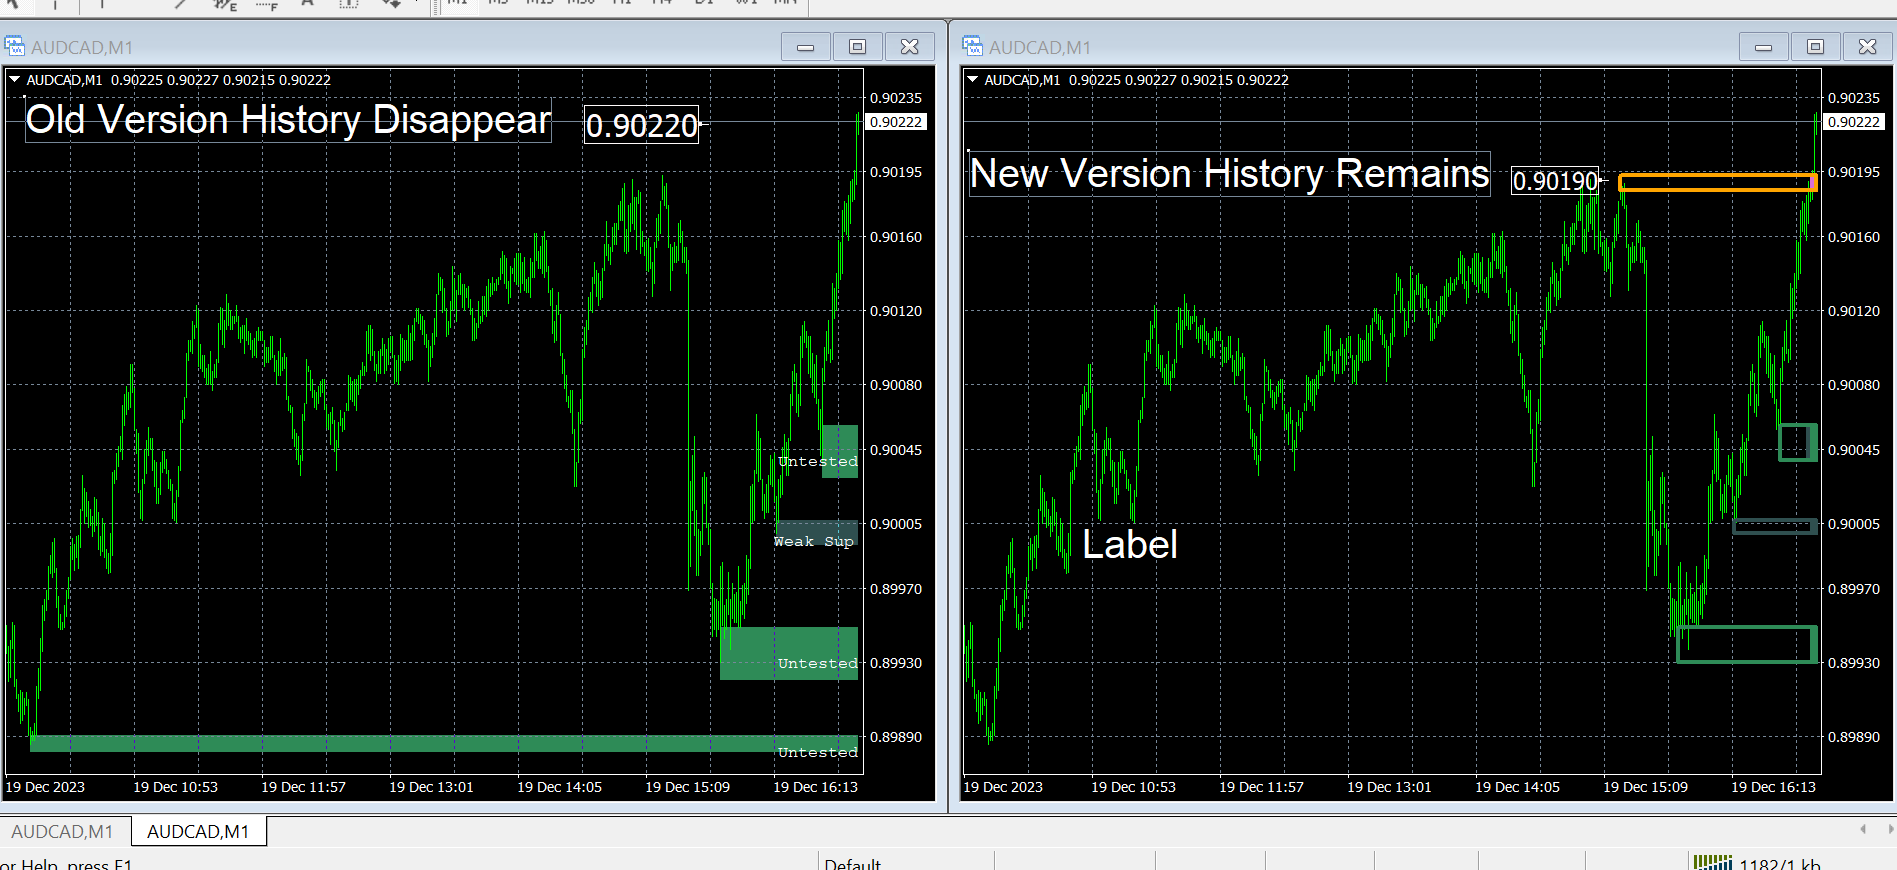
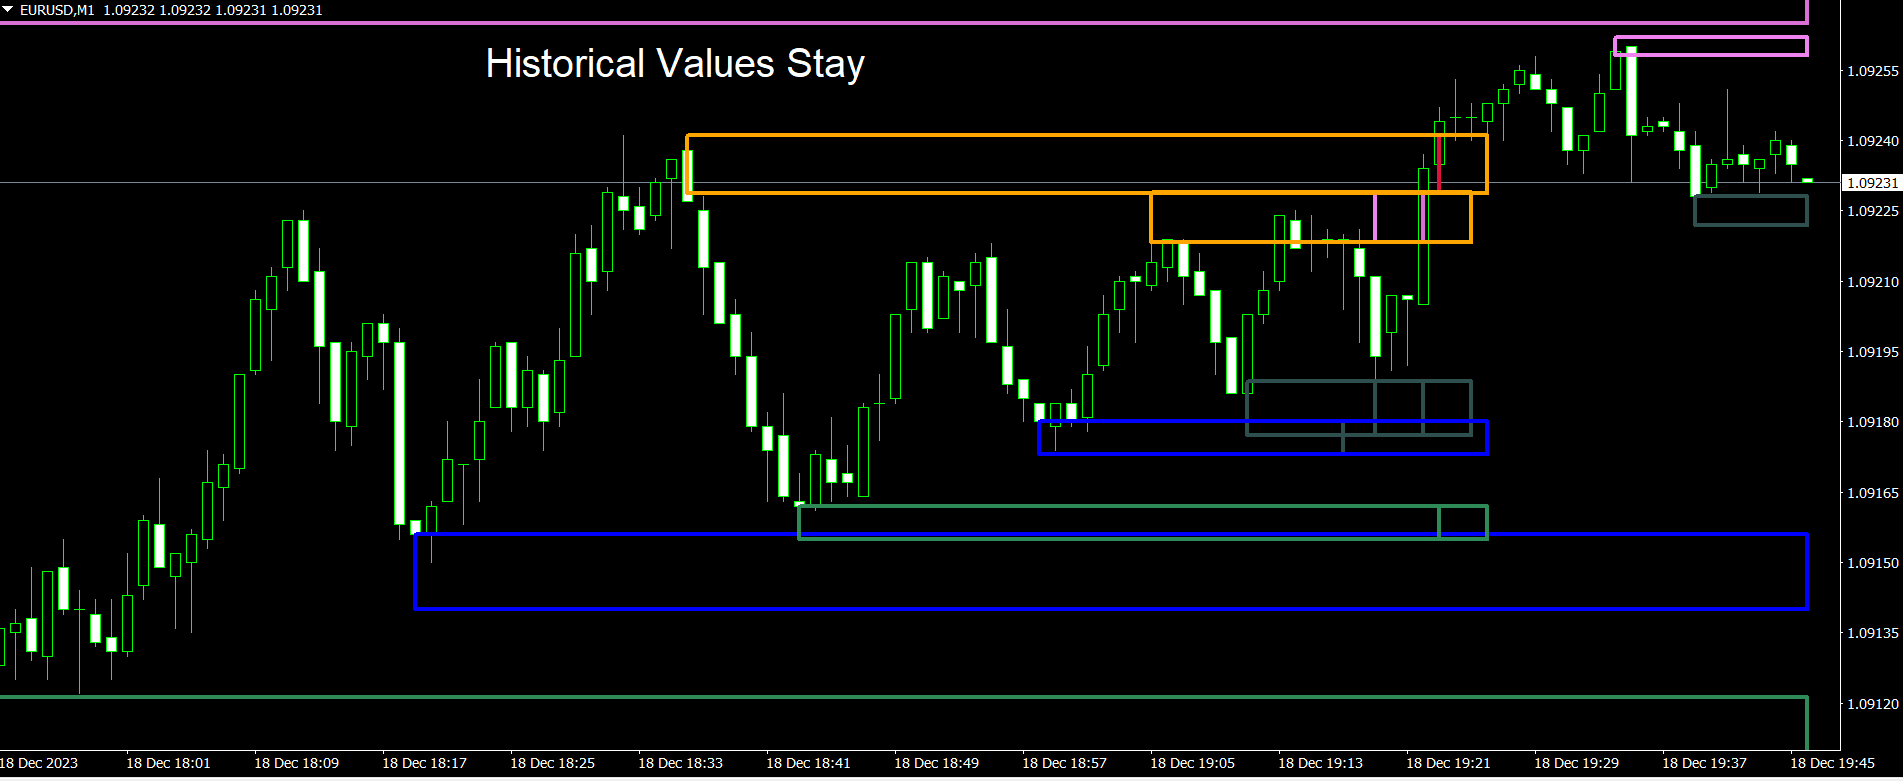
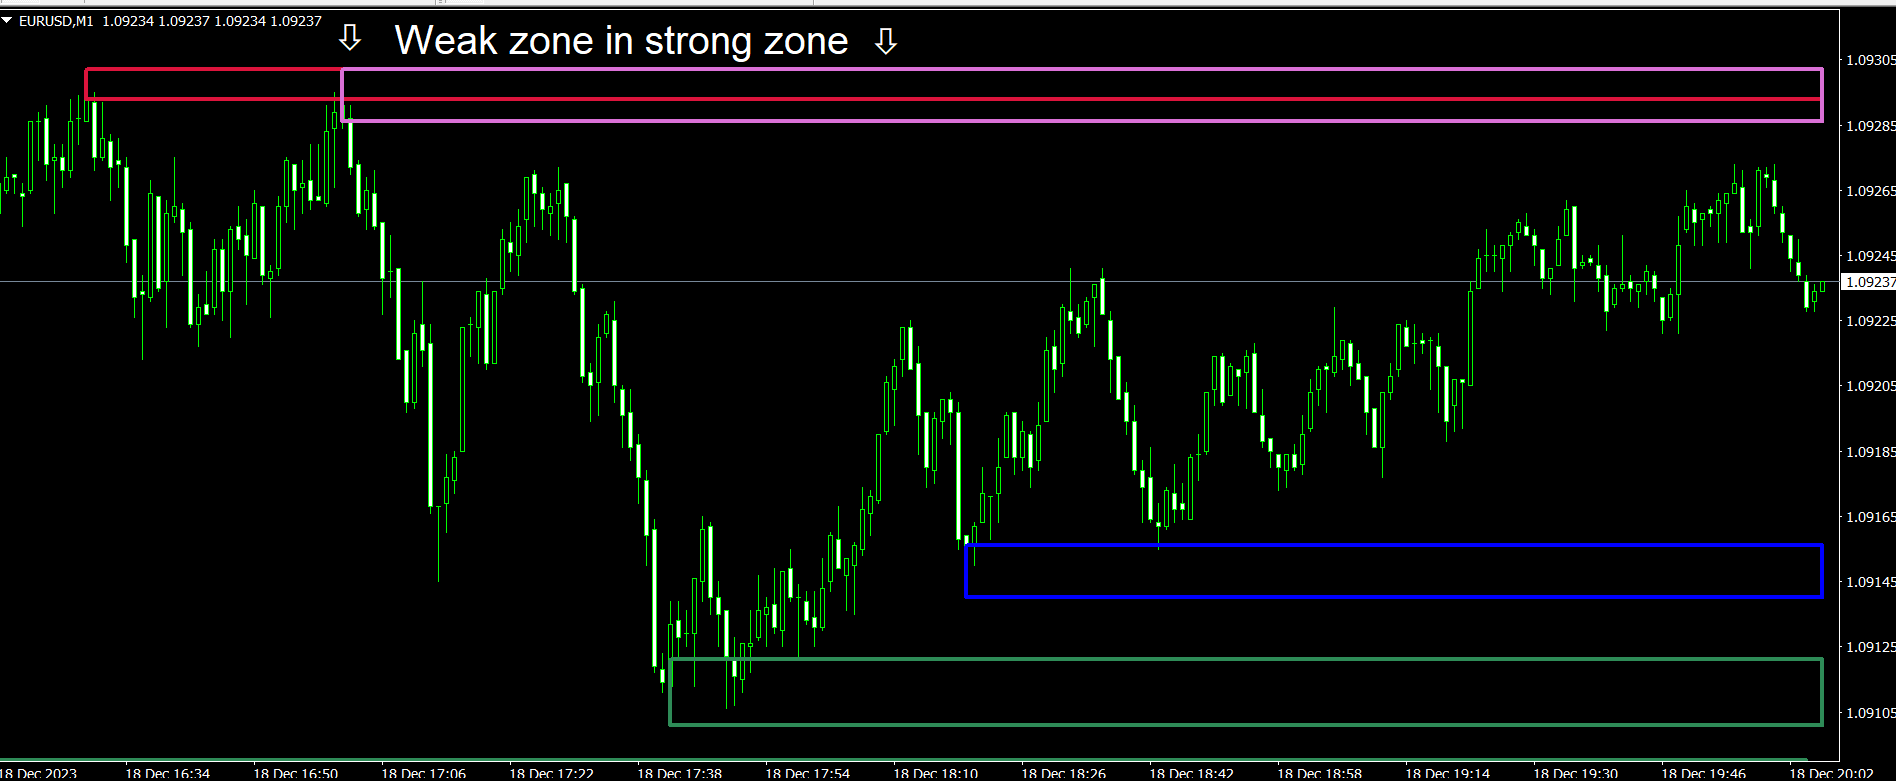
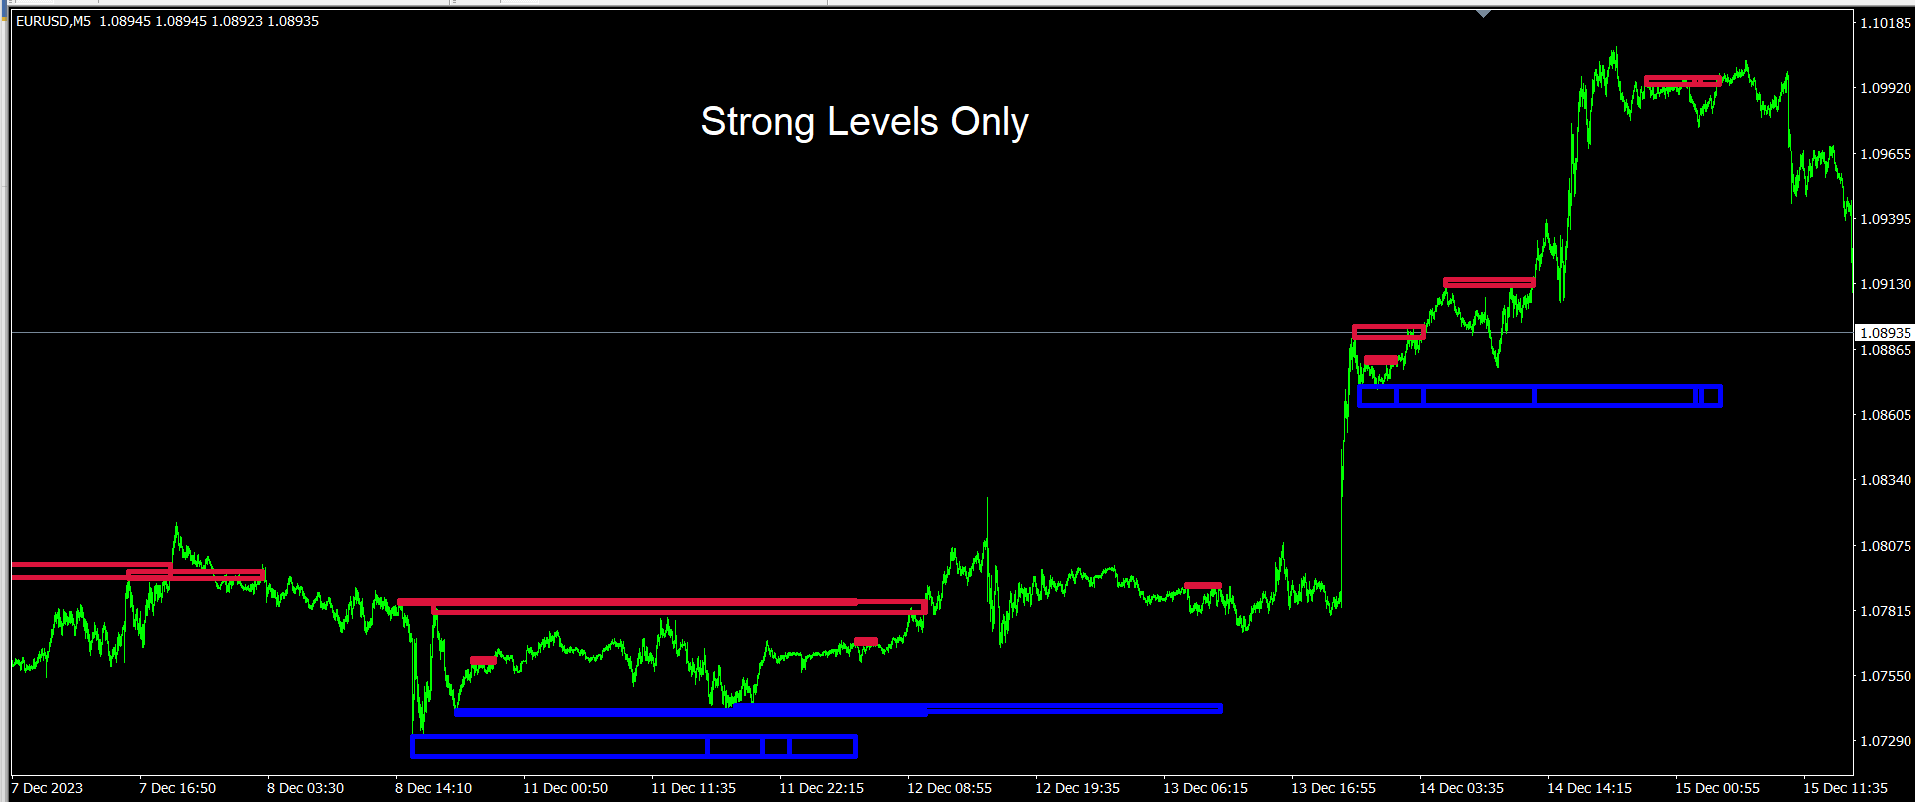
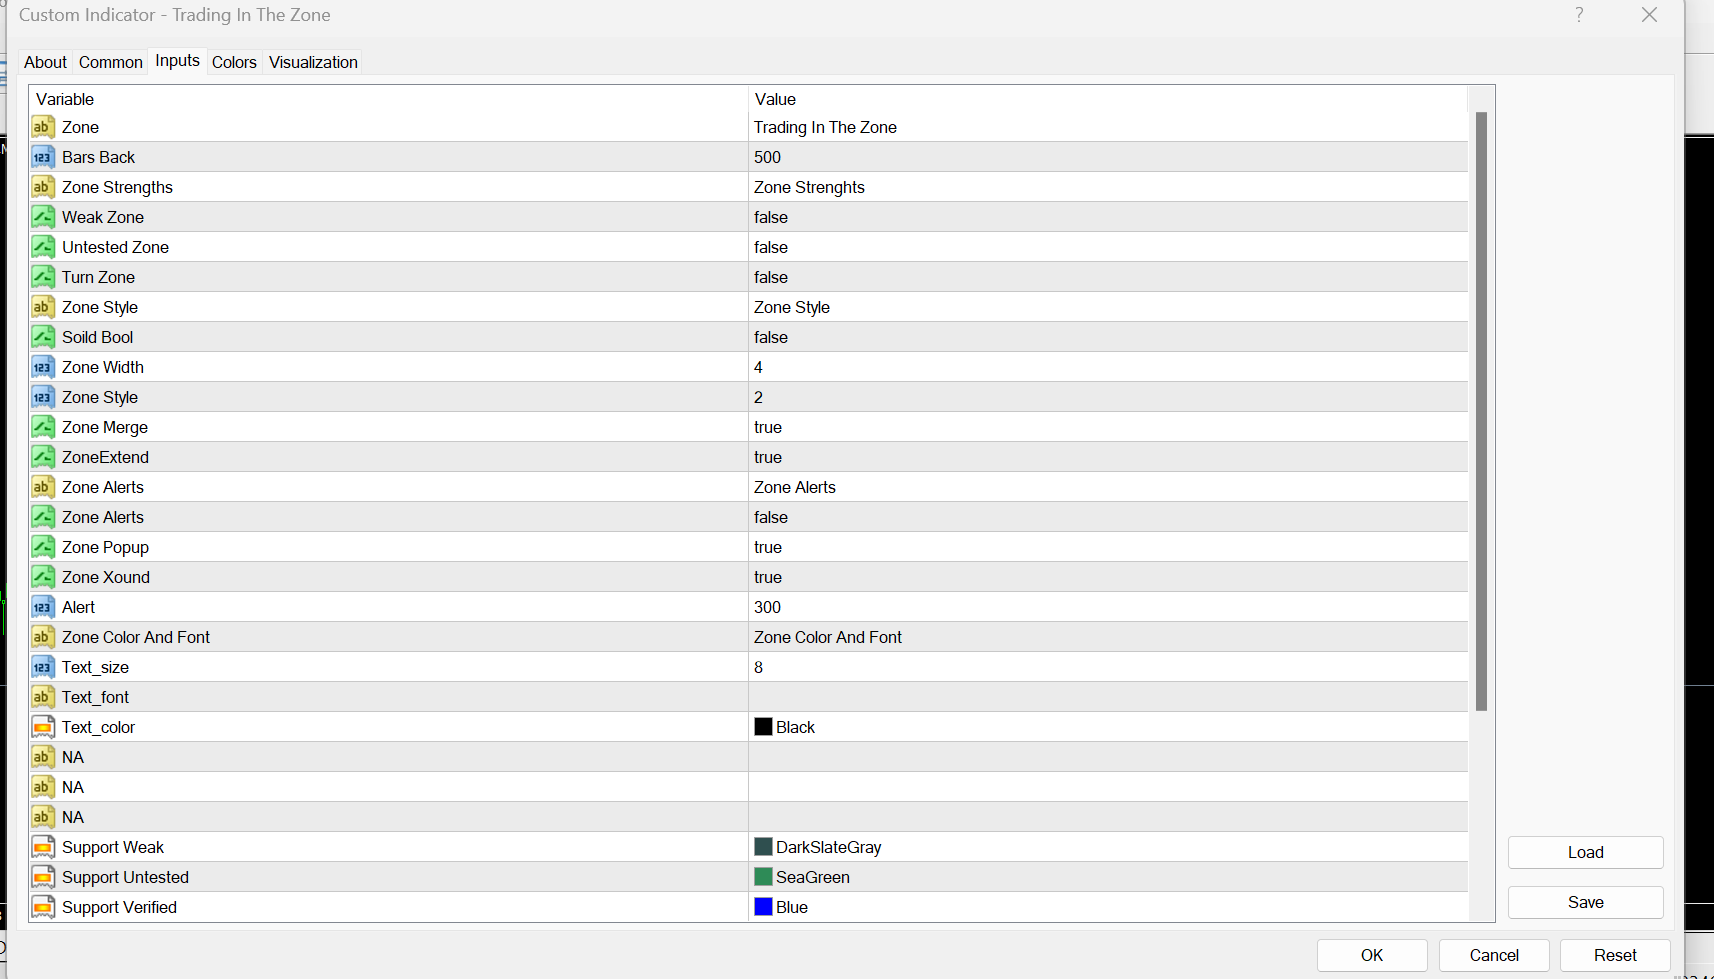
Il trading nella zona è un indicatore di domanda e offerta molto ricercato, rinomato per la sua efficacia nell'identificare le zone di trading chiave all'interno dei mercati finanziari. A differenza della versione originale di questo indicatore, che spesso presentava problemi con la ridipintura e la cancellazione delle zone precedentemente identificate, questa iterazione migliorata garantisce che le zone rimangano visibili attraverso i dati storici, offrendo ai trader un netto vantaggio nell'individuare livelli cruciali di supporto e resistenza.


La funzione primaria dell'indicatore ruota attorno al concetto di dinamica della domanda e dell'offerta all'interno del mercato. Identifica le aree in cui esiste uno squilibrio significativo tra la pressione di acquisto e quella di vendita, portando a potenziali punti di svolta o livelli di interesse per i trader. Evitando il problema comune della ridipintura, dove le zone precedentemente identificate svaniscono o si spostano, i trader possono fare affidamento sull'accuratezza storica dell'indicatore per prendere decisioni di trading informate.

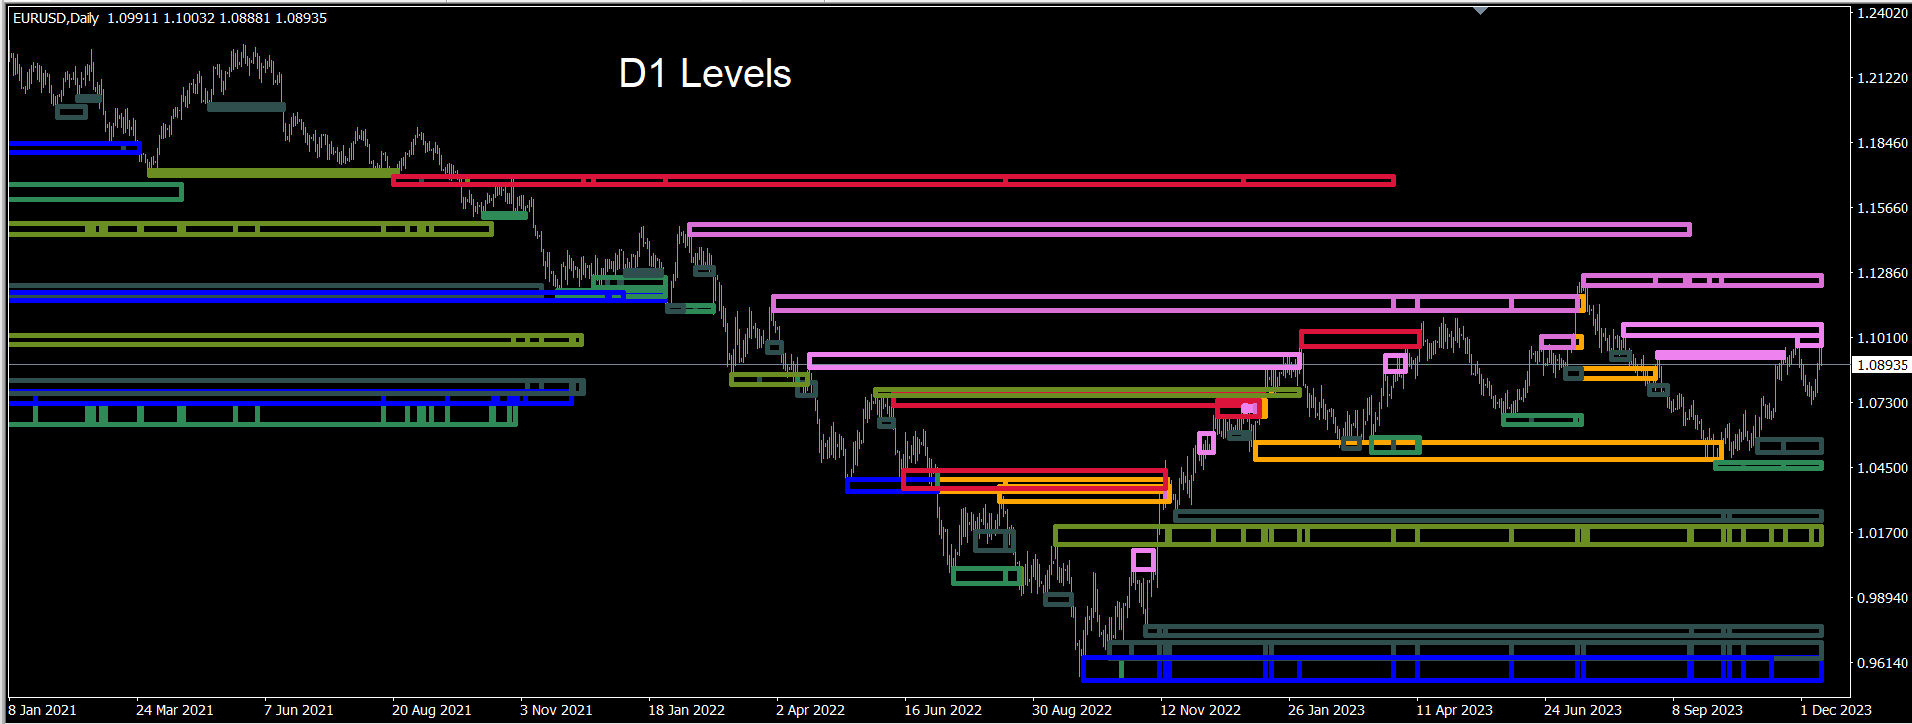
In sostanza, Trading in the Zone fornisce ai trader uno strumento prezioso per comprendere meglio il sentiment del mercato e anticipare potenziali movimenti dei prezzi. La sua capacità di mantenere l'integrità delle zone identificate attraverso i dati storici consente ai trader di sapere dove si sono verificati livelli di prezzo significativi in passato, facilitando strategie di entrata e uscita più precise.

Nel complesso, il Trading nella Zona è un potente indicatore di domanda e offerta che offre ai trader un netto vantaggio nell'affrontare le complessità dei mercati finanziari fornendo informazioni storiche accurate e affidabili sulla zona.
Prodotti consigliati
This is a new strategy for SUPPLY DEMAND areas It is based on a calculation using the tick volume to detect the big price action in market for both bear /bull actions this smart volume action candles are used to determine the supply and demand areas prices in between main supply and demand lines indicate sideway market  up arrows will be shown when prices moves above the main supply and the secondary supply lines Down arrows will be shown when prices moves below the main demand and the secondary
VR Cub
Vladimir Pastushak
VR Cub è un indicatore per ottenere punti di ingresso di alta qualità. L'indicatore è stato sviluppato per facilitare i calcoli matematici e semplificare la ricerca dei punti di ingresso in una posizione. La strategia di trading per la quale è stato scritto l'indicatore ha dimostrato la sua efficacia per molti anni. La semplicità della strategia di trading è il suo grande vantaggio, che consente anche ai trader alle prime armi di commerciare con successo con essa. VR Cub calcola i punti di apert
Master Scalping M1 è un indicatore innovativo che utilizza un algoritmo per determinare il trend in modo rapido e preciso. L'indicatore calcola il tempo di apertura e chiusura delle posizioni, gli algoritmi dell'indicatore consentono di trovare i momenti ideali per entrare in un trade (acquistare o vendere un asset), il che aumenta il successo delle transazioni per la maggior parte dei trader. Vantaggi dell'indicatore: Facile da usare, non sovraccarica il grafico con informazioni inutili. Può es
KT Renko Patterns MT4
KEENBASE SOFTWARE SOLUTIONS
2.33 (3)
KT Renko Patterns scans the Renko chart brick by brick to find some famous chart patterns that are frequently used by traders across the various financial markets. Compared to the time-based charts, patterns based trading is easier and more evident on Renko charts due to their uncluttered appearance. KT Renko Patterns features multiple Renko patterns, and many of these patterns are extensively explained in the book titled Profitable Trading with Renko Charts by Prashant Shah. A 100% automate
Check My Product Contact me to discover all my services  Supply and demand zones are one of the most basic things a beginner forex trader learns. These zones are so important, price reacts off of them even after years since they first developed. And with the supply and demand zones indicator, a forex trader might not need to worry about drawing all these historical zones one after the other. The supply and demand zone indicator accurately draws the supply and demand zones of a currency pair
Infinity Trend Pro
Yaroslav Varankin
1 (1)
This is a trend indicator without redrawing Developed instead of the binary options strategy (by the color of the Martingale candlestick) Also works well in forex trading When to open trades (binary options) A signal will appear in the place with a candle signaling the current candle It is recommended to open a deal for one candle of the current timeframe M1 and M5 When a blue dot appears, open a deal up When a red dot appears, open a trade down. How to open trades on Forex. When a signal is rec
Daily Candle Predictor è un indicatore che prevede il prezzo di chiusura di una candela. L'indicatore è destinato principalmente all'uso sui grafici D1. Questo indicatore è adatto sia per il trading forex tradizionale che per il trading di opzioni binarie. L'indicatore può essere utilizzato come sistema di trading autonomo o può fungere da aggiunta al sistema di trading esistente. Questo indicatore analizza la candela corrente, calcolando alcuni fattori di forza all'interno del corpo della cande
The indicator detects and displays 3 Drives harmonic pattern (see the screenshot). The pattern is plotted by the extreme values of the ZigZag indicator (included in the resources, no need to install). After detecting the pattern, the indicator notifies of that by a pop-up window, a mobile notification and an email. The indicator highlights the process of the pattern formation and not just the complete pattern. In the former case, it is displayed in the contour triangles. After the pattern is com
Indicator. "Indicator wave or Indicator Ma". Using 23 standard indicators and the author's algorithm, the levels of purchases (from 0 to +100) and sales (from 0 to -100) are calculated. Then, using the calculated levels, the "Wave Indicator" draws a wave with 21 moving averages. The wave number is equal to the averaging period of the calculated levels. Waves # 1 - 7 Fast Moving Averages Waves from No. 8 -14 moving averages Waves from No. 15-21 slow moving averages Looking at the figu
Owl smart levels
Sergey Ermolov
4.63 (54)
Versione MT5  |  FAQ L' indicatore Owl Smart Levels   è un sistema di trading completo all'interno dell'unico indicatore che include strumenti di analisi di mercato popolari come i   frattali avanzati di Bill Williams , Valable ZigZag che costruisce   la corretta struttura a onde   del mercato, e i   livelli di Fibonacci che segnano i livelli esatti di entrata nel mercato e luoghi per prendere profitti. Descrizione dettagliata della strategia Istruzioni per lavorare con l'indicatore Consulente-
Professional forex expert   Black Angel   (for EURUSD, GBPUSD pairs) alyzing the market using the Elliot Wave Index. Elliott wave theory is the interpretation of processes in financial markets through a system of visual models (waves) on price charts. The author of the theory, Ralph Elliott, identified eight variants of alternating waves (of which five are in the trend and three are against the trend). The movement of prices in the markets takes the form of five waves. Three of them (1, 3, 5)
TWO PAIRS SQUARE HEDGE METER INDICATOR Try this brilliant 2 pairs square indicator It draws a square wave of the relation between your two inputs symbols when square wave indicates -1 then it is very great opportunity to SELL pair1 and BUY Pair2 when square wave indicates +1 then it is very great opportunity to BUY pair1 and SELL Pair2 the inputs are : 2 pairs of symbols         then index value : i use 20 for M30 charts ( you can try other values : 40/50 for M15 , : 30 for M30 , : 10 for H1 ,
Trendiness Index
Libertas LLC
5 (3)
"The trend is your friend" is one of the best known sayings in investing, because capturing large trendy price movements can be extremely profitable. However, trading with the trend is often easier said than done, because many indicators are based on price reversals not trends. These aren't very effective at identifying trendy periods, or predicting whether trends will continue. We developed the Trendiness Index to help address this problem by indicating the strength and direction of price trend
Rait Patterns
Tatiana Zvereva
Современный индикатор паттернов PPR по торговой стратегии RAIT. Работает по тренду и без него. Имеет настройки таймфрейма для отображения. Можно настроить количество баров для отображения индикатора на графике. Используется несколько паттернов PPR. Индикатор предпочтительно использовать на часовом таймфрейме и выше, но работает и ниже . Паттерны:  PPR, PinPPR, OutPPR. Отображаются одной стрелкой.
The indicator places Semaphore points on the maximum and minimum of a higher, medium and lower period. It includes A,B,C Triangles for easier spotting of reversal chart pattern which occurs very frequently and has a very high success ratio. Both Semaphore and A,B,C Triangles have Alerts and Push notifications to a mobile device when they occur on the chart. These indicators are very useful for breakout trading and spotting support/resistance levels which gives good opportunities for positions.
Fractals AM
Andriy Matviyevs'kyy
Classic indicator. The Fractals indicator analyzes the price patterns that form on the candlestick chart and display the reversal points of the market trend. The indicator consists of candles, the middle of which is either the highest (up fractal) or the lowest (down fractal). Highs and lows, indicated by the indicator on the chart, are recommended to be taken as points that form support and resistance lines. Unlike the original indicator, where fractals are formed by five candles (high/low in t
FREE
Trend Ray
Andriy Sydoruk
The indicator shows the potential trend direction by cyclical-wave dependence. Thus, all the rays of the intersection will be optimal rays, in the direction of which the price is expected to move, taking into account the indicator period. Rays can be used as a direction for potential market movement. But we must not forget that the approach must be comprehensive, the indicator signals require additional information to enter the market.
The BuySellAlert arrow indicator is developed based on the use of HMA, Laguerre, CCI, and ATR . The BuySellAlert arrow indicator: generates  entry points  for BUY and SELL  displays current profit ; displays  current spread. The profitability of the indicator is shown in the screenshot on the example of the GBPUSD pair Does not redraw and works on opening bar. Time frames - M1-M30. Recommended Time frames M5-M15. Setting ALARM - enable/disable the alarm; Push    - enable/disable Push notificatio
Fulltrend
Thomas Bradley Butler
Improve trading with this indicator.  Find areas of buys or sells in Fibonacci retracement areas.  Fulltrend is for scalping and making swing trades.  Fib levels are added for take profits and stop losses. This works on any time frame and can be used by itself or together with other systems and indicators for filters. The indicator doesn't repaint.  Alerts are added and can be true or false.  No need to sit glued to the computer, just set on charts and listen or the alerts to come.  Take a pos
Noize Absorption Index MT4
Ekaterina Saltykova
5 (1)
Noize Absorption Index - is the manual trading system that measures the difference of pressure between bears forces and bulls forces. Green line - is a noize free index that showing curent situation. Zero value of index shows totally choppy/flat market.Values above zero level shows how powerfull bullish wave is and values below zero measures bearish forces.Up arrow appears on bearish market when it's ready to reverse, dn arrow appears on weak bullish market, as a result of reverse expectation. S
This indicator monitors the market for a flat state and possible breakout. The flat state is detected as a predefined number of consecutive bars during which price fluctuates inside a small range. If one of the next bars closes outside the range, breakout is signaled. The indicator shows 3 lines: blue - upper bound of flat ranges AND consecutive breakout areas; red - lower bound of flat ranges AND consecutive breakout areas; yellow - center of flat ranges (NOT including breakout areas). When a b
The indicator is designed to detect breakouts of the Bill Williams fractal level on the instrument chart in the MetaTrader 4. After installing the indicator on the instrument chart, when a breakdown of the Bill Williams fractal level occurs, the signal bar (candle) is marked with a colored pointer (arrow) in the direction of the breakdown. For greater clarity, you can add a standard indicator "Bill Williams Fractal" to the chart of the instrument. When adding the indicator to the instrume
The principle of this indicator is very simple: detecting the trend with Moving Average, then monitoring the return point of graph by using the crossing of Stochastic Oscillator and finally predicting BUY and SELL signal with arrows, alerts and notifications. The parameters are fixed and automatically calculated on each time frame. Example: If you install indicator on EURUSD, timeframe M5: the indicator will detect the main trend with the Moving Average on this timeframe (for example the Moving
A machine translation from the English product description was used. We apologize for possible imprecisions. È stata utilizzata una traduzione automatica dalla descrizione del prodotto in inglese. Ci scusiamo per eventuali imprecisioni. Un sistema di visualizzazione per i modelli di azione dei prezzi dei candelieri preferiti. Una volta collegato, l'indicatore segnerà automaticamente i modelli successivi sul grafico: Pinocchio bar  - un bar piccolo corpo con un lungo "naso", molto noto motivo inv
Trend Bilio - an arrow indicator without redrawing shows potential market entry points in the form of arrows of the corresponding color: upward red arrows suggest opening a buy, green down arrows - selling. The entrance is supposed to be at the next bar after the pointer. The arrow indicator Trend Bilio visually "unloads" the price chart and saves time for analysis: no signal - no deal, if an opposite signal appears, then the current deal should be closed. It is Trend Bilio that is considered
This indicator finds technical analysis reversal patterns such as Double Bottom, Triple Bottom, Head & Shoulders and their opposite counterparts. The indicator shows them on the chart of a currency pair and can signal a trader if a pattern has been formed recently. This allows you to quickly detect a possible trend reversal or correction, it is enough to add an indicator to the chart, after that, you can change different timeframes to quickly find such patterns, if the patterns are not located
Cosmic Diviner X Planet
Olena Kondratenko
4 (2)
This unique multi-currency strategy simultaneously determines the strength of trends and market entry points, visualizing this using histograms on the chart. The indicator is optimally adapted for trading on the timeframes М5, М15, М30, Н1. For the convenience of users, the indicator renders the entry point (in the form of an arrow), recommended take profit levels (TP1, TP2 with text labels) and the recommended Stop Loss level. The take profit levels (TP1, TP2) are automatically calculated for
Gold Phoenix
Yaroslav Varankin
The perfect tool for Scalng in the Forex markets You can trade both from signal to signal and using take profit  The algorithm does not use Zigzag!  No redrawing!  This is a channel instrument that uses a moving average as a filter. Moving Average  There are 2 parameters for the settings Ma Period = 5 period Moving Average  Channel 1.0 distance of channel lines from the chart Price Signal Filter - calculation of signal opening and filter There is a complete set of Alert There is a multi-timefram
Smoking
Nadiya Mirosh
I suggest that everyone who is interested in the Smoking indicator try to trade. Smoking is a technical analysis tool that uses mathematical calculations to determine various aspects of price movement and is based on historical data. Smoking reveals special aspects of price movement and allows traders to make the right decision. All trading indicators analyze the price from different angles based on historical data. Therefore, it is not entirely correct to say that they can predict the future
RenkoMaStoch
Sergey Deev
1 (1)
The indicator displays renko bars on a chart, uses them to plot the fast and slow moving average and Stochastic, as well as it provides buy/sell signals: a buy signal is generated when the fast moving is above the slow one, and the signal line of Stochastic crosses the lower level from bottom up; a sell signal is generated when the fast moving is below the slow one, and the signal line of Stochastic crosses the upper level from top to bottom; Renko is a non-trivial price display method. Instead
Gli utenti di questo prodotto hanno anche acquistato
Gann Made Easy
Oleg Rodin
4.92 (62)
Gann Made Easy è un sistema di trading Forex professionale e facile da usare che si basa sui migliori principi del trading utilizzando la teoria di mr. WD Gann. L'indicatore fornisce segnali ACQUISTA e VENDI accurati, inclusi i livelli di Stop Loss e Take Profit. Puoi fare trading anche in movimento utilizzando le notifiche PUSH. Vi prego di contattarmi dopo l'acquisto! Condividerò i miei consigli di trading con te e fantastici indicatori bonus gratuitamente! Probabilmente hai già sentito parlar
ATTUALMENTE SCONTATO DEL 26% La soluzione migliore per ogni principiante o trader esperto! Questo indicatore è uno strumento di trading unico, di alta qualità e conveniente perché abbiamo incorporato una serie di caratteristiche proprietarie e una nuova formula. Con un solo grafico è possibile leggere la forza delle valute per 28 coppie Forex! Immaginate come migliorerà il vostro trading perché sarete in grado di individuare l'esatto punto di innesco di una nuova tendenza o di un'opportunit
Atomic Analyst
Issam Kassas
5 (3)
Innanzitutto, vale la pena sottolineare che questo indicatore di trading non è repaint, non è ridisegno e non presenta ritardi, il che lo rende ideale sia per il trading manuale che per quello automatico. Manuale utente: impostazioni, input e strategia. L'Analista Atomico è un indicatore di azione del prezzo PA che utilizza la forza e il momentum del prezzo per trovare un miglior vantaggio sul mercato. Dotato di filtri avanzati che aiutano a rimuovere rumori e segnali falsi, e aumentare il pote
TPSproTREND PrO
Roman Podpora
5 (15)
TPSpro TRENDPRO  - is a trend indicator that automatically analyzes the market and provides information about the trend and each of its changes, as well as giving signals for entering trades without redrawing! The indicator uses each candle, analyzing them separately. referring to different impulses - up or down impulse. Exact entry points into transactions for currencies, crypto, metals, stocks, indices!  -  Version MT5               DETAILED DESCRIPTION        /       TRADING SETUPS           
Advanced Supply Demand
Bernhard Schweigert
4.92 (310)
CURRENTLY 26% OFF !! Best Solution for any Newbie or Expert Trader! This indicator is a unique, high quality and affordable trading tool because we have incorporated a number of proprietary features and a new formula. With this update, you will be able to show double timeframe zones. You will not only be able to show a higher TF but to show both, the chart TF, PLUS the higher TF: SHOWING NESTED ZONES. All Supply Demand traders will love it. :) Important Information Revealed Maximize the potenti
TPSpro RFI Levels
Roman Podpora
5 (13)
A key element in trading is zones or levels from which decisions to buy or sell a trading instrument are made. Despite attempts by major players to conceal their presence in the market, they inevitably leave traces. Our task was to learn how to identify these traces and interpret them correctly. Reversal First Impulse levels (RFI)   -  Version MT5                INSTRUCTIONS                 RUS                 ENG                                       R ecommended to use with an indicator   -  
ON Trade Optuma Astro
Abdullah Alrai
5 (4)
Presentazione dell'Indicatore Astronomico per MT4: Il tuo compagno di trading celeste definitivo Sei pronto a elevare la tua esperienza di trading a livelli celesti? Non cercare oltre, il nostro rivoluzionario Indicatore Astronomico per MT4 è qui. Questo strumento innovativo va oltre gli indicatori di trading tradizionali, sfruttando algoritmi complessi per offrirti intuizioni astronomiche senza pari e calcoli di precisione. Un universo di informazioni a portata di mano: Ammira un pannello compl
Scopri il segreto per il trading Forex di successo con il nostro indicatore MT4 personalizzato! Ti sei mai chiesto come raggiungere il successo nel mercato Forex, guadagnando costantemente profitti minimizzando il rischio? Ecco la risposta che hai cercato! Permettici di presentare il nostro indicatore MT4 proprietario che rivoluzionerà il tuo approccio al trading. Versatilità unica Il nostro indicatore è appositamente progettato per gli utenti che preferiscono le formazioni di candele Ren
Presentazione       Quantum Trend Sniper Indicator   , l'innovativo indicatore MQL5 che sta trasformando il modo in cui identifichi e scambi le inversioni di tendenza! Sviluppato da un team di trader esperti con un'esperienza di trading di oltre 13 anni,       Indicatore Quantum Trend Sniper       è progettato per spingere il tuo viaggio di trading verso nuove vette con il suo modo innovativo di identificare le inversioni di tendenza con una precisione estremamente elevata. *** Acquista Quant
Break and Retest
Mohamed Hassan
4.56 (9)
‍You can visually backtest Break & Retest to see how it behaved in the past!     Manual guide:   Click here $65  for only 1  copy left! Next price is $120 .  This Indicator only places quality trades when the market is really in your favor with a clear break and retest. Patience is key with this price action strategy! Recommended timeframes: M1 for Scalpers.  M15 for Intraday traders. H1 & H4 for Day traders. Other timeframes are also excellent! After many months of hard w
Vi presentiamo ON Trade Waves Patterns Harmonic Elliot Wolfe, un indicatore avanzato progettato per rilevare vari tipi di pattern sul mercato utilizzando metodi sia manuali che automatici. Ecco come funziona: Pattern Armonici: Questo indicatore è in grado di individuare pattern armonici che appaiono sul vostro grafico. Questi pattern sono fondamentali per i trader che praticano la teoria del trading armonico, come descritta nel libro di Scott Carney "Harmonic Trading vol 1 & 2". Che li disegniat
Trend Screener
STE S.S.COMPANY
4.83 (88)
Indicatore di tendenza, soluzione unica rivoluzionaria per il trading di tendenze e il filtraggio con tutte le importanti funzionalità di tendenza integrate in un unico strumento! È un indicatore multi-timeframe e multi-valuta al 100% non ridipingibile che può essere utilizzato su tutti i simboli/strumenti: forex, materie prime, criptovalute, indici e azioni. Trend Screener è un indicatore di tendenza che segue un indicatore efficiente che fornisce segnali di tendenza a freccia con punti nel gra
74% discount for the next 10 buyers (original price $605): 2 left 3 Indicators in 1 indicator Strategy based on price action Made specifically for the best forex currency pairs Can be used in the best time frame of the market at a very reasonable price This indicator is basically 3 different indicatos . But we have combined these 3 indicators in 1 indicator so that you can use 3 indicators at the lowest price. All three strategies are based on price action. But based on different trends.
Currency Strength Wizard è un indicatore molto potente che ti fornisce una soluzione all-in-one per un trading di successo. L'indicatore calcola la potenza di questa o quella coppia forex utilizzando i dati di tutte le valute su più intervalli di tempo. Questi dati sono rappresentati in una forma di indice di valuta facile da usare e linee elettriche di valuta che puoi utilizzare per vedere il potere di questa o quella valuta. Tutto ciò di cui hai bisogno è collegare l'indicatore al grafico che
on free demo press zoom out button to see back.. cnt number is bar numbers.you can change up to 3000 related to chart bars numbers. minimum value is 500. there is g value set to 1.01. no need to change it. this indicator almost grail,no repaint and all pairs ,all timeframe indicator. there is red and blue histograms. if gold x sign comes on red histogram that is sell signal. if blue x sign comes on blue histogram that is buy signal. this indicator on thise version works all pairs.al timeframes
FX Power MT4 NG
Daniel Stein
5 (9)
Ricevi il tuo aggiornamento quotidiano sul mercato con dettagli e schermate tramite il nostro Morning Briefing qui su mql5 e su Telegram ! FX Power MT4 NG è la nuova generazione del nostro popolare misuratore di forza delle valute, FX Power. Cosa offre questo misuratore di forza di nuova generazione? Tutto ciò che avete amato dell'FX Power originale IN PIÙ Analisi della forza di ORO/XAU Risultati di calcolo ancora più precisi Periodi di analisi configurabili individualmente Limite di calcolo pe
Innanzitutto, vale la pena sottolineare che questo Strumento di Trading è un Indicatore Non-Ridipingente, Non-Ridisegnante e Non-Laggante, il che lo rende ideale per il trading professionale. Corso online, manuale utente e demo. L'Indicatore Smart Price Action Concepts è uno strumento molto potente sia per i nuovi che per i trader esperti. Racchiude più di 20 utili indicatori in uno solo, combinando idee di trading avanzate come l'Analisi del Trader del Circolo Interno e le Strategie di Trading
Scalper Vault
Oleg Rodin
5 (28)
Scalper Vault è un sistema di scalping professionale che ti fornisce tutto il necessario per scalping di successo. Questo indicatore è un sistema di trading completo che può essere utilizzato dai trader di forex e opzioni binarie. L'intervallo di tempo consigliato è M5. Il sistema fornisce segnali di freccia accurati nella direzione della tendenza. Ti fornisce anche i segnali più alti e più bassi e i livelli di mercato di Gann. Gli indicatori forniscono tutti i tipi di avvisi, comprese le notifi
Advanced Currency IMPULSE with ALERT
Bernhard Schweigert
4.91 (494)
ATTUALMENTE SCONTATO DEL 31%! La soluzione migliore per ogni principiante o trader esperto! Questo indicatore è uno strumento di trading unico, di alta qualità e conveniente perché abbiamo incorporato una serie di caratteristiche proprietarie e una formula segreta. Con un solo grafico fornisce avvisi per tutte le 28 coppie di valute. Immaginate come migliorerà il vostro trading perché sarete in grado di individuare l'esatto punto di innesco di una nuova tendenza o opportunità di scalping!
Shepherd Harmonic Pattern
Abdullah Alrai
4.68 (59)
Questo indicatore rileverà modelli armonici disegnati sul grafico mediante metodi manuali e automatici. Puoi consultare il manuale dell'utente tramite questo link: Aggiungi la tua recensione e contattaci per ottenerlo. C'è una versione gratuita per provare questo prodotto su MT4. Puoi usarlo per rilevare i modelli di Gartley e Nenstar: https://www.mql5.com/en/market/product/30181 Puoi acquistare la versione completa di MT4 da: https://www.mql5.com/en/market/product/15212 Note L'indicatore ha un
Market Reversal Alerts
LEE SAMSON
4.21 (121)
Il profitto dalla struttura del mercato cambia quando il prezzo si inverte e si ritira. L'indicatore di avviso di inversione della struttura del mercato identifica quando una tendenza o un movimento di prezzo si sta avvicinando all'esaurimento e pronto a invertire. Ti avvisa dei cambiamenti nella struttura del mercato che in genere si verificano quando stanno per verificarsi un'inversione o un forte pullback. L'indicatore identifica inizialmente i breakout e lo slancio del prezzo, ogni volta
PRO Renko System
Oleg Rodin
5 (25)
PRO Renko System è un sistema di trading altamente accurato appositamente progettato per il trading di grafici RENKO. Questo è un sistema universale che può essere applicato a vari strumenti di trading. Il sistema neutralizza efficacemente il cosiddetto rumore di mercato che consente di accedere a segnali di inversione accurati. L'indicatore è molto facile da usare e ha un solo parametro responsabile della generazione del segnale. Puoi facilmente adattare lo strumento a qualsiasi strumento
Attualmente 20% di sconto! La soluzione migliore per ogni principiante o trader esperto! Questo software per cruscotti funziona su 28 coppie di valute. Si basa su 2 dei nostri indicatori principali (Advanced Currency Strength 28 e Advanced Currency Impulse). Offre un'ottima panoramica dell'intero mercato Forex. Mostra i valori di forza delle valute avanzate, la velocità di movimento delle valute e i segnali per 28 coppie Forex in tutti i (9) timeframe. Immaginate come migliorerà il vostro t
Symbols must be separated by commas (,) and entered into the parameters exactly as displayed by your broker to ensure they are recognized in the dashboard. These symbols will be used for analysis by the indicator. With one click open any pair any timeframe directly from dashboard The MA Speedometer Dashboard is a highly functional MetaTrader 4 (MT4) indicator designed to enhance trading strategies through dynamic market analysis. It offers robust features for identifying market trends, trading
TrendMaestro
Stefano Frisetti
5 (2)
nota: questo indicatore e' per METATRADER4, se vuoi la versione per  METATRADER5 questo e' il link:  https://www.mql5.com/it/market/product/108123 TRENDMAESTRO ver 2.4 TRENDMAESTRO riconosce un nuovo TREND sul nascere, non sbaglia mai. La sicurezza di identificare un nuovo TREND non ha prezzo. DESCRIZIONE TRENDMAESTRO identifica un nuovo TREND sul nascere, questo indicatore prende in esame la volatilita' i volumi ed il momentum per identificare il momento in cui c'e' un'esplosione di uno 
Entry Points Pro
Yury Orlov
4.7 (225)
Indicatore top per MT5 che fornisce segnali accurati per entrare in un trade senza riverniciare! Può essere applicato a qualsiasi attività finanziaria: forex, criptovalute, metalli, azioni, indici.  La versione MT5 è qui Fornirà segnali di trading piuttosto precisi e ti dirà quando è meglio aprire un trade e chiuderlo. Guarda il video (6:22) con un esempio di elaborazione di un solo segnale che ha ripagato l'indicatore! La maggior parte dei trader migliora i propri risultati di trading
IX Power MT4
Daniel Stein
5 (5)
IX Power porta finalmente l'imbattibile precisione di FX Power ai simboli non-Forex. Determina con precisione l'intensità delle tendenze a breve, medio e lungo termine dei vostri indici preferiti, azioni, materie prime, ETF e persino criptovalute. Potete analizzare tutto ciò che il vostro terminale ha da offrire. Provatelo e sperimentate come il vostro tempismo migliori significativamente durante il trading. Caratteristiche principali di IX Power Risultati di calcolo precisi al 100% e n
The 1 2 3 Pattern Scanner
Reza Aghajanpour
4.79 (56)
** All Symbols x All Timeframes scan just by pressing scanner button ** After 17 years of experience in the markets and 3 years of programming, Winner indicator is ready. I would like to share with you! *** Contact me after purchase to send you instructions and add you in "123 scanner group" for sharing or seeing experiences with other users. Introduction The 123 Pattern Scanner indicator with a special enhanced algorithm is a very repetitive common pattern finder with a high success rate . Inte
Trend Forecasting
Mohamed Hassan
5 (20)
This indicator is unstoppable when combined with our other indicator called Katana. After purchase, send us a message and you could get Katana for FREE as a BONUS After purchase, send us a private message for your instructions.  MT5 version: click here 3 copies left available at $45. Next price is $95. Don't miss this great deal!  The Trend Forecasting indicator is a very unique & easy tool that is able to make prediction about future price movement based on the signals generated
Up down v6T
Guner Koca
5 (1)
Thise indicator is up down v6  comes with tradingwiev pinescript. purchased people, after installed on terminal ,contact me on mql5  to get BONUS  TradingView pinescript. up-down indicator is no repaint and works all pairs and lower than weekly time frames charts. it is suitable also 1 m charts for all pairs. and hold long way to signal. dont gives too many signals. when red histogram cross trigger line that is up signal.and price probably will down when blue histogram cross trigger line that
Altri dall’autore
HFTHackerMT5
Thomas Bradley Butler
5 (1)
Segnale: collegamento HFT Hacker sul mio profilo *OTTIMIZZA EA PRIMA DEL TEST E DELL'UTILIZZO. ACQUISTA SOLO SE HAI OTTIMIZZATO. Questo è per i trader che sanno come ottimizzare e vogliono essere redditizi in base ai propri meriti. IMPOSTA I TUOI PARAMETRI DI RISCHIO. Tasso di vincita elevato con interruzioni per le operazioni che non funzionano se lo desideri. Ridurre il rischio per la longevità. Funziona su tutti gli account ed è uno strumento di gestione del rischio, LEGGI tutti i commenti, l
Pin Bar Scalper
Thomas Bradley Butler
OPTMIZE EA BEFORE BACKTEST AND USE. Pin Bar Scalper scalps pin bars and momentum on 5 minute charts on the EUR/USD.  Optimize the parameters to get the best  out of the EA.  Pin bars are popular candlesticks that show that the price has been taken over by the bulls or bears. The inputs are based around the size of the pin bars in %, which are 3 different ones.  Wicks and body are the calculations within the parameter.  Test file in comments for example only.  Trade the dates _
NeuroScalper
Thomas Bradley Butler
5 (2)
Aggiornare! Le frecce sono state aggiunte ai livelli 100 e 200. Questo indicatore è accurato per l'accesso agli estremi e ai supporti per le posizioni di acquisto principalmente per intervalli di tempo di 1 minuto. È possibile utilizzare altri intervalli di tempo, ma i livelli sono diversi. È un oscillatore migliore e si confronta con gli altri per vedere la differenza. Commercio diurno utilizzando concetti di rete neuro. Questo indicatore utilizza forme elementari di reti neuronali per ge
Evolved Trends
Thomas Bradley Butler
OTTIMIZZARE PRIMA DEL TEST E UTILIZZARE PER TROVARE I MIGLIORI INPUT Ehi, commercianti! Vuoi un Expert Advisor all'avanguardia per la tua piattaforma MT4? Non guardare oltre le tendenze evolute! Questo potente algoritmo di trading, creato con la tecnologia di apprendimento automatico, si concentra sul trading di GBP/USD su intervalli di tempo di 1 ora. Ma ehi, sentiti libero di sperimentare altre risorse e intervalli di tempo per l'ottimizzazione! Basta personalizzare gli input in modo che co
VolumeDayTrader
Thomas Bradley Butler
DAYTRADING solo per AZIONI (CFD). Il trading richiede lavoro. Non ci sono scorciatoie o indicatori che ti diranno tutte le entrate e le uscite. Il profitto viene dallo stato d'animo. Gli indicatori sono strumenti da utilizzare insieme alla gestione del denaro e alla psicologia del successo. Trova gli squilibri nel profilo del volume. Squilibri di volume dei prezzi commerciali. Molti squilibri si verificano in chiusura e apertura e notizie. Guarda gli acquirenti rispetto ai venditori nelle a
Crypto Net
Thomas Bradley Butler
I tempi del broker saranno diversi da quelli in cui è stata costruita la strategia. Crypto Net è per il trading di BTCUSD . Usa l'evoluzione genetica per evolvere la strategia. Questa tendenza degli scambi EA che segue gli indicatori si trovano ATR e Ichimoku. Questo è stato costruito e ha superato una serie di solidi test tra cui Monte Carlo e Walk Forward. Ingressi: Percentuale di conto che rappresenta il rischio minimo. Numero massimo di lotti Tempi per smettere di fare trading N
Bitcoin M5
Thomas Bradley Butler
OPTIMIZE EA BEFORE TEST AND USE. Bitcoin M5 is for trading BTC/USD on 5 min charts.  SL and TP should Start with 50000.  OPTIMIZE BEFORE USE The trading strategy uses Bollinger Bands and Envelopes indicators to trade from.  Trading to catch some breakout points of where the price breaches the bands and then exiting when the price crosses the envelopes.  Every trade uses a fixed lot amount and has a SL and TP.  The EA does not use martingale or hedging in the logic.
ForexReversal
Thomas Bradley Butler
4 (1)
La pazienza è la chiave per uno scalping senza stress. Scambia le frecce quando vedi che supera la media mobile di 200 e fai una tendenza allargando o dall'ultimo punto di oscillazione senza alcun filtro per la media mobile. Bello per intervalli di tempo di 1 minuto, catturando lo slancio delle mosse intraday. Prendi 20 pip con facilità o rimani più a lungo per le tendenze più grandi, utilizzando i trailing stop. Guarda gli esempi nelle foto di operazioni davvero grandi da questo indicatore. I
Level 2 Trading
Thomas Bradley Butler
COMBINABILE CON IL TRACKER INTELLIGENTE DEL VOLUME: https://www.mql5.com/en/market/product/116650 COMBINA CON LA TABELLA DELL'IMPRONTA: https://www.mql5.com/en/market/product/94153 COMBINATO CON IL COMMERCIO NELLA ZONA: https://www.mql5.com/en/market/product/110194 COMBINA CON VOLUM DAY TRADER: h https://www.mql5.com/en/market/product/72498 ABBINABILE AL LIBRO ORDINI: https://www.mql5.com/en/market/product/102247 Il Trading di Livello 2 è un indicatore che ti aiuta a visualizzare i vo
GoldBuyBackScalper
Thomas Bradley Butler
4 (1)
Questo indicatore è per XAU/USD, solo grafici a 1 minuto. Ogni coppia ha caratteristiche e movimenti di prezzo unici. Scambia inversioni a forma di V con questo indicatore. Acquisti del cuoio capelluto utilizzando i trailing stop ed evita le notizie in quanto sono più estremi e possono causare vendite improvvise. Allega un intervallo di tempo di 1 minuto nel backtest e guarda gli acquisti di inversione. L'indicatore non ridipinge né ricalcola mai. COMMERCIO SOLO DURANTE L'ORARIO ATTIV
TrueSupplyandDemand
Thomas Bradley Butler
This is based on short term strength or weakness and not on moving averages.  Moving averages are used for filter only. Trade supply and demand with arrows. Supply and demand breakouts and strength of the buyers or sellers .  Don't trade buy arrow to sell arrow.  Trade the strength with trendlines or moving averages and use stops.  The arrow can have some strong moves.  Trade on all time frames.  Try it out in the back tester. The pips can be made with this indicator, follow the arrows and mak
ScalpingMaster
Thomas Bradley Butler
Master scalping with this indicator.  Trade on any time frame for scalps on buy or sells.  Follow trends using a 200 moving average and stops and targets.  Use with your own system.  This indicator can give pips if following it correctly.  Stick to rules and pick up pips daily.  Use as entries in a trend, scalp for a few pips or exit on opposite signal.  Best to follow higher time frame trends. Indicator doesn't repaint or recalculate. Rules: Don't trade overnight, only trade during active sessi
DayTradeKing
Thomas Bradley Butler
This indicator is good for small time frames like 1 and 5 minutes and made for day trading. The indicator never repaints or recalculates. The indicator works is for trading swing points in day trading, following bulls or bears.  Its a simple to use, non cluttered indicator with a high success rate.  This indicator works well to capture ranges.  All indicators come with limitations and no indicator or system is always accurate. Use money management for long term trading success.   Place in backte
DTKGold
Thomas Bradley Butler
This is the DayTradeKing for gold on a 1 minute time frame.  It is a different calculation for the range. Use a 200 period moving average as a filter.  Always use stops and avoid news, wait for more conformation.  This looks to capture intraday ranges. Put it in the back tester on 1 minute to see the price action and how it works. Trade with trend Use filter Use stops Alerts are added for pop ups and sound. 
SuperArrowScalper
Thomas Bradley Butler
Trade trends with the Super Scalper Use on all time frames and assets it is  designed for scalping trends. Works good on small time frames for day trading.  The arrows are easy to follow.  This is a simple no repaint/no recalculate arrow indicator to follow trends with.  Use in conjunction with your own system or use moving averages.  Always use stops just below or above the last swing point or your own money management system The indicator comes with push notifications, sound alerts and email
Levels Trading
Thomas Bradley Butler
This indicator is a simple stripped down version of any advanced support and resistance indicator.  All the support and resistance indicators work from a number of bars that have developed over time. Get rid of clutter and confusing levels.  Find levels according to a number of bars. Look at days, session, numbers of hours, periods of consolidation.  Watch levels develop and use as breakout points, or areas of buyers and sellers.  Features and things to consider This indicator is for a frame of
ForexReversalEA
Thomas Bradley Butler
https://www.mql5.com/en/market/product/57345 Questo EA si basa sull'indicatore Forex Reversal. Se preferisci scambiare manualmente il sistema, scarica l'indicatore e provalo. L'EA seguirà la tendenza e aprirà le posizioni di conseguenza. I risultati mostrano guadagni stabili con un drawdown inferiore, ma sperimentali nel back tester, nell'ottimizzatore e nei time frame per vedere cosa funziona. Tutti i risultati mostrati sono ipotetici. Nota: questa non è una martingala o una griglia. l'ind
HFTHacker
Thomas Bradley Butler
Segnale: collegamento HFT Hacker sul mio profilo *OTTIMIZZA EA PRIMA DEL TEST E DELL'UTILIZZO. ACQUISTA SOLO SE HAI OTTIMIZZATO. Questo è per i trader che sanno come ottimizzare e vogliono essere redditizi in base ai propri meriti. IMPOSTA I TUOI PARAMETRI DI RISCHIO. Tasso di vincita elevato con interruzioni per le operazioni che non funzionano se lo desideri. Ridurre il rischio per la longevità. Funziona su tutti gli account ed è uno strumento di gestione del rischio, LEGGI tutti i commenti,
MarketMaker
Thomas Bradley Butler
Automatizza il commercio della domanda e dell'offerta. Fare un mercato. Questo EA è stato realizzato e ispirato dal popolare indicatore di domanda e offerta che tutti vendono e imitano. L'EA continua a fare trading e copertura, creando un mercato. Può essere negoziato anche su conti non di copertura. È necessario valutare i rischi e utilizzare i tempi, le dimensioni dei lotti, le capacità di copertura. L'ho scambiato per circa un mese in totale a intermittenza e su più coppie contemporanea
Top Trader
Thomas Bradley Butler
Top Trader Indicator This is an arrow reversal indicator. This is with deviations and arrows.  Trade a blue arrow for buy and trade a red arrow for sell.  Change the time period and the deviations of the bands.  This is similar to others but these arrows don't repaint.  Load in back tester and study which periods and deviations work the best.  It works on all time frames.  15 min to 1 hr would give good results for take profits.  Try according to your own risk management.
Quant Bot
Thomas Bradley Butler
Quant Bot è per il trading di tendenza sull'intervallo di un'ora per EUR/USD. Non esiste un file impostato, ma se vengono utilizzate altre coppie, potrebbe essere necessaria l'ottimizzazione. Informazioni sul bot: Utilizza la generazione genetica e utilizza l'ATR per il commercio. Il periodo di camminata in avanti è stato utilizzato per prevenire l'adattamento della curva L'EA utilizza gli stop su ogni operazione. La gestione del denaro è un aumento con la % del saldo Il periodo di ritorno
Golden Standard
Thomas Bradley Butler
PER XAU/USD Questo è un sistema di trading stabile che utilizza generazioni casuali e trend following trading. L'esperto è stato testato a posteriori con dati di qualità, ha completato un periodo di ottimizzazione insieme alla simulazione Monte Carlo per evitare l'overfit su intervalli di tempo XAU/USD di 1 ora. Vengono utilizzati Stop Loss e Take Profit. L'EA ha più configurazioni e non c'è nient'altro da fare se non capire quanti lotti scambiare. Caratteristica: Utilizza la percentu
PropTrader
Thomas Bradley Butler
*OTTIMIZZA EA PRIMA DELL'USO* Strategia di trading Forex ottimizzata per EUR/USD Raggiungere una ricchezza sostanziale entro un anno o due con un Expert Advisor (EA) è un'affermazione non realistica. Il backtesting e il trading reale si concentrano sulla coppia di valute EUR/USD. Informazioni su questa strategia: Ciò rappresenta l’iterazione iniziale della nostra strategia, con il potenziale per ulteriori progressi. Testato rigorosamente con dati di qualità al 100%, è esente da errori MT
Down Under
Thomas Bradley Butler
Down Under scambia la coppia AUD/USD in un intervallo di tempo di 1 ora. Questo EA scambia ATR e OHLC. È formattato per questa coppia in questo intervallo di tempo. Il compounding viene utilizzato con un min. dimensione del lotto e un max. dimensione del lotto. La percentuale dei saldi è composta da operazioni vincenti. Poiché il saldo oscilla, così fa la dimensione del lotto. Impostazioni: mm rischio % mm lotti lotti massimi Non c'è nient'altro da cambiare. Questo non ha capacità di
Cable Trader
Thomas Bradley Butler
GBP/USD 1hr Questo EA scambia slancio e sessioni. Questo ha una componente di lotto fissa e continuerà a modificare il TP man mano che si sviluppa. Impostazioni: Dimensione del lotto Non c'è nient'altro da cambiare. Questo non ha capacità di martingala o copertura. L'unica altra caratteristica da cambiare è se stai negoziando, CFD su GBP/USD. Modificalo con il decimale sulla piattaforma del broker. Dichiarazione di non responsabilità sui rischi I futures, le opzioni e il trad
Euclidean
Thomas Bradley Butler
Euclidea è un algoritmo di trading unico che ho inventato 8 anni fa. Questo EA fa parte di questo sistema. Funziona come un sistema chiuso. L'EA avvierà un acquisto quando il grado dell'angolo è corretto per catturare una tendenza. Lo stop loss è del 10% dall'angolo. È così semplice. Ingressi: % del saldo in lotti 1 micro lotto per $ 1.000 Volume lotti superiori = la quantità massima di lotti Livello di profitto = il valore predefinito è 50 pip Come e cose da considerare: Lo stop loss è i
Pip Scalper
Thomas Bradley Butler
UN INDICATORE PER TUTTI Pip Scalper è per le tendenze dello scalping. Rimani nelle tendenze più a lungo con questo indicatore. Funziona su tutti i tempi e le risorse. Raccogli pip giornalieri con questo strumento. Usa la media mobile 200 per filtrare le operazioni. Si consigliano tempi più brevi. Utilizzare per il day trading. Informazioni e modalità di utilizzo: Pips Scalper si basa sul trend trading a lungo termine. Acquista in blu Vendi su Rosso Usa 200 medie mobili come filtro e fai
Order Flow Trader
Thomas Bradley Butler
Just a simplified way of observing the volume.  It shows the buy flow against the sell flow.  See the volume coming in and trade with the money.  Visualize the trend rising or falling and trade according to the imbalance in volume.  Use for scalping and trend trading.  Trade by volume coming in. FOOTPRINT CHART:  https://www.mql5.com/en/market/product/94153 Order Book:  https://www.mql5.com/en/market/product/102247 EA Based:  https://www.mql5.com/en/market/product/82585 Note: Works in real
Combine Winner
Thomas Bradley Butler
Trade any Forex combine out there.  Many prop firms offer challenge or instant funding combines.  The biggest problem is controlling the loss.  With this indicator you can get a visual system that can limit loss and teach discipline.  This uses the MACD and the strategy is scalping.  You can determine the risk and reward.  Visually follow small trends for scalps.  Trade during active sessions.  It's just a simple system to instill discipline while limiting loss and scalping pips with the paramet
Holy Grail Arrow
Thomas Bradley Butler
Holy Grail arrow is for scalping.  The period you use will determine the trend.  You can try different time frames and periods to see what works best for your strategy.  Filters can be applied like a moving average or trendlines.  The 1 minute works good for scalps and always trade during active periods and avoid consolidation times.  Using other indicators to determine trends is recommended but this can also be a free flowing scalping system alone with tp and sl. Inputs: Period = trend period
Filtro:
pitaleks21
14
pitaleks21 2024.04.13 16:52 
 

L'utente non ha lasciato alcun commento sulla valutazione.

Rispondi alla recensione