• Panoramica
  • Recensioni
  • Commenti

PTS Precision Index Oscillator MT5

L'Oscillatore dell'Indice di Precisione (Pi-Osc) di Roger Medcalf di Precision Trading Systems

La Versione 2 è stata attentamente rielaborata per essere estremamente veloce nel caricarsi sul tuo grafico e sono state apportate alcune altre migliorie tecniche per migliorare l'esperienza.

Il Pi-Osc è stato creato per fornire segnali di sincronizzazione del trading accurati progettati per individuare punti di esaurimento estremi, i punti ai quali i mercati vengono costretti a recarsi solo per eliminare tutti gli stop di tutti.

Questo prodotto risolve il vecchio problema di sapere dove si trovano i punti estremi, rendendo la vita del trader molto più semplice.

Si tratta di un indicatore di consenso altamente complesso che presenta alcune potenti differenze rispetto agli oscillatori standard del settore.

Alcune delle caratteristiche che utilizza sono le divergenze nell'Indice della Domanda, nel flusso di denaro, nell'RSI, nello Stocastico, nel riconoscimento dei pattern, nell'analisi del volume, nei punti estremi della deviazione standard e molte altre variazioni simili in diverse lunghezze.

A prima vista, per l'occhio non esperto, sembrerebbe come qualsiasi altro oscillatore, ma quando lo si osserva in giustapposizione ad altri oscillatori come l'RSI o il momentum, la vera potenza di questo indicatore comincia a emergere.

Secondo le mie conoscenze, non c'è altro oscillatore che possa frequentemente individuare con la stessa regolarità i massimi e minimi esatti.

L'Oscillatore dell'Indice di Precisione è composto da molte diverse equazioni matematiche che misurano il movimento dei prezzi e del volume in campionamenti di più frame temporali che predicono con un alto grado di accuratezza dove è probabile che si verifichino i punti di inversione nelle tendenze.

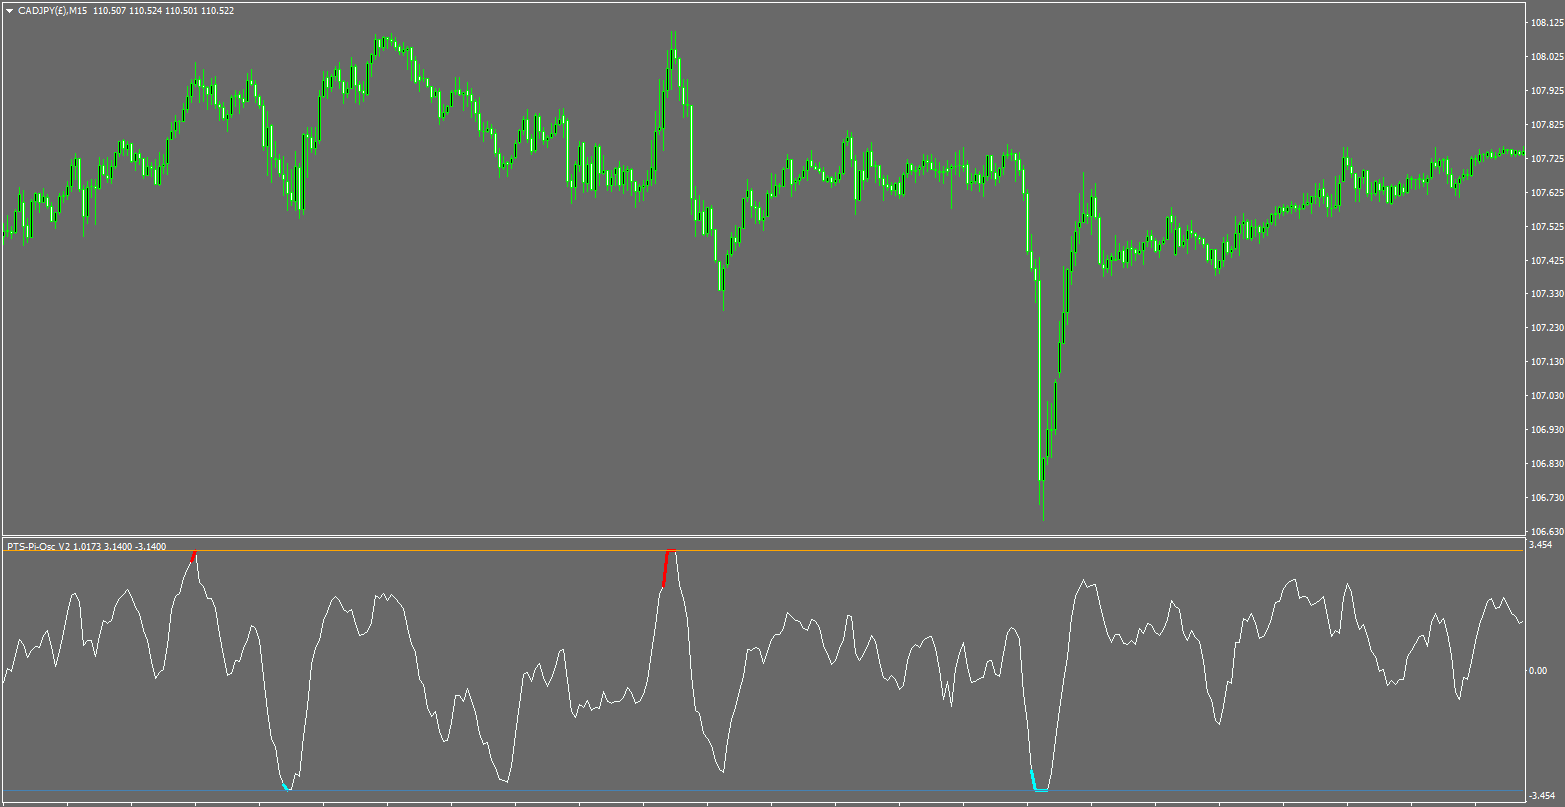
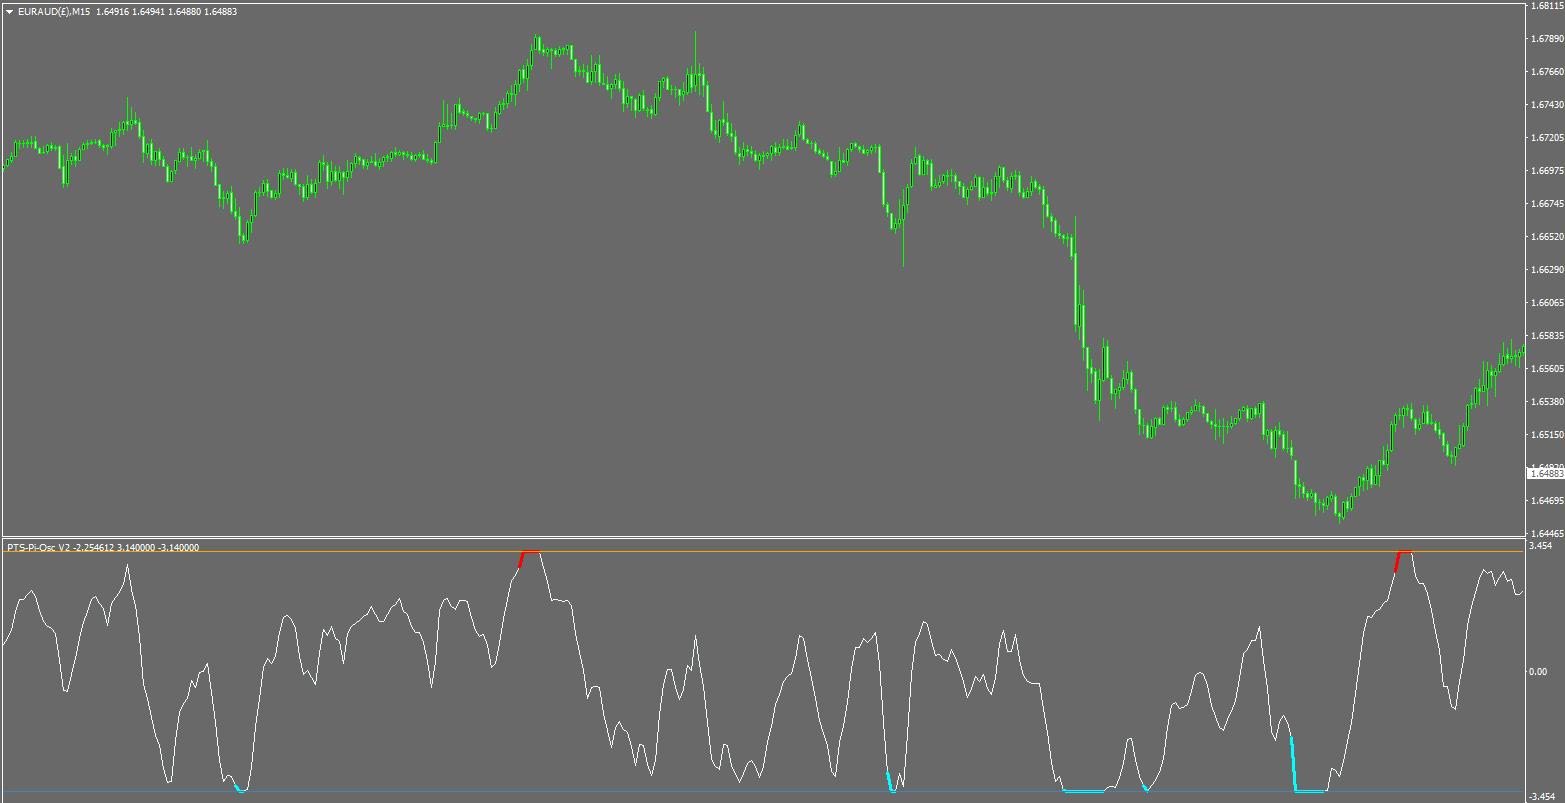
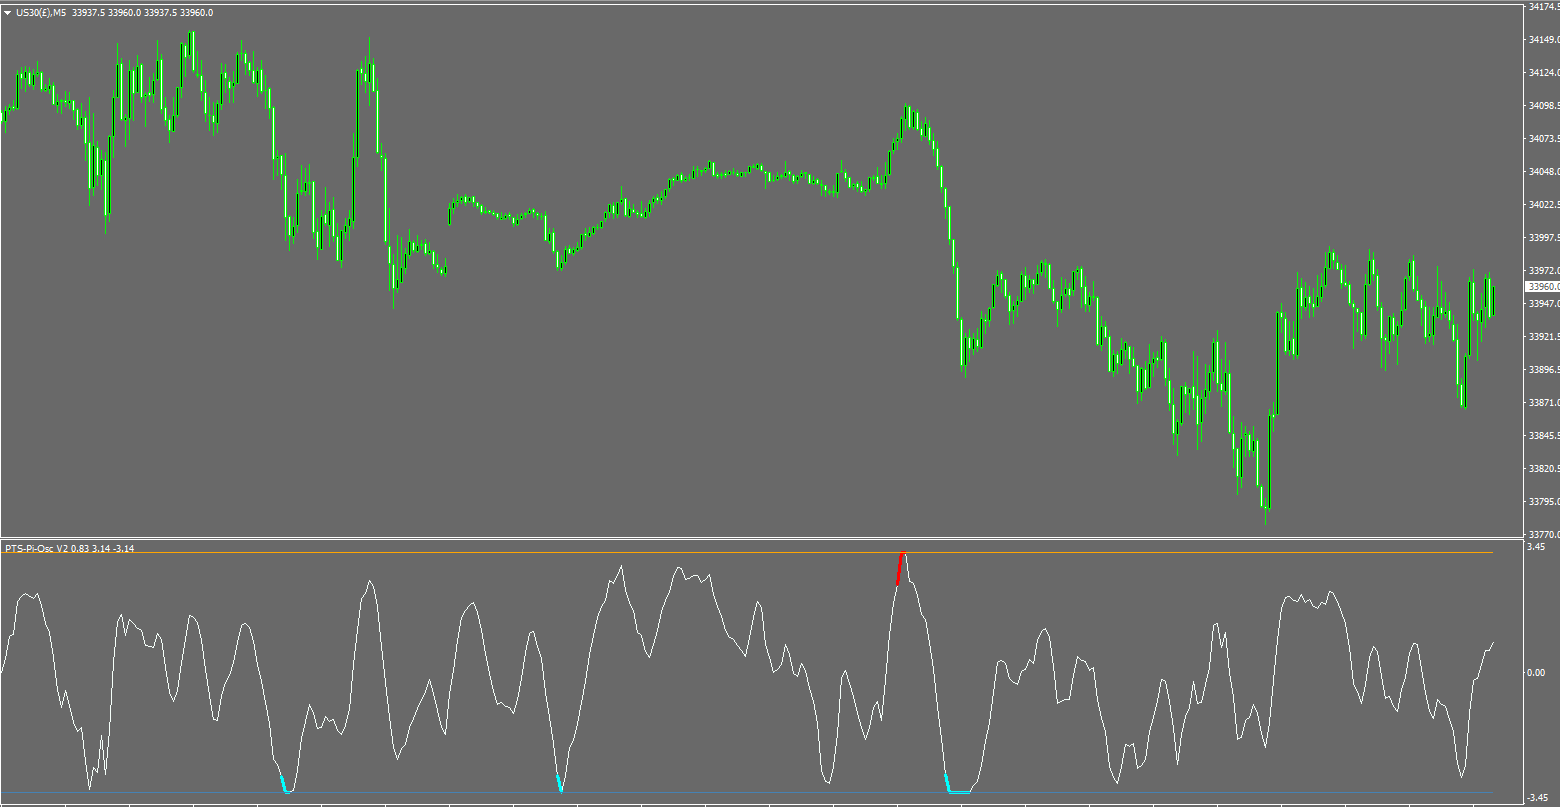
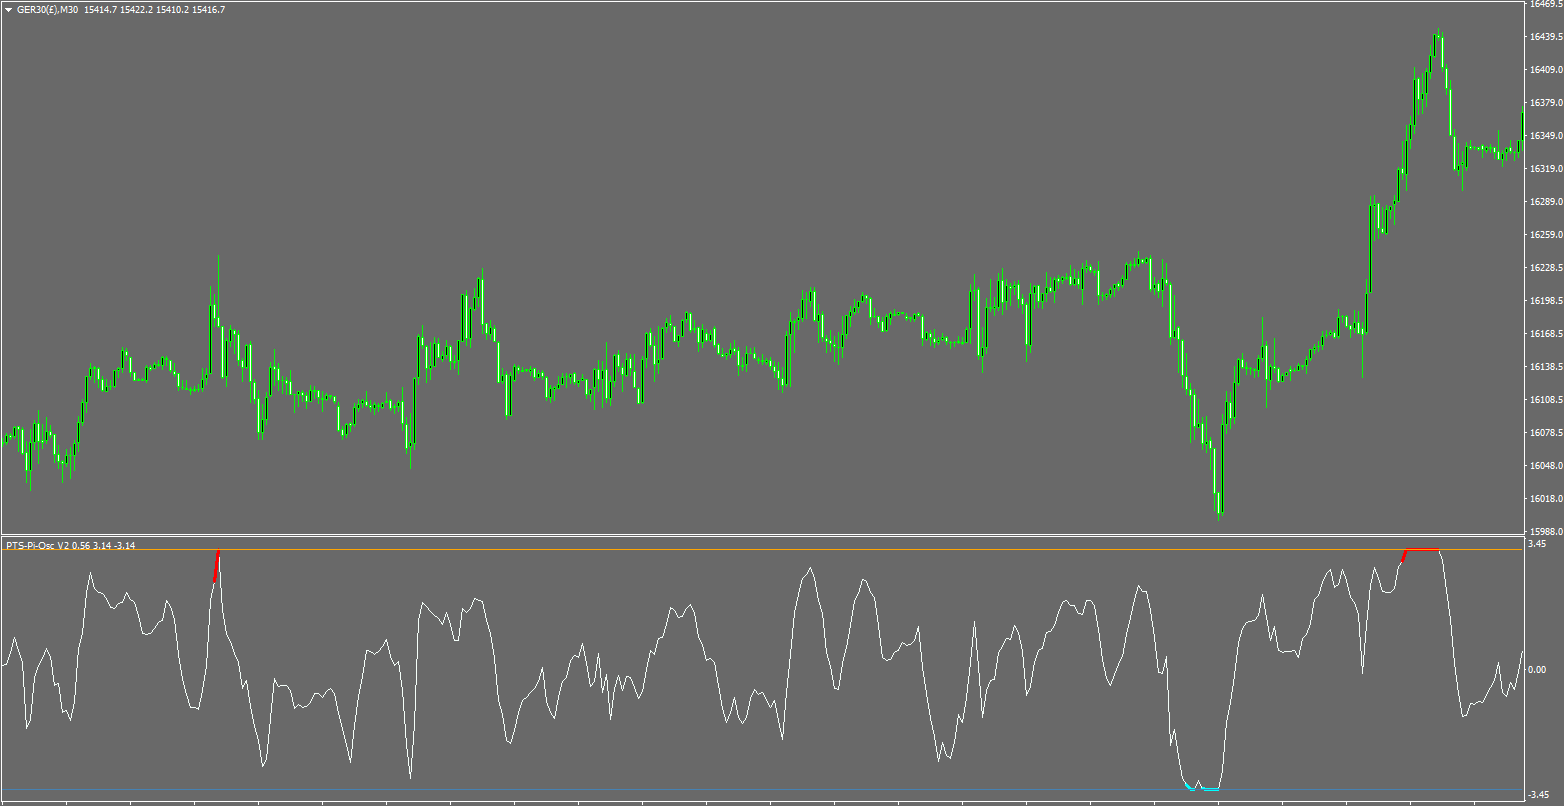
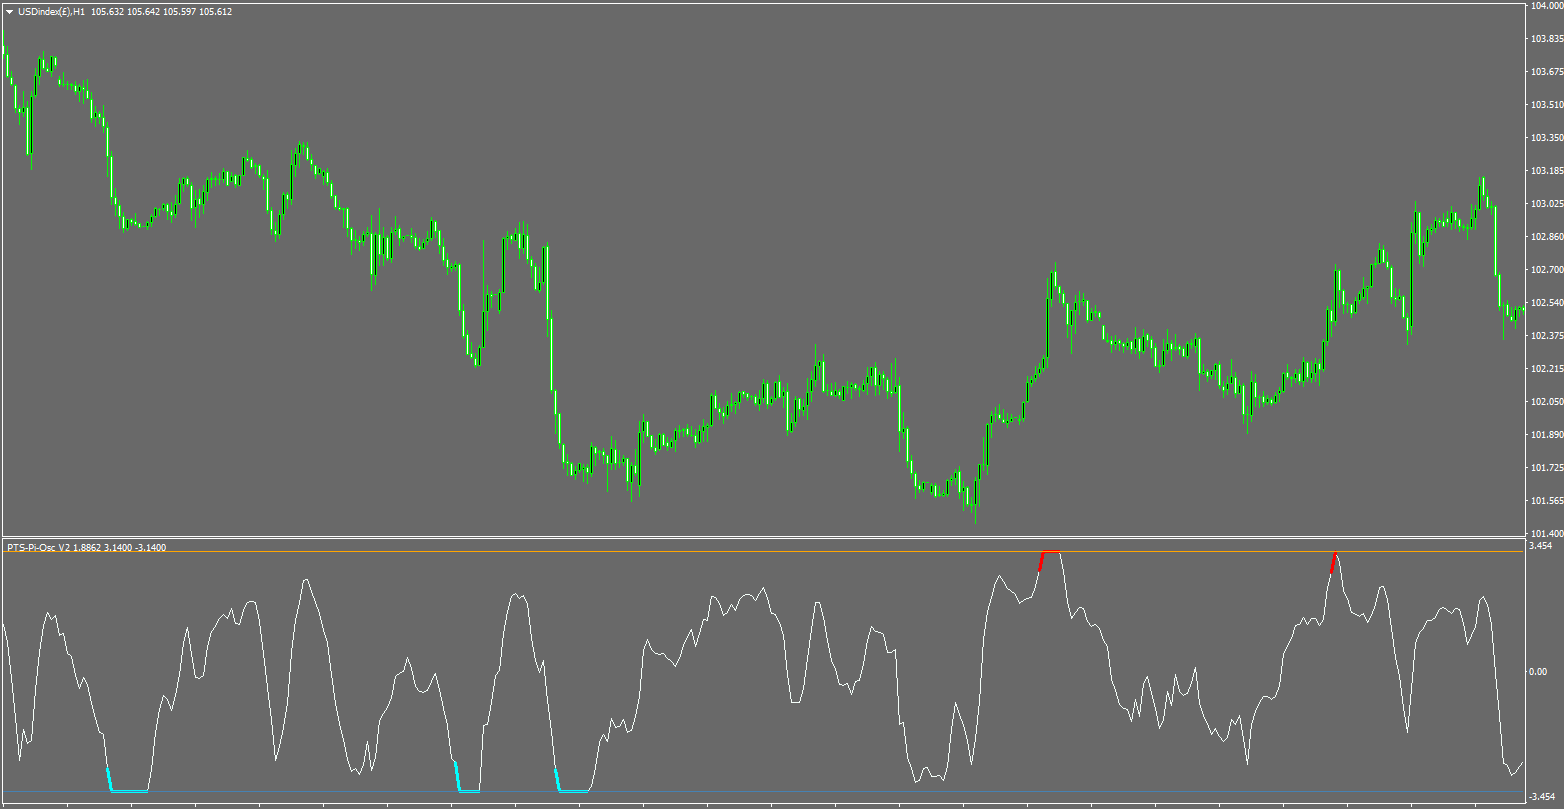
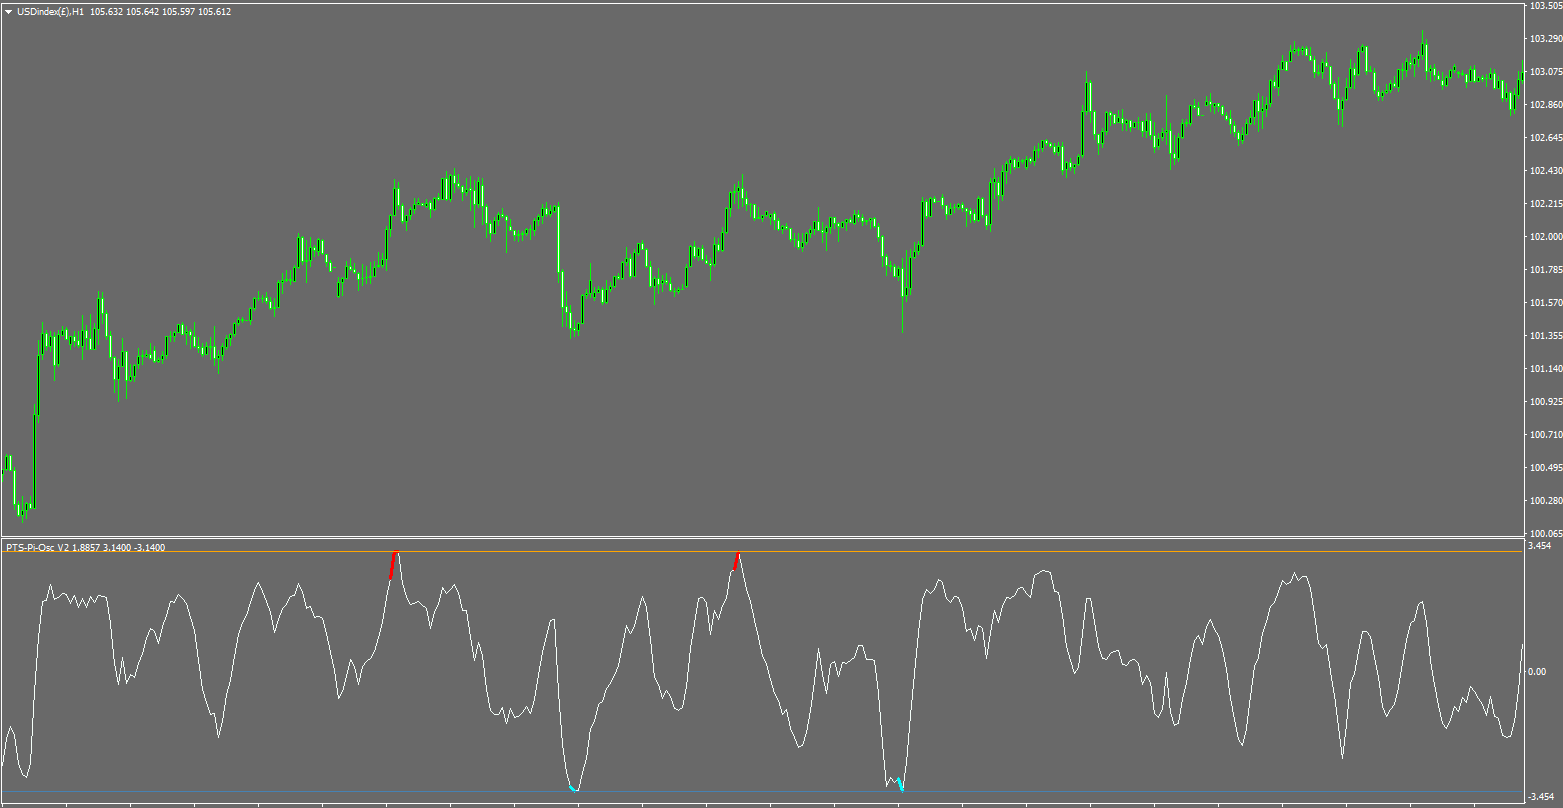
PTS Pi-Osc V2 è estremamente semplice da utilizzare e i segnali di avvertimento precoce dall'alto e dal basso vengono segnalati quando si raggiunge + o - 3,14, il vero segnale di trading che l'Oscillatore dell'Indice di Precisione fornisce è quando si allontana da Pi.

Si consiglia di attendere che la tendenza inizi a invertirsi nella direzione prima di prendere il segnale, poiché non tutti i segnali si inverteranno al tocco di più o meno Pi.

Si può utilizzare una media mobile di circa 10-20 periodi e aspettare che inizi a invertirsi prima di prendere le operazioni.

In alternativa, si può utilizzare il massimo più alto di circa 6-20 barre per entrare in operazioni lunghe quando il rimbalzo da -3,14 viene osservato e viceversa per le operazioni corte.

Sono forniti dei punti salienti per visualizzare i segnali in modo chiaro e preciso.

Le notifiche sono abilitate per impostazione predefinita in modo da poter essere davanti al tuo schermo pronto per entrare nella prossima operazione.

Questo segnale indica una probabilità elevata che la barra successiva si inverta. A volte si otterrà un grande movimento, altre volte si tratterà di piccoli movimenti e occasionalmente il segnale fallirà e il prezzo non si invertirà.

Come per la maggior parte dei metodi di analisi tecnica, se un segnale non si realizza, è meglio trattarlo come un segnale di continuazione della tendenza esistente.

Non c'è alcuna garanzia che da ogni segnale scaturisca un trade vincente e i trader devono utilizzare stop di uscita e una buona gestione del rischio se vogliono avere successo nel lungo periodo.

Gli stop sono assolutamente essenziali con questo prodotto. (Valore suggerito per uno stop stretto 2 volte l'ATR e 5 volte l'ATR per uno stop più ampio)

Le operazioni possono essere chiuse quando la tendenza si inverte di nuovo utilizzando il metodo di ingresso della media mobile, ma un po' più lentamente per permettere alla tua posizione di avere la migliore possibilità di diventare un grande vincitore.

È importante notare che il Pi-Osc ha 8 regole che devono essere seguite:

1. Fai trading nella direzione della tendenza principale.

2. Trova il frame temporale che ha funzionato meglio nei test storici.

3. Utilizza sempre degli stop.

4. Aspetta che la tendenza inizi a invertirsi prima di entrare nel trade.

5. Aspetta che il rimbalzo si allontani da Pi.

6. Aspetta che il rimbalzo si allontani da Pi.

7. Aspetta che il rimbalzo si allontani da Pi.

8. Ricorda le altre sette regole.

Ti prego di visitare il mio sito web per ulteriori screenshot, video e informazioni. Basta copiare e incollare il titolo di questo articolo nella ricerca per trovarlo.

Un grande ringraziamento a Iron Condor per aver lavorato intensamente su questo codice per farlo caricare e eseguire più velocemente con una maggiore efficienza.


Prodotti consigliati
Multiple Timeframe MACD indicator. This indicator was built for making multiple timeframe analysis possible in MT5 using MACD Indicator. MACD Indicator traditionally shows two lines and one histogram. MACD Line(Yellow) is calculated by subtracting 12period EMA(fast) from 26period EMA (slow). Signal Line(Blue) is created by a 9period EMA from MACD Line. Histogram is just the difference between MACD and Signal lines. Histogram is colored based on the difference between its value and the previous h
Colored TRIX
Flavio Javier Jarabeck
4.5 (2)
Developed by Jack Hutson in the 80's, the Triple Exponential Moving Average (a.k.a. TRIX ) is a Momentum technical indicator that shows the percentage of change in a moving average that has been smoothed exponentially 3 times. The smoothing process was put in place in order to filter out price movements that are considered insignificant for the analysis period chosen. We at Minions Labs found hard to follow the smoothness of the original TRIX line, so we colored the TRIX line with BUY and SELL t
FREE
Chessmark
Matheus Oliveira Rossi
Trend Indicator  This indicator is about long buy and long sell using a simple visualization of trend.  The green candle after a long sell period means a good moment to buy. A red candle after a long sequence of buyers means a good moment for sell. After all, you can use all time-frames on this indicator. * * If you prefer a better visualization, use long period on chart. Ex: 1H and 4H.   
XCalper HiLo Activator
Aecio de Feo Flora Neto
HiLo Activator v1.02 by xCalper The HiLo Activator is similar to moving average of previous highs and lows. It is a trend-following indicator used to display market’s direction of movement. The indicator is responsible for entry signals and also helps determine stop-loss levels. The HiLo Activator was first introduced by Robert Krausz in the Feb. 1998 issue of Stocks & Commodities Magazine.
The indicator tracks the trend in 5 different chart times for the same asset, based on 6 signals for each chart time. The main objective of the indicator is to show us the majority trend of the financial asset in which it was placed. The system transmits the information of the trends in several graphical times, in this way the user is able to have a wide view of the movement of the asset, this type of tool makes the user have a higher hit rate by helping the operator to execute orders in fa
Expert Amazo
Guilherme Geovanini Fraga
EXPERT AMAZO é um Expert Advisor projetado especificamente para negociar WIN (mini índice) e WDO (mini dólar). A operação é baseada na abertura de ordens utilizando alguns indicadores como Sars parabólicos, médias móveis, Bandas de Bollinger, Fibonacci, etc., trabalhando de acordo com 3 modalidades de estratégia, o AMAZO procura prever os movimentos do mercado com operações contra ea favor da tendência.        Entre em nosso Grupo de WhatsApp para receber as melhores configurações do Expert.
Volume Profile Indicator used by professional Traders at Traders Inside Ltd. If you want to succeed in trading you need to know if current price is cheap, expensive or fair valued. Key features: Fair price (Point of control, POC), high and low price zones (POH, POL) POC in different timeframes for better orientation Symbol and timeframe Chart resize on open positions/orders, VPRmax/min Historic POC - see, how POC has changed the last periods Button to show/hide VPR Calculated Bars (best results
This is Gekko's Bollinger Bands indicator. It extends the use of the famous Bollinger Bands and calculates strong entry and exit signals using price action on the edge and on the middle bands. You can set it up in many different ways, eg: pullback, pullback against trend, middle band crossing and middle band crossing against trend. Inputs Number of Bars to Plot Indicator:  number of historical bars to plot the indicator, keep it low for better performance; Produces Signal Only When a Bar Closes:
This indicator builds upon the previously posted Nadaraya-Watson smoothers. Here we have created an envelope indicator based on Kernel Smoothing with integrated alerts from crosses between the price and envelope extremities. Unlike the Nadaraya-Watson estimator, this indicator follows a contrarian methodology. Please note that by default this indicator can be subject to repainting. Users can use a non-repainting smoothing method available from the settings. The triangle labels are designed
DG TrendSigns
David Gadelha
3 (1)
Purpose DG Trend+Signs is an indicator that paints candles with trend colors and clearly shows consolidations, using both DoGMA Trend and DoGMA Channel indicators. It was created to help users in their trades, showing trends, consolidations and marking entry and exit points. The indicator also takes consolidations in consideration to identify breakouts. Key features Designed to be simple to use, with a few parameters Does NOT repaint Does NOT recalculate Signals on entries Works in ALL pairs W
HV Models
Andrey Azatskiy
HV Models is an Indicator that containes 4 methods for calculating historical volatility of the selected asset. Volatility is one of the fundamental values ​​describing changes in the underlying asset. In statistics, it usualy describes as a standard deviation. The price chart has 4 values ​​(Open High Low Close) when we calculate volatility using a standard indicator, only one of these values ​​is used as a result we get one-sided volatility picture. The presented indicator uses 4 volatility ca
Hello; This indicator provides input and output signals of real volume levels with some mathematical calculations. It is simple and safe to use. As a result of the intersection of real volume levels with averages, it creates buy and count signals. Indicator parameter descriptions: A-PERIOD: Indicates the number of bars to be calculated. B-GAMMA: A fixed Fibonacci trend average of 0.618 is used. Use C-VOLUME TYPE:Tick volume as a constant. D-HIGH LEVEL 2: Represents the level of the
Timeframe Separator
Alexandre Borela
5 (3)
If you like this project, leave a 5 star review. Often times we are using brokers that are outside of the GMT-0 timezone, this not only complicates things, but, it can make seeing when a trading session starts a bit more difficult than it should. This indicator allows you to set a timezone offset it will draw a vertical line for the: Day. Week. Month. Quarter. year.
FREE
FuTuRe 01 Phi Cubic Fractals Pack1
Claudio De Carvalho Aguiar
5 (1)
This product contains following indicators: (Lines + LineSAR + Channels + BTL + Ladder) Phi Lines  - special EMAs, similar to MIMAs from Phicube; Phi LineSAR  - erase and highlight Phi Lines in support or resistance. Similart to MIMASAR from Phicube; Phi Channels  - show support and resistance, similar to Phibo from Phicube (Green and Read Lines); Phi BTL  - candles color following Phi Lines alignment; Phi LADDER  - Indicator that allow you to visualize possible targets.  FUTURO Tool Future to
Ershov 38 parrots MT5
Aleksei Ershov
5 (1)
The indicator is designed to close positions on the market in time. For example: to take profits ahead of schedule if the price has not reached TakeProfit, and the market is turning around. The indicator analyzes the momentum, not the trend. He does not give any information about the trend. The indicator is well suited for finding divergence. The Ershov 38 Parrots indicator dynamically adjusts to the market and detects price movement impulses of medium and high amplitude. It almost does not rea
Setup Double 7s
Luigi Nunes Labigalini
Entry and exit signals from the Double 7's Strategy by Larry Connors in his book "Short Term Trading Strategies That Work". Larry claims this strategy predicted the market's direction over 80% of the time since 1995. Picking up the gains and being exposed in the market less than 25% of the time. Good for swing trading on Daily charts of SPY, Nasdaq, China's FXI, Brazil's EWZ and the majority of the equity ETFs and World Indices. How does it work? The indicator activates the buy signal when
Market Session Pro
Kambiz Shahriarynasab
The  Market Sessions Indicator for MT5 helps you  predict market turnarounds  by detecting major supply and demand areas. These pivot points tend to occur after a new session has started and the previous one is still open. It is also used to gauge how many points or pips the market moves on average during a session. This helps us to place better our take profits and stop losses. The indicator works on all forex pairs, gold, silver, commodities, stocks, indices and any other instrument that your
Marca Dagua
Erison Francisco De Sales
3 (1)
Adiciona marca d'água com nome do ativo em negociação. Pode ser ajustado definindo tamanho da fonte e coloração do texto. Testado com vários ativos do mercado B3 e Forex  Adione ao gráfico e configure de acordo com a necessidade. Caso tenha problemas sinta-se a-vontade para nos avisar e providenciaremos a correção logo que possível. ______________________________
FREE
The indicator monitors the Dinapoli MACD trend in multiple timeframes for the all markets filtered and shows the results on Dashboard. Key Features Indicator can be used for all markets Monitors every timeframe, from 1 Min to Monthly Parameters UseMarketWatch: Set true to copy all symbols available in market watch MarketWatchCount : Set the number of symbols that you want to copy from the market watch list. CustomSymbols: Enter the custom symbols that you want to be available in dashboard.
Outside The Box
Innovicient Limited
The Outside The Box (OTB) is a complete trading system that provides the user with immense trading ability by highlighting on the chart areas where the trader should prepare to Re-enter the trend after pullbacks (Pullback trading strategy) Take partial/complete profit(Profit taking strategy), and Trade breakouts (Stock breakout strategy) - We have updated the indicator to show/hide Micro breakout areas around the major breakouts (Micro Breakouts).  The above is supported by an alert system to no
Limitless MT5
Dmitriy Kashevich
Limitless MT5 is a universal indicator suitable for every beginner and experienced trader. works on all currency pairs, cryptocurrencies, raw stocks Limitless MT5 - already configured and does not require additional configuration And now the main thing Why Limitless MT5? 1 complete lack of redrawing 2 two years of testing by the best specialists in trading 3 the accuracy of correct signals exceeds 80% 4 performed well in trading during news releases Trading rules 1 buy signa
This is Gekko's Strong Bars indicator. It produces signals when there is a strong bullish or bearish bar, for that it uses three different conditions: 1 - when the current bar is higher/lower than the last x bars (x is an input parameter), 2 - when the current bar size is higher than the average size of the last x bars (x is an input parameter) and 3 - when the current bar has a short candle tail (shadow). Inputs Plot Strong Bar Arrows for the past X Historical Bars: number of historical bars
Vanguard's Volatility indicator is based on the analysis of long and short price volatility. It helps to determine market entry points by displaying favorable entry points with arrows. This indicator can be used as a filter in trading or as a tool to show the exact direction of the trend. It is suitable for both scalping on small time intervals and long-term trading. It is important to remember that successful trading requires a comprehensive approach, and additional information is needed to en
Tutti gli 11 indicatori si spengono rapidamente e si accendono rapidamente! Set di indicatori: 2 indicatori "TENDENZA"   : - veloce = linea 4 colori - lento = punti 4 colori La colorazione degli indicatori dipende dalla direzione del trend e dall'indicatore RSI: 1) trend rialzista e RSI<50% 2) trend rialzista e RSI>50% 3) RSI di tendenza al ribasso <50% 4) RSI di tendenza al ribasso   >   50% Impostare i periodi dell'indicatore per ogni fascia oraria: M5 M10 M15 M30 H1 H2 H4 H6 H12 D1
Aroon Precision Trends MT5
Maestri Investment Group Ltd.
Introducing the Aroon Indicator - Your Ultimate Trend Analysis Tool! Are you looking to take your trading game to the next level? Want to identify lucrative entry and exit points in the financial markets with ease? Look no further! The Aroon Indicator is here to revolutionize your trading strategy and help you make informed decisions like never before. Developed by the brilliant mind of Tushar Chande, the Aroon Indicator is a powerful technical analysis tool designed to measure the strength
Coiote Book Balance
Alexandre Moraes De Souza Lima
Coiote Book Balance é um indicador que monitora o livro de ofertas e indica de maneira simplificada o níveis de renovação de ordens agrupados no timeframe gáfico, mostrando quanto o maior lado renovou e a diferença dessas renovações. Além disso, é possível visualizar em quais preços estão as maiores ordens da cada lado, o preço teórico dessa liquidez e a quantidade de lotes em tempo real. Para correto funcionamento do indicador é preciso que o livro de ofertas seja aberto antes da inclusão do in
EA LivWell
Jayme Roger Alves Vieira
EA LivWell Robot Is Without a Doubt The Best Robot For Forex, B3 And Proprietary Table! OPERATE 100% ON AUTOMATIC! A professional trading robot that performs operations in the financial market without you having to waste time and without having to manage emotional control! RECOMMENDED CAPITAL: You can start from as little as $10 using a Cent account. SETUPS: You will receive several setups already configured and ready for various market styles. STRATEGY SUMMARY The E.A. LivWell oper
HIGH and LOW OTT
Mohammad Taher Halimi Tabrizi
This product is converted form Trading View of Kivanc Ozbilgic to be used on MT5 and below are descriptions of developer on Trading View: Anıl Özekşi's latest development on his precious OTT - Optimized Trend Tracker: In this version, there are two lines of OTT which are derived from HIGHEST price values (HOTT) and LOVEST price values (LOTT) which were originally sourced to CLOSE values on default OTT. Another significant difference is there is no Support Line (Moving Average) in this ver
Markets Heat indicator can help you determine correct course of action at current market situation, by calculating market's "heat level". What is market's "heat level"? Well, it's my own way of simplifying complex market conditions to ease decision-making process. How does it work? Most of time market is moving in some narrow range and can't "decide" where to go -> flat market -> cold market. Other times, price goes Up or Down -> making trend movements -> heating the market. More powerful trends
Market Session Visual
Kambiz Shahriarynasab
The  Market Sessions Indicator for MT5 helps you  predict market turnarounds  by detecting major supply and demand areas. These pivot points tend to occur after a new session has started and the previous one is still open. It is also used to gauge how many points or pips the market moves on average during a session. This helps us to place better our take profits and stop losses. The indicator works on all forex pairs, gold, silver, commodities, stocks, indices and any other instrument that yo
Gli utenti di questo prodotto hanno anche acquistato
Atomic Analyst MT5
Issam Kassas
5 (12)
Innanzitutto, vale la pena sottolineare che questo indicatore di trading non è repaint, non è ridisegno e non presenta ritardi, il che lo rende ideale sia per il trading manuale che per quello automatico. Manuale utente: impostazioni, input e strategia. L'Analista Atomico è un indicatore di azione del prezzo PA che utilizza la forza e il momentum del prezzo per trovare un miglior vantaggio sul mercato. Dotato di filtri avanzati che aiutano a rimuovere rumori e segnali falsi, e aumentare il pote
Innanzitutto è importante sottolineare che questo sistema di trading è un indicatore Non-Repainting, Non-Redrawing e Non-Lagging, il che lo rende ideale sia per il trading manuale che per quello automatico. Corso online, manuale e download di preset. Il "Sistema di Trading Smart Trend MT5" è una soluzione completa pensata sia per i trader principianti che per quelli esperti. Combina oltre 10 indicatori premium e offre più di 7 robuste strategie di trading, rendendolo una scelta versatile per div
FX Volume MT5
Daniel Stein
4.94 (17)
Ricevi il tuo aggiornamento quotidiano sul mercato con dettagli e schermate tramite il nostro Morning Briefing qui su mql5 e su Telegram ! FX Volume è il PRIMO e UNICO indicatore di volume che fornisce una visione REALE del sentiment del mercato dal punto di vista del broker. Fornisce informazioni straordinarie su come gli operatori di mercato istituzionali, come i broker, sono posizionati sul mercato Forex, molto più velocemente dei rapporti COT. Vedere queste informazioni direttamente sul vo
Quantum Trend Sniper
Bogdan Ion Puscasu
5 (39)
Presentazione       Quantum Trend Sniper Indicator   , l'innovativo indicatore MQL5 che sta trasformando il modo in cui identifichi e scambi le inversioni di tendenza! Sviluppato da un team di trader esperti con un'esperienza di trading di oltre 13 anni,       Indicatore Quantum Trend Sniper       è progettato per spingere il tuo viaggio di trading verso nuove vette con il suo modo innovativo di identificare le inversioni di tendenza con una precisione estremamente elevata. *** Acquista Quant
Gold Stuff mt5
Vasiliy Strukov
4.89 (170)
Gold Stuff mt5 è un indicatore di tendenza progettato specificamente per l'oro e può essere utilizzato anche su qualsiasi strumento finanziario. L'indicatore non ridisegna e non è in ritardo. Periodo consigliato H1. Contattami subito dopo l'acquisto per avere le impostazioni e un bonus personale!   IMPOSTAZIONI Disegna freccia - acceso spento. disegnando frecce sul grafico. Avvisi: avvisi acustici disattivati. Notifica e-mail - on off. notifiche di posta elettronica. Notifica Puch - on of
Presentazione       Quantum Breakout PRO   , l'innovativo indicatore MQL5 che sta trasformando il modo in cui scambi le zone di breakout! Sviluppato da un team di trader esperti con un'esperienza di trading di oltre 13 anni,       Quantum Breakout PRO       è progettato per spingere il tuo viaggio di trading a nuovi livelli con la sua strategia innovativa e dinamica della zona di breakout. Quantum Breakout Indicator ti fornirà frecce di segnalazione sulle zone di breakout con 5 zone target
FX Power MT5 NG
Daniel Stein
5 (5)
Ricevi il tuo aggiornamento quotidiano sul mercato con dettagli e schermate tramite il nostro Morning Briefing qui su mql5 e su Telegram ! FX Power MT5 NG è la nuova generazione del nostro popolare misuratore di forza delle valute, FX Power. Cosa offre questo misuratore di forza di nuova generazione? Tutto ciò che avete amato dell'FX Power originale IN PIÙ Analisi della forza di ORO/XAU Risultati di calcolo ancora più precisi Periodi di analisi configurabili individualmente Limite di calcolo pe
A key element in trading is zones or levels from which decisions to buy or sell a trading instrument are made. Despite attempts by major players to conceal their presence in the market, they inevitably leave traces. Our task was to learn how to identify these traces and interpret them correctly. Reversal First Impulse levels (RFI)   -  Version MT4                  INSTRUCTIONS                 RUS                 ENG                         R ecommended to use with an indicator   -  TREND PRO  
Advanced Supply Demand MT5
Bernhard Schweigert
4.53 (15)
La migliore soluzione per qualsiasi principiante o trader esperto! Questo indicatore è uno strumento di trading unico, di alta qualità e conveniente perché abbiamo incorporato una serie di funzionalità proprietarie e una nuova formula. Con questo aggiornamento, sarai in grado di mostrare fusi orari doppi. Non solo potrai mostrare una TF più alta, ma anche entrambe, la TF del grafico, PIÙ la TF più alta: SHOWING NESTED ZONES. Tutti i trader di domanda di offerta lo adoreranno. :) Informazioni imp
This is arguably the most complete harmonic price formation auto-recognition indicator you can find for the MetaTrader Platform. It detects 19 different patterns, takes fibonacci projections as seriously as you do, displays the Potential Reversal Zone (PRZ) and finds suitable stop-loss and take-profit levels. [ Installation Guide | Update Guide | Troubleshooting | FAQ | All Products ] It detects 19 different harmonic price formations It plots primary, derived and complementary Fibonacci p
Gartley Hunter Multi
Siarhei Vashchylka
5 (6)
Gartley Hunter Multi - An indicator for searching for harmonic patterns simultaneously on dozens of trading instruments and on all classic timeframes: (m1, m5, m15, m30, H1, H4, D1, Wk, Mn). Manual (Be sure to read before purchasing) | Version for MT4 Advantages 1. Patterns: Gartley, Butterfly, Shark, Crab. Bat, Alternate Bat, Deep Crab, Cypher 2. Simultaneous search for patterns on dozens of trading instruments and on all classic timeframes 3. Search for patterns of all possible sizes. Fr
MetaForecast M5
Vahidreza Heidar Gholami
5 (2)
MetaForecast predice e visualizza il futuro di qualsiasi mercato basandosi sull'armonia dei dati dei prezzi. Sebbene il mercato non sia sempre prevedibile, se esiste un modello nei prezzi, MetaForecast può prevedere il futuro con la massima precisione possibile. Rispetto ad altri prodotti simili, MetaForecast può generare risultati più accurati analizzando le tendenze di mercato. Parametri di input Past size (Dimensione passata) Specifica il numero di barre che MetaForecast utilizza per creare
Golden Gate Algo MT5
James David Lane
4 (6)
40% DI SCONTO PER NATALE! AUMENTO DEL PREZZO A $250 IL 1 GENNAIO! Presentiamo GoldenGate Entries: una soluzione di trading all'avanguardia! Scopri un approccio rivoluzionario al trading con GoldenGate Entries (GGE), un indicatore avanzato progettato per migliorare la tua esperienza di trading. GGE offre un set completo di funzionalità per fornire agli utenti precisione e fiducia nelle loro decisioni di trading. Coppie: Qualsiasi (FX - Materie prime - Azioni - Azioni - Cripto) TimeFrame
Good day! I present to you a trading technical indicator for Deriv broker synthetic indices. This indicator ONLY works with the following indices: Boom 300 Index Boom 500 Index Boom 1000 Index Crash 300 Index Crash 500 Index Crash 1000 Index The indicator was created to give signals to open medium-term trades in the direction of Spikes. But you can open trades in the opposite direction to Spikes, at your own risk. Trade only on M1. Other TFs do not guarantee the correct operation of the indic
FxaccurateLS
Shiv Raj Kumawat
WHY IS OUR FXACCCURATE LS MT5 THE PROFITABLE ? PROTECT YOUR CAPITAL WITH RISK MANAGEMENT Gives entry, stop and target levels from time to time. It finds Trading opportunities by analyzing what the price is doing during established trends. POWERFUL INDICATOR FOR A RELIABLE STRATEGIES We have made these indicators with a lot of years of hard work. It is made at a very advanced level. Established trends provide dozens of trading opportunities, but most trend indicators completely ignore them!
XQ Indicator MetaTrader 5
Marzena Maria Szmit
5 (1)
Step into the realm of Forex trading with confidence and precision using XQ, a cutting-edge Forex indicator designed to elevate your trading game to unprecedented heights. Whether you're a seasoned trader or just stepping into the world of currency exchange, XQ Forex Indicator empowers you with the insights and signals needed to make informed trading decisions. The signal conditions are a combination of three indicators, and XQ Forex Indicator only display  medium and long-term trends . The ind
Strong Support mt5
Vasiliy Strukov
5 (9)
I livelli di supporto e resistenza sono stati a lungo uno strumento potente per l'analisi del mercato. L'indicatore di supporto forte costruisce livelli di supporto ai minimi di prezzo locali e livelli di resistenza ai massimi di prezzo locali.  Gli altri miei sviluppi possono essere visualizzati qui Si consiglia di utilizzare insieme a un indicatore di tendenza, ad esempio, Gold Stuff : ciò consentirà di negoziare sulla tendenza e allo stesso tempo determinare le zone di consolidamento o i
TrendMaestro5
Stefano Frisetti
nota: questo indicatore e' per METATRADER5, se vuoi la versione per  METATRADER4 questo e' il link:   https://www.mql5.com/it/market/product/108106 TRENDMAESTRO ver 2.4 TRENDMAESTRO   riconosce un nuovo TREND sul nascere, non sbaglia mai. La sicurezza di identificare un nuovo TREND non ha prezzo. DESCRIZIONE TRENDMAESTRO identifica un nuovo TREND sul nascere, questo indicatore prende in esame la volatilita' i volumi ed il momentum per identificare il momento in cui c'e' un'esplosione di uno
Trend Scanner mt5 GS
Vasiliy Strukov
4.93 (15)
Trend Scanner scansiona le tendenze del mercato da Multi-Simboli e Multi-Time frame e lo visualizza su un pannello mobile sul grafico che utilizza l'indicatore di roba Gold per l'analisi Le funzionalità includono avvisi ed e-mail, nonché notifiche push. Il trader può selezionare più coppie di sua scelta per la visualizzazione. Trend Scanner è un ottimo strumento per vedere la direzione del trend e può essere utilizzato per il trading manuale o il trading EA consentendo solo di acquistare o vend
TPA True Price Action indicator reveals the true price action of the market makers through 100% non-repainting signals strictly at the close of a candle! TPA shows entries and re-entries, every time the bulls are definitely stronger than the bears and vice versa. Not to confuse with red/green candles. The shift of power gets confirmed at the earliest stage and is ONE exit strategy of several. There are available now two free parts of the TPA User Guide for our customers. The first "The Basics"
Golden Spikes Detector
Batsirayi L Marango
5 (1)
Golden Spikes Detector This indicator is based on an advanced strategy primarily for trading spikes on Boom and Crash Indices. Complex algorithms were implemented to detect high probability entries only. It alerts on potential Buy and Sell entries. To trade spikes on the Deriv or Binary broker, only take Buy Boom and Sell Cash alerts. It was optimised to be loaded on 5-minute timeframe although multiple timeframe analysis is done in the background. Features ·             Desktop pop up and sound
Noize Absorption Index - is the manual trading system that measures the difference of pressure between bears forces and bulls forces. Green line - is a noize free index that showing curent situation. Zero value of index shows totally choppy/flat market.Values above zero level shows how powerfull bullish wave is and values below zero measures bearish forces.Up arrow appears on bearish market when it's ready to reverse, dn arrow appears on weak bullish market, as a result of reverse expectation.
Professional Scalping Tool on Deriv Attention! The indicator will be sold in limited quantities!!! The previous 5 copies were sold for $250 The next 5 copies will be sold for $350 The next price is $500 Description: This trading indicator is designed for professional traders focused on scalping. Designed with the market in mind, it provides highly accurate spike trading signals. It works on the M1 timeframe and supports the following symbols: Boom 300 Index, Boom 500 Index, Boom 1000 Index,
L'indicatore Quadrato di Gann è uno strumento potente di analisi di mercato basato sull'articolo "Formula Matematica per le Previsioni di Mercato" scritto da W.D. Gann. Questo strumento utilizza concetti matematici e teorie di Gann per effettuare un'analisi precisa del mercato. Utilizza i quadrati di 144, 90, 52 e anche il quadrato di 9. Inoltre, integra il metodo del  per il quadrato di 9 e la sua relazione con canali e modelli stellari di quel quadrato. Manuale Utente e Applicazione: Prima di
Bill Williams Advanced
Siarhei Vashchylka
5 (5)
Bill Williams Advanced is designed for automatic chart analysis using Bill Williams' "Profitunity" system. The indicator analyzes four timeframes at once. Manual (Be sure to read before purchasing) Advantages 1. Automatically analyzes the chart using the "Profitunity" system of Bill Williams. The found signals are placed in a table in the corner of the screen. 2. Equipped with a trend filter based on the Alligator indicator. Most of the system signals are recommended to be used only accordi
PZ Swing Trading MT5
PZ TRADING SLU
5 (4)
Swing Trading is the first indicator designed to detect swings in the direction of the trend and possible reversal swings. It uses the baseline swing trading approach, widely described in trading literature. The indicator studies several price and time vectors to track the aggregate trend direction and detects situations in which the market is oversold or overbought and ready to correct. [ Installation Guide | Update Guide | Troubleshooting | FAQ | All Products ] Profit for market swings with
Eng Gold
Ely Alkrar Xshkaky
ENG-GOLD Scalper It is an auxiliary indicator that identifies potential targets and determines the place of entry with a stop loss that works on Heiken Ashi candles  The green lines are usually the targets, the red lines are the stop loss, and the yellow lines are the entry location.  This file is recognized on small and medium frames, usually less than the watch frame I highly recommend using XAUUSD US100 US30 USOIL 
IVISTscalp5
Vadym Zhukovskyi
5 (3)
We present you the iVISTscalp5 indicator, which is not only unique, but also effective in the analysis of trading operations. This indicator is based on time data and is the result of many years of experience and deep analysis of financial markets. The iVISTscalp5 indicator is an excellent assistant for manual trading. Convenience, simplicity and visualization. All the most difficult is hidden inside. We have simplified the settings and use of the iVISTscalp5 indicator as much as possible. The i
Malaysian SNR Levels
Matthias Horst Pieroth
This indicator can be used to display Support and Resistance levels according to  the  Malaysian SNR concept , in which Support and Resistance are exact levels of a line chart. Malaysian SNR There are 3 different horizontal levels in Malaysian SNR: A-Level : This level is located at the peak of this line chart. (shape looks like the letter A) V-Level : Level at the valley of a line chart, (shape looks like the letter V) Gap-Leve l: This level is located at the Close/Open gap between two cand
Тем, кто изучил книги Билла Вильямса "Новые измерения в биржевой торговле" и "Торговый Хаос (второе издание)" и пробовал торговать по этим методикам, становится ясно, что стандартного набора индикаторов недостаточно для полноценной работы. Индикатор  Trading Chaos Map  рисует "карту рынка", позволяя вам видеть графики так же, как автор трилогии. В параметрах предусмотрены опции включения и отключения каждого сигнала. Вы можете использовать ту или иную методику, либо использовать их вместе. Может
Altri dall’autore
PTS Precision Index Oscillator V2
PrecisionTradingSystems
5 (1)
L'Oscillatore dell'Indice di Precisione (Pi-Osc) di Roger Medcalf di Precision Trading Systems La Versione 2 è stata attentamente rielaborata per essere estremamente veloce nel caricarsi sul tuo grafico e sono state apportate alcune altre migliorie tecniche per migliorare l'esperienza. Il Pi-Osc è stato creato per fornire segnali di sincronizzazione del trading accurati progettati per individuare punti di esaurimento estremi, i punti ai quali i mercati vengono costretti a recarsi solo per e
PTS Divergence Buy Finder
PrecisionTradingSystems
PTS - Divergence Buy Finder di Precision Trading Systems Il Precision Divergence Finder è stato progettato per individuare i minimi di mercato con estrema precisione e lo fa frequentemente. Nell'analisi tecnica, l'arte di individuare i minimi di mercato è generalmente molto più semplice rispetto a individuare i massimi, e questo strumento è progettato appositamente per questa finalità. Dopo aver identificato una divergenza rialzista, è saggio attendere che la tendenza si inverta prima di ac
L'indicatore di vendita PTS Divergence Finder di Roger Medcalf - Precision Trading Systems. Questo indicatore fornisce solo segnali ribassisti - di vendita. In primo luogo, mi è stato chiesto molte volte perché non avessi fornito un indicatore di divergenza di vendita mentre fornivo volentieri un indicatore di ricerca di divergenza di segnali di acquisto da molti anni. Ho risposto che le divergenze di vendita sono meno affidabili delle divergenze di acquisto, cosa che è ancora vera. Alcune soluz
Demand Index
PrecisionTradingSystems
Codice PTS Demand Index di Precision Trading Systems Il Demand Index è stato creato da James Sibbet e utilizza un codice complesso per semplificare l'interpretazione del volume e del prezzo come combinazione. Comprendere i volumi non è mai un compito facile, ma questo bellissimo pezzo di programmazione certamente rende tutto più facile. Ci sono diversi modi in cui questo indicatore può essere vantaggioso per trader e investitori. Divergenze (Come indicatore principale) Dopo aver stu
PTS - Divergence Buy Finder di Precision Trading Systems Il Precision Divergence Finder è stato progettato per individuare i minimi di mercato con estrema precisione e lo fa frequentemente. Nell'analisi tecnica, l'arte di individuare i minimi di mercato è generalmente molto più semplice rispetto a individuare i massimi, e questo strumento è progettato appositamente per questa finalità. Dopo aver identificato una divergenza rialzista, è saggio attendere che la tendenza si inverta prima di ac
PTS Demand Index MT5
PrecisionTradingSystems
Codice PTS Demand Index di Precision Trading Systems Il Demand Index è stato creato da James Sibbet e utilizza un codice complesso per semplificare l'interpretazione del volume e del prezzo come combinazione. Comprendere i volumi non è mai un compito facile, ma questo bellissimo pezzo di programmazione certamente rende tutto più facile. Ci sono diversi modi in cui questo indicatore può essere vantaggioso per trader e investitori. Divergenze (Come indicatore principale) Dopo aver stu
Filtro:
Nessuna recensione
Rispondi alla recensione