• Panoramica
  • Recensioni (4)
  • Commenti (1)
  • Novità

Rule Plotter

5

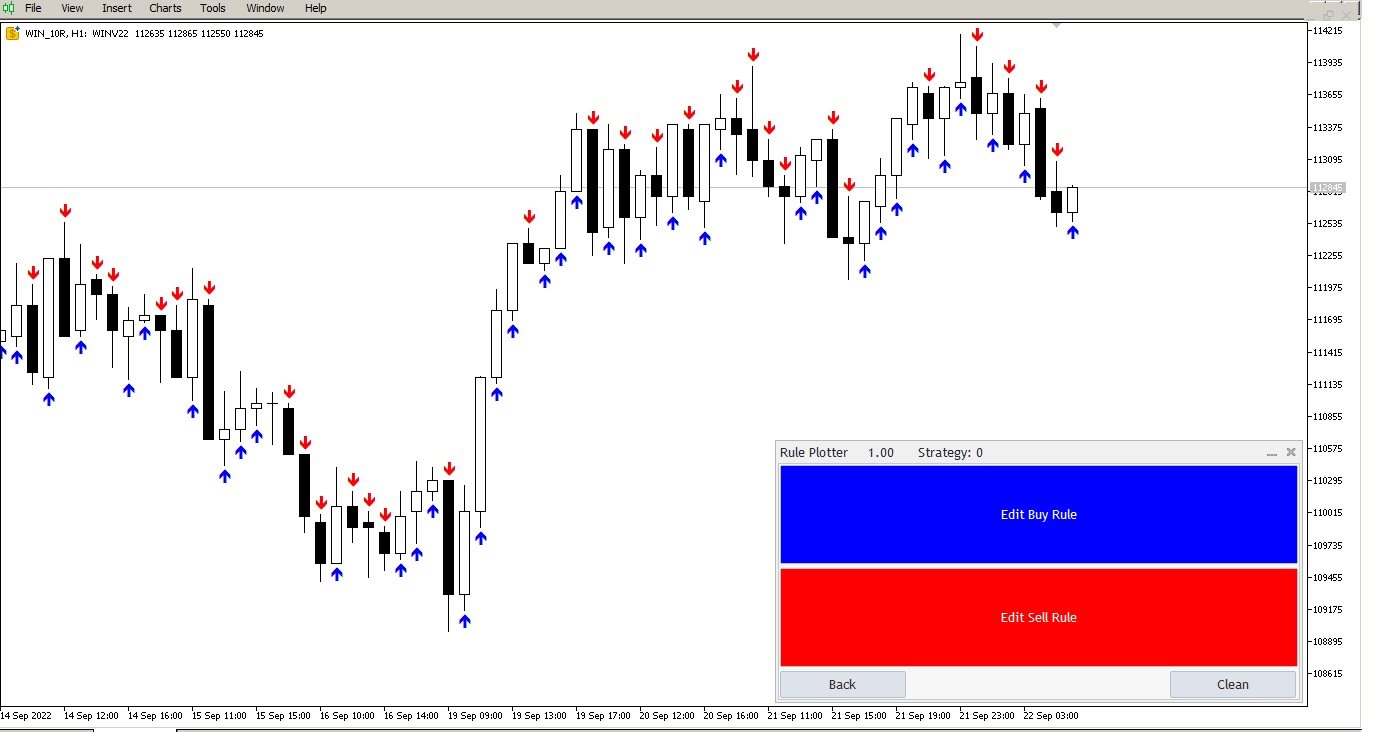
Costruisci la Tua Strategia da Solo

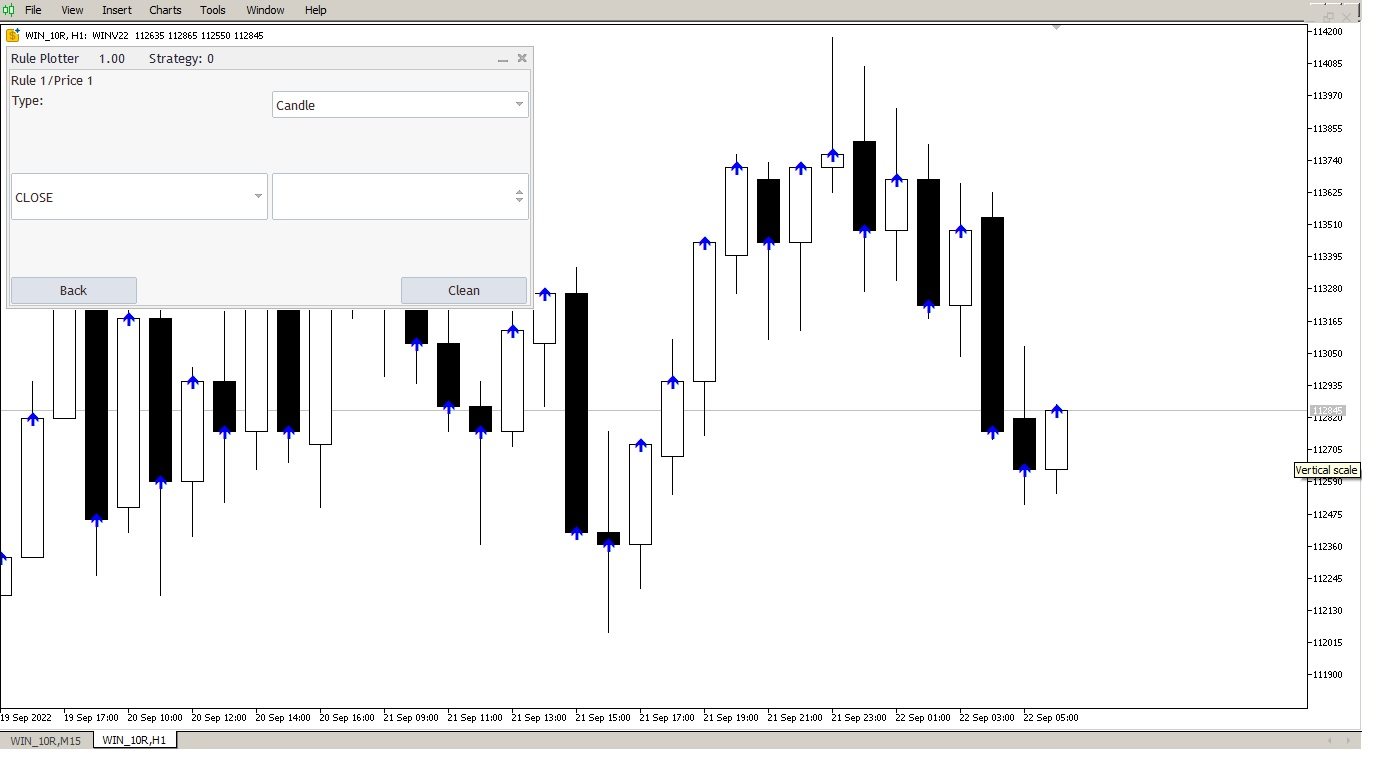
Questo strumento ti permette di sviluppare le tue strategie utilizzando tutti gli indicatori disponibili nativamente in MetaTrader e tutti gli indicatori scaricati da internet che utilizzano i buffer per visualizzare i dati sullo schermo.

Questo strumento è un altro motivo per considerare MetaTrader per automatizzare le tue strategie di trading. Con esso, puoi creare i tuoi segnali di strategia in modo semplice e intuitivo, utilizzando qualsiasi indicatore di MetaTrader.

Come Posso Sapere se il Mio Indicatore Scaricato da Internet Utilizza i Buffer?

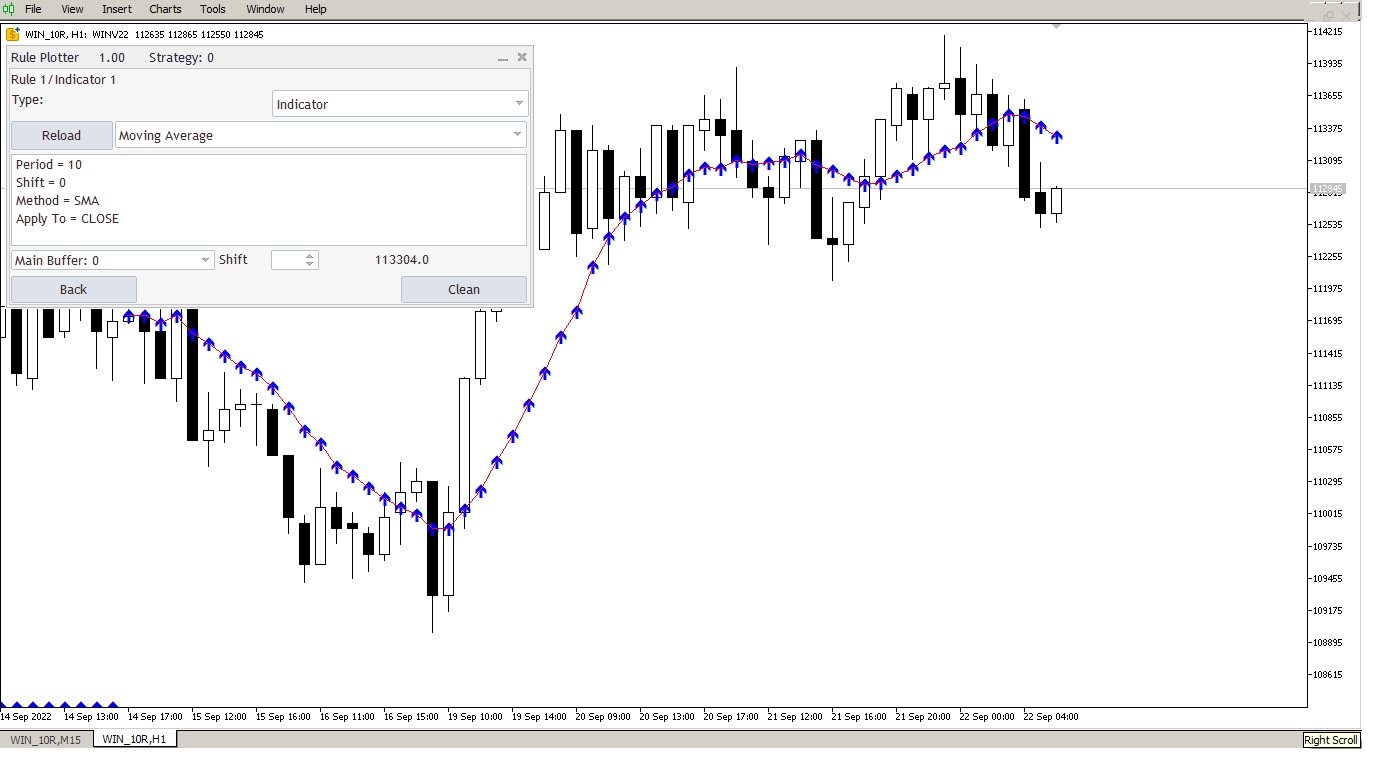
È semplice, basta eseguire questo strumento e scoprirà automaticamente tutti i buffer che il tuo indicatore ha, rendendoli disponibili per creare strategie basate su di essi.

Questo strumento può identificare automaticamente se i tuoi indicatori hanno buffer e quanti buffer di dati hanno. Tutto ciò che devi fare è associare i buffer ai valori corretti.

Gli indicatori nativi di MetaTrader come la Media Mobile, l'RSI, lo Stocastico e il MACD, ecc., sono incredibilmente facili da usare, poiché hanno già buffer integrati. Tuttavia, quando si tratta di indicatori personalizzati scaricati da Internet, è importante sapere a quale buffer si riferisce ciascun dato. Iniziamo dall'inizio.

Impara a Usare le Scorciatoie Tastiera Native di MetaTrader:

Scorciatoia Descrizione
CTRL+F Per attivare il mirino sul tuo mouse e identificare con precisione a quale candela ti stai riferendo.
CTRL+D Per visualizzare la finestra dei dati dei buffer degli indicatori.
CTRL++ Per ingrandire le candele.
CTRL+G Per mostrare la griglia sul grafico di MetaTrader. Questo funziona perfettamente in combinazione con lo zoom massimo del grafico, permettendoti di sapere esattamente a quale candela si riferisce il buffer.

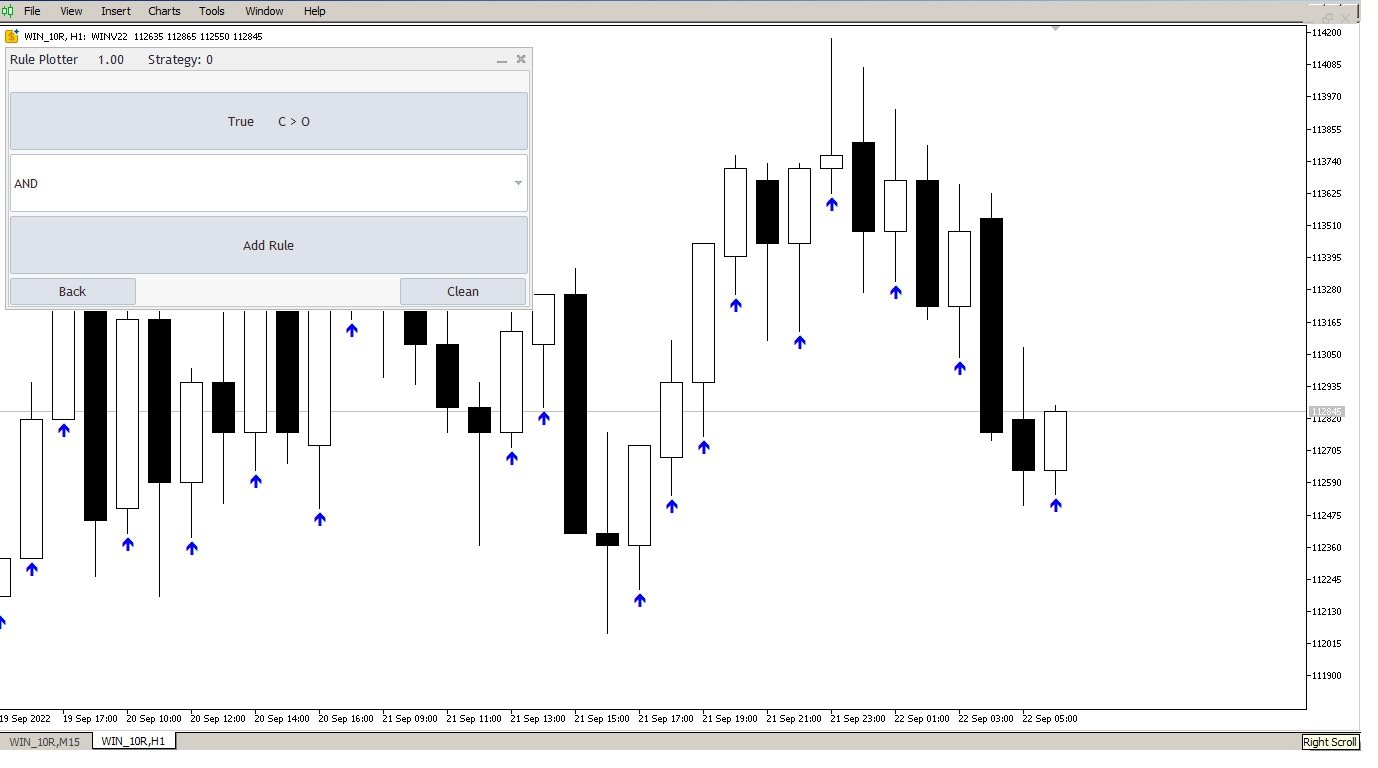
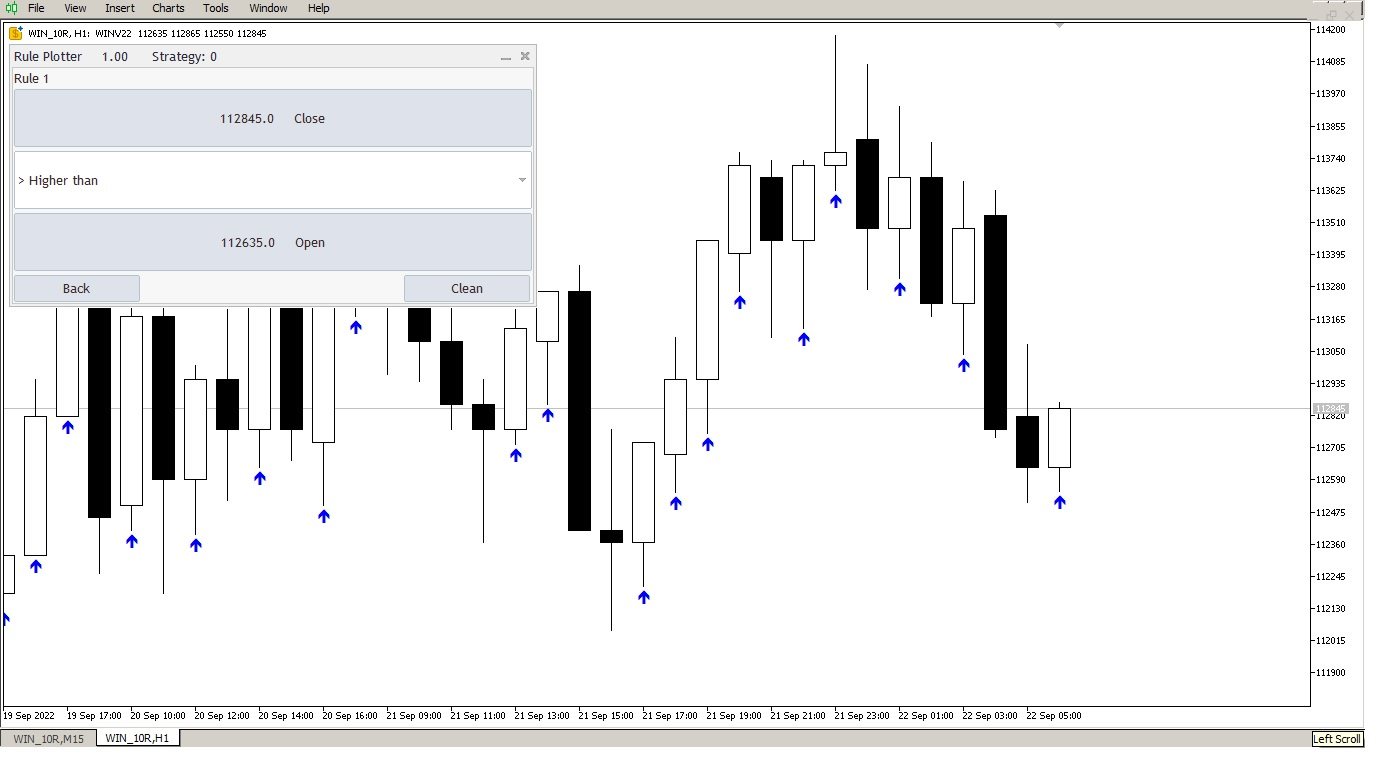
Ora che sei familiare con le scorciatoie di MetaTrader, sarà più facile identificare a quale buffer si riferisce il tuo indicatore. Con la finestra dei dati (CTRL+D) aperta, puoi associare facilmente i dati a ciascun buffer.

Potrebbe sembrare complicato all'inizio, ma con pazienza nell'associazione dei buffer e dei valori, puoi lavorare con tutti i buffer di tutti gli indicatori di Internet, compresi i buffer nascosti come i buffer di colore e i buffer di calcolo dell'indicatore.

Costruisci Strategie Basate sui Colori dell'Indicatore

Scoprire i buffer di colore o i calcoli nascosti è sempre stata una sfida, e il modo più semplice era contattare lo sviluppatore. Ma ora, devi solo associare il numero del buffer al colore che vedi sullo schermo e costruire le tue strategie basate anche sui colori dell'indicatore.

Conversione da Indicatori di Oggetti a Buffer

Attualmente, forniamo compatibilità solo agli indicatori che utilizzano buffer per presentare i dati. Ci sono indicatori che presentano dati in oggetti, ma non abbiamo ancora compatibilità con questi. Tuttavia, non preoccuparti, la maggior parte degli indicatori di MetaTrader è progettata considerando l'uso dei buffer, poiché è così che gli Esperti accedono ai dati degli indicatori.

Ma se desideri davvero che il tuo indicatore preferito abbia i dati in formato di buffer anziché oggetti, puoi semplicemente assumere un professionista nell'ambito dei freelance per convertire questi indicatori, e inizieranno a funzionare qui.

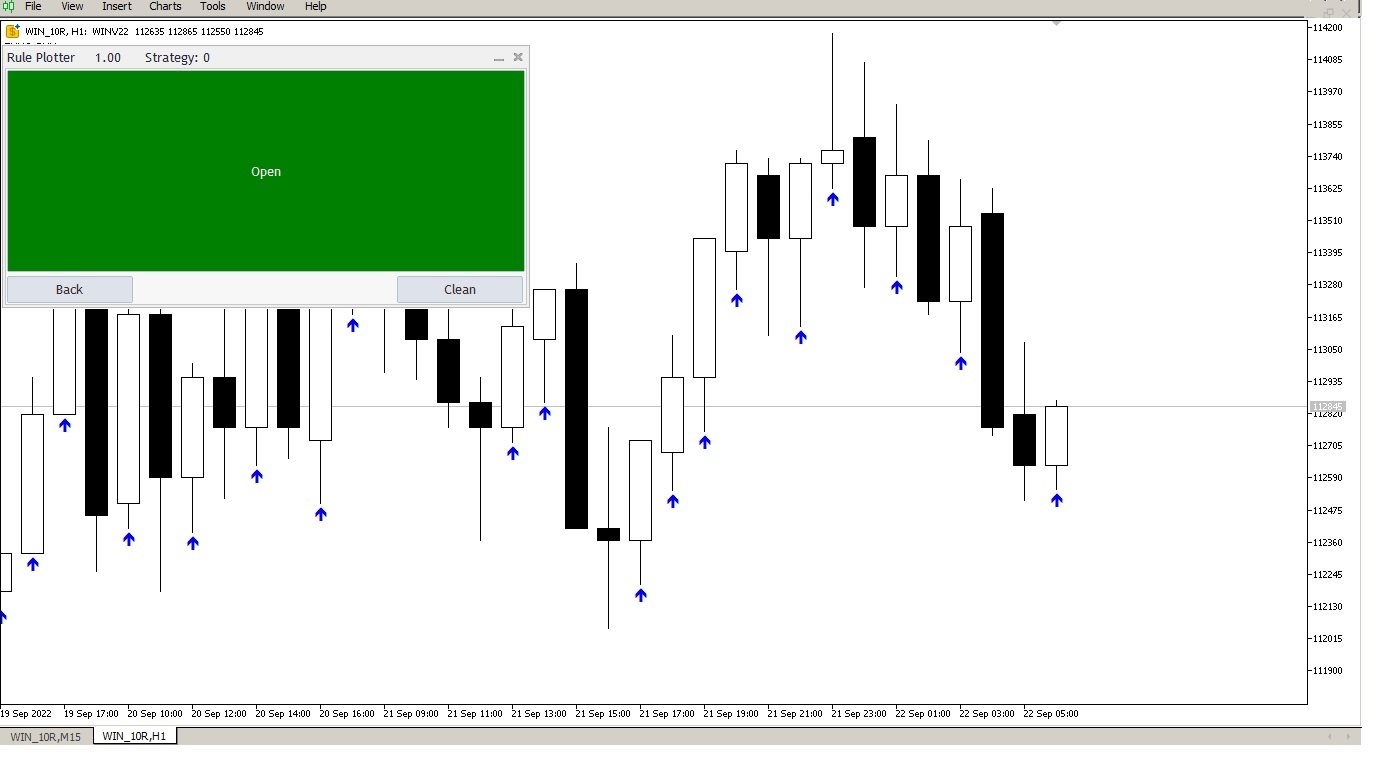
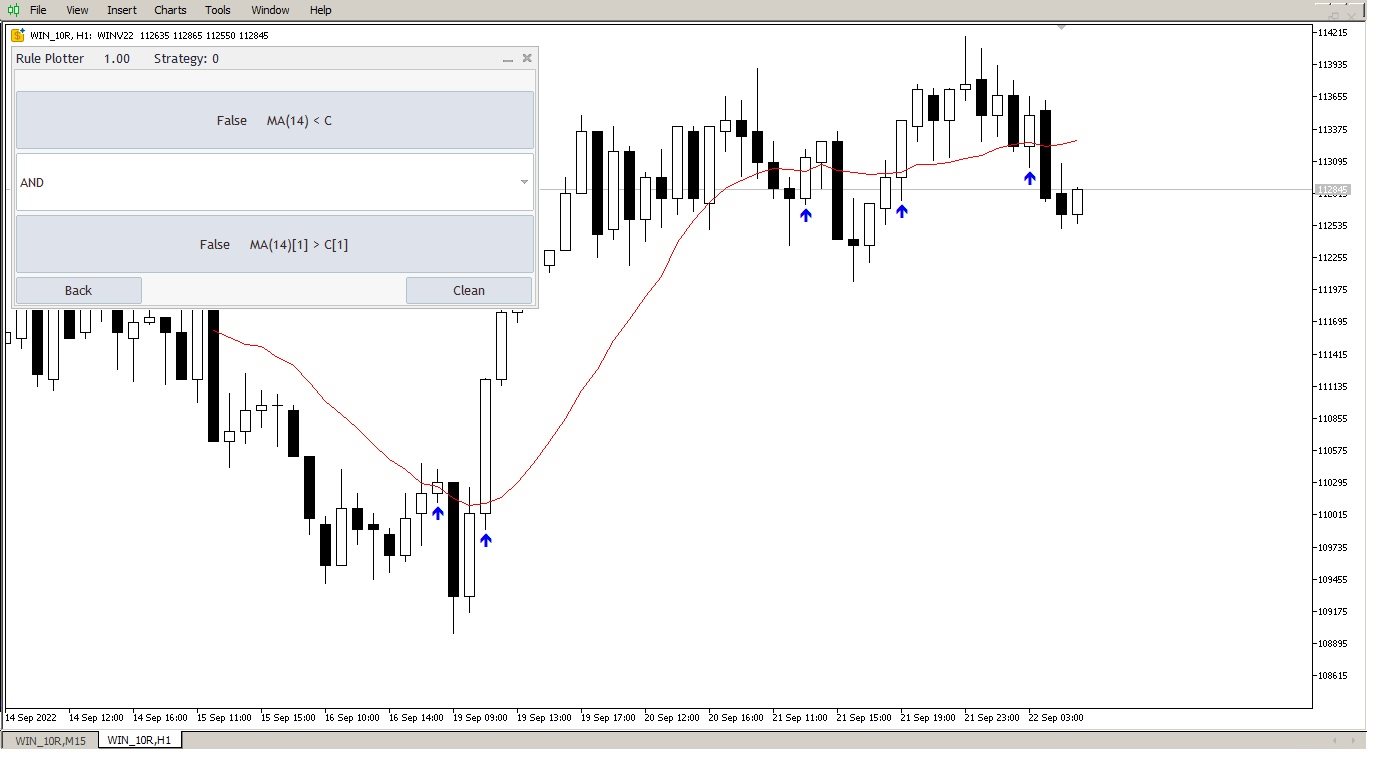
Costruisci Quante Strategie Desideri.

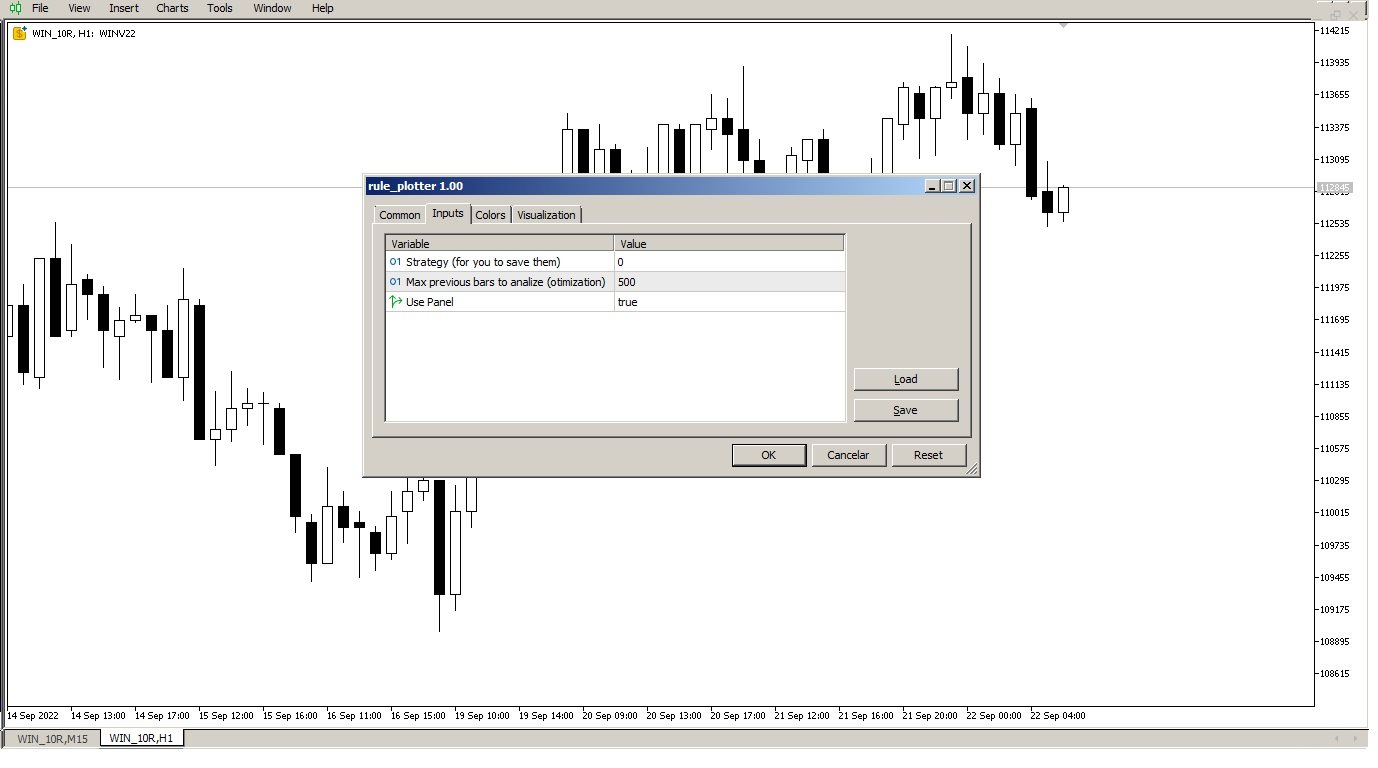
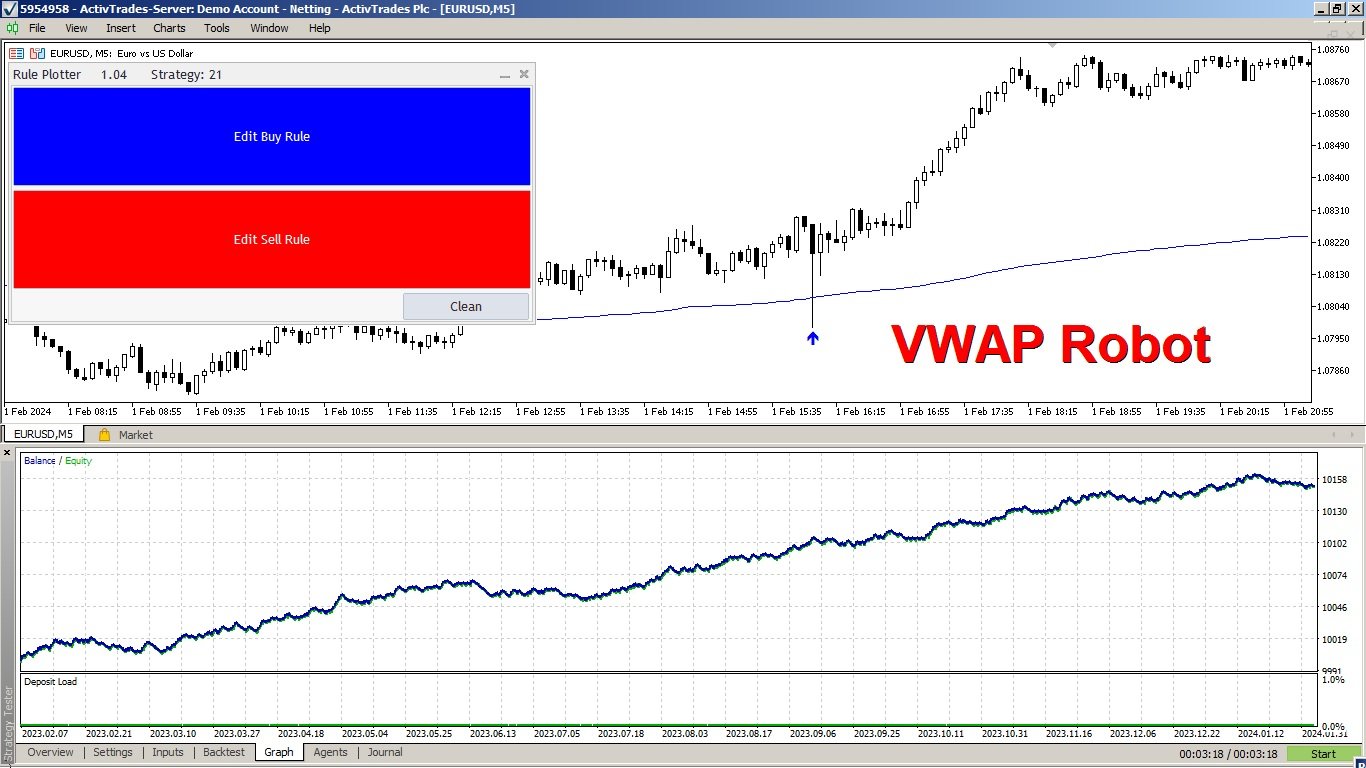
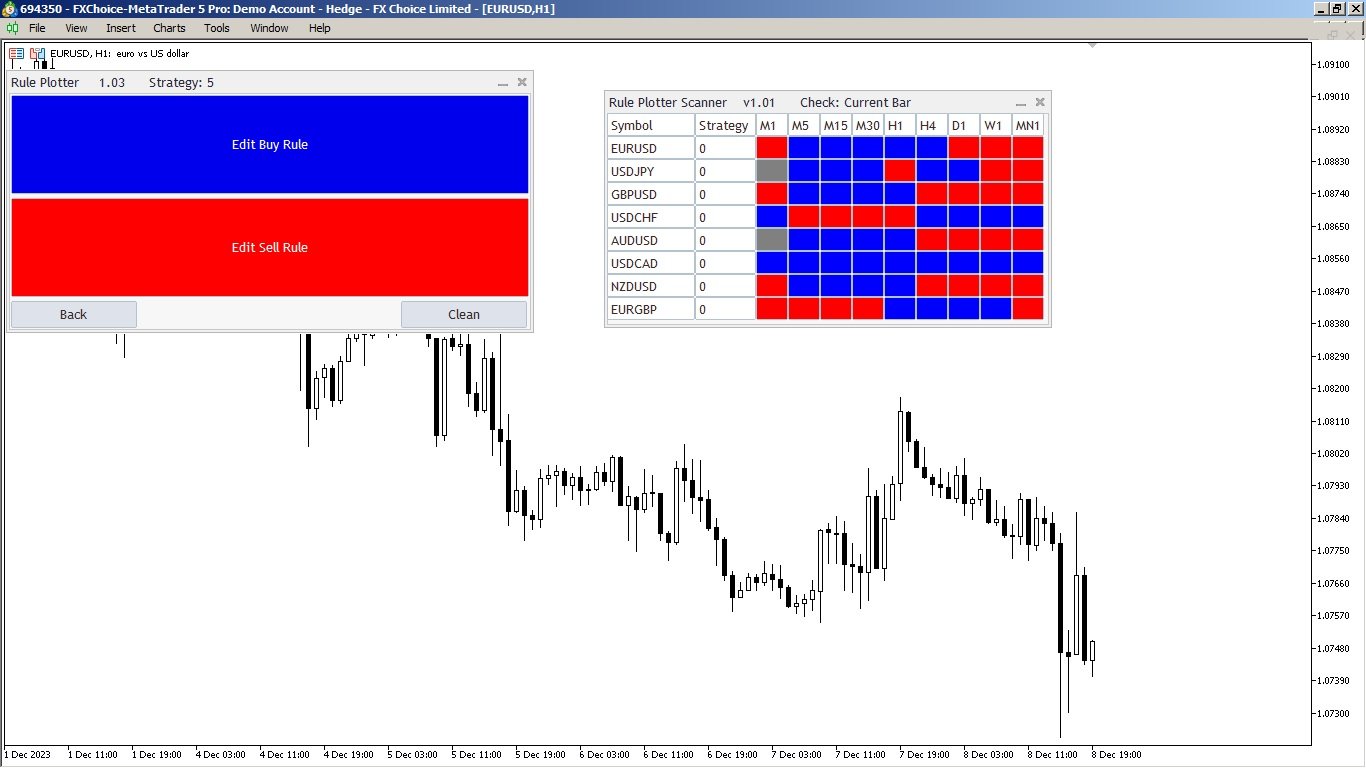
Il nostro strumento ti consente di impostare quante strategie desideri, associandole a numeri, come la strategia predefinita (numero 0), ma puoi registrare altre strategie con numeri 1, 2, 3, 4, e così via. Non limitarti a una singola strategia. Divertiti a costruire la tua base personale di strategie.

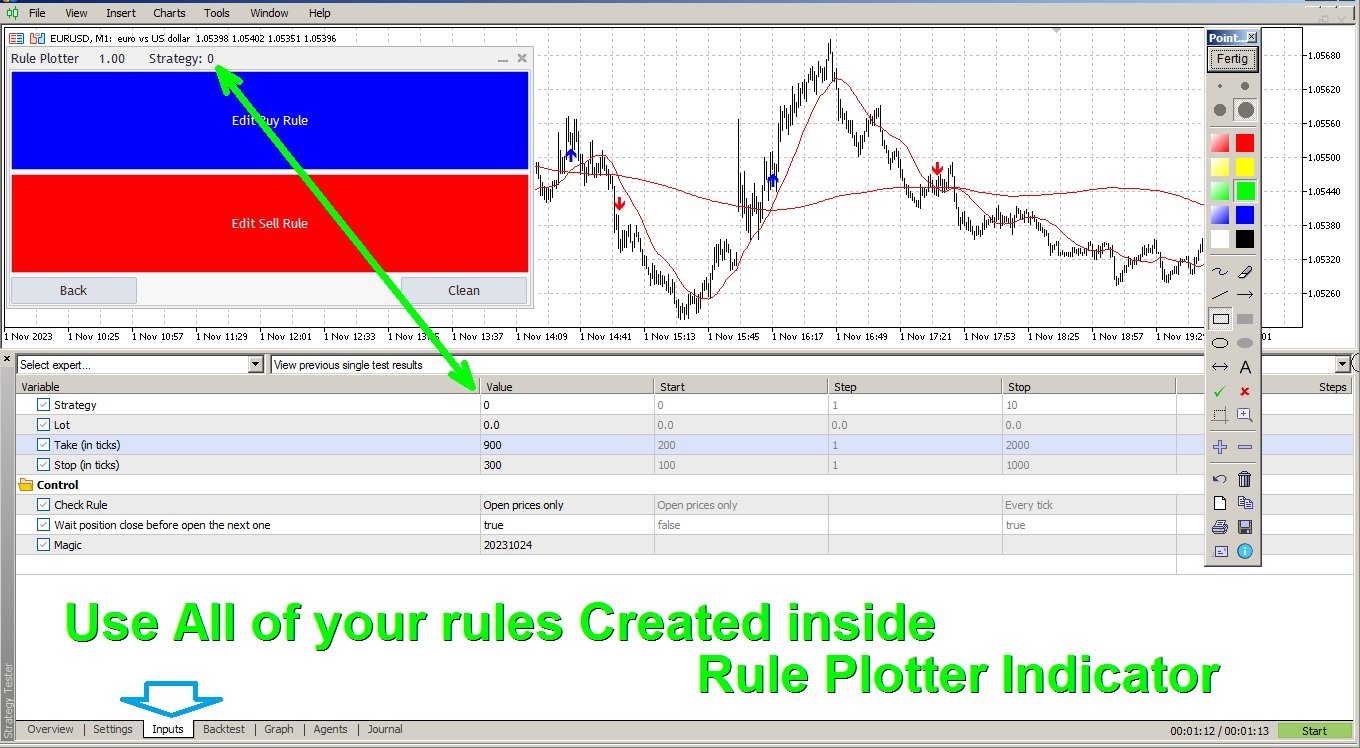
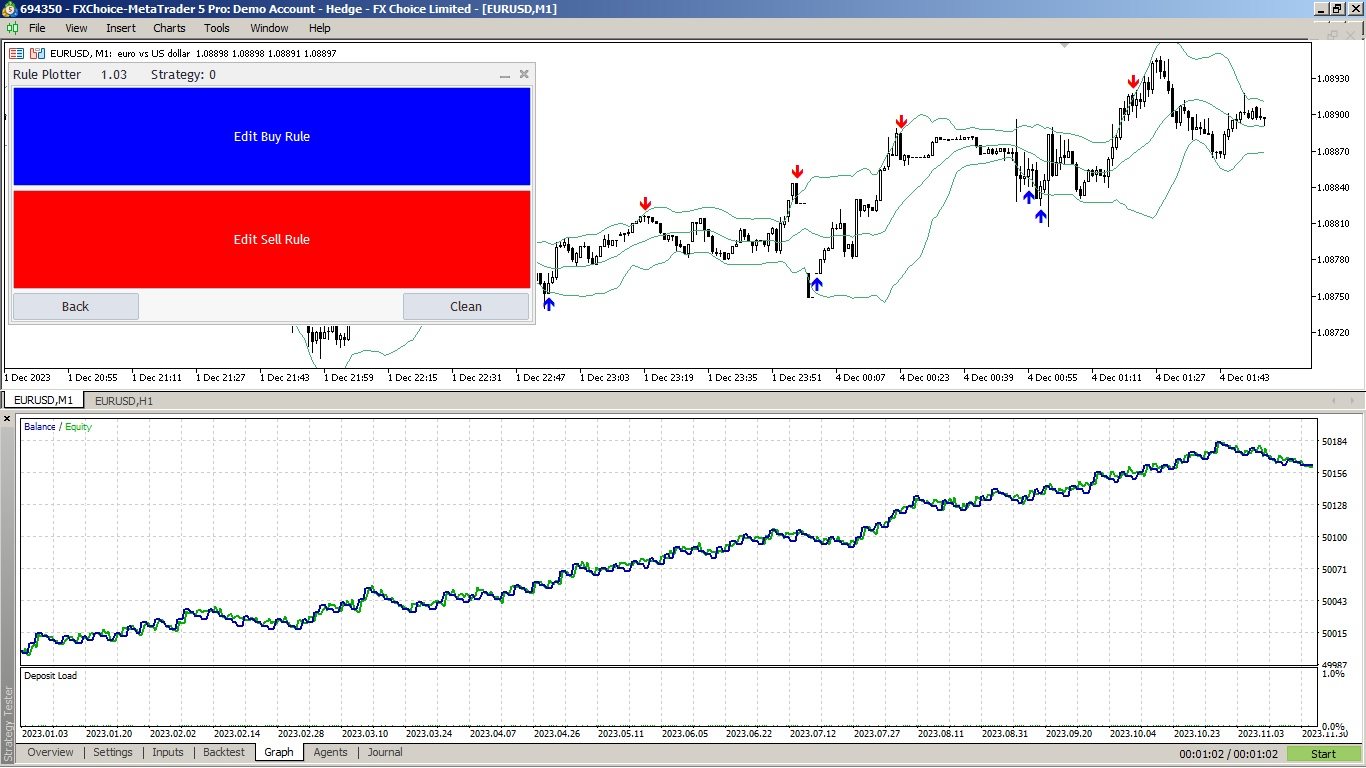
Puoi iniziare subito, e le tue strategie saranno utilizzate in un Expert Advisor che stiamo ancora sviluppando. Pertanto, vorremmo che ci seguissi per rimanere informato sul lancio dell'Expert Advisor, che ti consentirà di utilizzare tutte le strategie create nel magnifico tester di strategie di MetaTrader.


Fammi sapere nei commenti se questo strumento è facile o difficile da utilizzare.

Link al mio profilo: Sviluppatore di Rule Plotter Francisco Gomes.

Testa la tua strategia nel tester di strategia utilizzando l'Esperto Rule Plotter

Recensioni 4
Elsier Jimenez
46
Elsier Jimenez 2024.04.07 23:29 
 

Excelente herramienta para automatizar una estrategia. Felicitaciones al desarrollador.

Moeen Ghiyas
299
Moeen Ghiyas 2024.03.10 09:30 
 

It's an excellent indicator, though difficult to understand initially as it took me a few days to comprehend. Anyhow your effort and idea are highly appreciated. ...... It needs little improvement as at present it does not provide nesting (use of parenthesis within rules for logical AND /OR operations), the same is available in Math Operation but misses logical AND / OR operation there as well. Suggested improvement will make it awesome, but I will still give it 5-star rating based on your idea and effort.

MickeBo
120
MickeBo 2024.03.02 19:35 
 

I highly recommend this tool and I'm glad to be able to use it! The purpose of this tool is to enter and save an existing strategy in order to then receive current entry signals in the form of arrows during operation according to the parameters I previously entered. It took me a while at the beginning to understand how to enter the parameters and I had a lot of help from Francisco, thank you very much for that! Once everything was entered and saved, everything worked perfectly. I receive entry arrows according to my strategy and I am very happy about this as it makes trading much clearer and easier for me. I don't want to miss it anymore, a really great tool that's worth trying. It is also possible to do a backtest with the saved parameters using the Rule Plotter EA and thus test the entered strategy - what more could you want? I can also highly recommend Francisco, his programming is flawless, he is very helpful and patient and I will always be happy to come back to him if there is a need for an indicator or an EA. Thank you, Francisco, for everything!!

Prodotti consigliati
General Clock
Fernando Lahude Ritter
A Simple clock that on the left side "Time" shows r espectively the TimeCurrent, followed beneath by the TimeLocal. On the right hand side we have the remaining minutes and seconds of the current candle. TimeLocal is synced every 500 miliseconds however, the TimeCurrent and the time left on the candle are synced every tick, so this can lead to inconsistencies on the readings so keep that in mind. This indicator have no plots or buffers so it cannot be used in any time based EA.
FREE
Nyse Usdxy
Mitchell Dean Ede
Displays a USD DXY chart in a seperate window below the main chart. YOUR BROKER MUST HAVE THESE SYMBOLS FOR THE INDICATOR TO WORK Based on EUR/USD, USD/JPY, GBP/USD, USD/CAD, USD/CHF and USD/SEK All these pairs must be added to Market Watch for the indicator to work correctly As this is calculated using a formula based on the 6 pairs it will only work when the market is open. YOUR BROKER MUST HAVE THESE SYMBOLS FOR THE INDICATOR TO WORK Displays a USD DXY chart in a seperate window below the
FREE
Color Trend
Bruno Goncalves Mascarenhas
Combining the best of Price Action , Directional Movement , and Divergence / Convergence analysis, the Candle Color Trend is the easy and reliable way to identify the direction of the trend. The indicator automatically paints the candles according to the premise that the upward trend is defined by prices that form a series of ascending tops and bottoms. On the other hand, the downward trend is defined by prices that form a series of descending tops and bottoms. Color Trend is certainly one
FREE
Standard PVSR
Ashok Kumar Singha
Standard PVSR is based on Pivot Points. Steps to Setup the Indicator: Install the Custom Indicator; Set all the Lines Color, Width and Styles; Set visualization to All Timeframe; and DONE It can be used for: All Pairs: Forex, Cryptocurrencies, Metals, Stocks, Indices etc. All Timeframe All Brokers All type of Trading Style like Scalping, Swing, Intraday, Short-Term, Long-Term etc. Multiple Chart -->> For any Type of Support, Guidance, Setup Issue, EA Optimization, Input Setup etc.
FREE
This indicator uses a different approach from the previous version to get it's trendlines. This method is derived from Orchard Forex, and the process of making the indicator is demonstrated in there video   https://www.youtube.com/watch?v=mEaiurw56wY&t=1425s . The basic idea behind this indicator is it draws a   tangent line   on the highest levels and lowest levels of the bars used for calculation, while ensuring that the lines don't intersect with the bars in review (alittle confusing? I kno
FREE
The indicator is designed for displaying the following price levels on the chart: Previous day's high and low. Previous week's high and low. Previous month's high and low. Each of the level types is customizable. In the indicator settings, you set line style, line color, enable or disable separate levels. Configurations ----Day------------------------------------------------- DayLevels   - enable/disable previous day's levels. WidthDayLines   - line width of daily levels. ColorDayLines   - lin
FREE
Il Catturatore di Tendenza: La Strategia del Catturatore di Tendenza con Indicatore di Allarme è uno strumento versatile di analisi tecnica che aiuta i trader a identificare le tendenze di mercato e i potenziali punti di ingresso e uscita. Presenta una Strategia dinamica del Catturatore di Tendenza, adattandosi alle condizioni di mercato per una chiara rappresentazione visiva della direzione della tendenza. I trader possono personalizzare i parametri in base alle loro preferenze e tolleranza
FREE
This Mt5 Indicator Signals when there is two opposite direction bars engulfed by current bar.  has a recent Exponential Moving Average Cross and past bar was oversold/bought Expert Advisor Available in Comments  Free Version Here : https://www.mql5.com/en/market/product/110114?source=Site&nbsp ; Full Alerts for mt5 terminal , phone , email, print to file, print to journal  Buy Signal ( blue line ) Past ema cross ( set at 30 bars back ) Past bar rsi is oversold ( level 40  ) Engulfing bar closes
FREE
"Hunttern harmonic pattern finder" base on the dynamic zigzag with the notification and prediction mode This version of the indicator identifies 11 harmonic patterns and predicts them in real-time before they are completely formed. It offers the ability to calculate the error rate of Zigzag patterns depending on a risk threshold. It moreover sends out a notification once the pattern is complete. The supported patterns: ABCD BAT ALT BAT BUTTERFLY GARTLEY CRAB DEEP CRAB CYPHER SHARK THREE
FREE
Sessions are very important in trading and often good area where to look for setup. In SMC, ICT we will look for Asian session to serve as liquidity This indicator displays: High & Low of the Asia session Midnight New York time opening line Congifuration Line Style, color Label position, size, color Start of the level (Start of the day, Start of the session, Highest or Lowest point in the session) Any questions or comments, send me a direct message here  https://www.mql5.com/en/users/mvonl
FREE
HammerStar
Arismario Verissimo Neves
3.14 (7)
The HammerStar indicator is designed to search for the Hammer and Shooting Star patterns on charts of any currency pairs. Hammer Downward trend. The lower shadow is not less than 2 and no more than 3 times larger than the body. There is no upper shadow, or it is very short (no more than 10% of the candlestick range). The color of the body in the long game is not important, with the short - white hammer is much stronger than the black one. Confirmation is suggested. Shooting Star Uptrend.
FREE
Reversal Composite Candles
MetaQuotes Ltd.
3.43 (23)
The idea of the system is to indentify the reversal patterns using the calculation of the composite candle. The reversal patterns is similar to the "Hammer" and "Hanging Man" patterns in Japanese candlestick analysis. But it uses the composite candle instead the single candle and doesn't need the small body of the composite candle to confirm the reversal. Input parameters: Range - maximal number of bars, used in the calculation of the composite candle. Minimum - minimal size of the composite can
FREE
Dark Bands MT5
Marco Solito
4.89 (192)
Dark Bands   is an Indicator for intraday trading. This Indicator is based on Counter Trend  strategy but use also Volatility. We can enter in good price with this Indicator, in order to follow the inversions on the current instrument. Key benefits Easily visible take profit/stop loss lines Reliable bands lines with futuristic colors, and  Intuitive directional arrows Useful statistics , which indicate the win rate of the signals Plus Package  available, leave a feedback to receive it for
FREE
Blahtech Moving Average indicator is a multitimeframe version of the standard Moving Average indicator. It is also enhanced with customisable alerts, period breaks and other configuration options. The 50 day and 200 day moving averages are widely followed by investors and traders, with breaks above and below the MA lines considered to be signals of interest. Links [  Install  |  Update  |   Training   |   All Products  ] Feature Highlights Up to three timeframes Configurable calculation variab
FREE
Free automatic Fibonacci is an indicator that automatically plots a Fibonacci retracement based on the number of bars you select on the BarsToScan setting in the indicator. The Fibonacci is automatically updated in real time as new highest and lowest values appears amongst the selected bars. You can select which level values to be displayed in the indicator settings. You can also select the color of the levels thus enabling the trader to be able to attach the indicator several times with differe
FREE
Inside Bar Radar
Flavio Javier Jarabeck
4.67 (6)
The Inside Bar pattern is a very well known candlestick formation used widely by traders all over the world and in any marketplace. This approach is very simple and adds a little confirmation candle, so it adds a third past candlestick to the count to confirm the direction of the move (upward or downward). Obviously, there is no power on this candlestick formation if the trader has no context on what it is happening on the market he/she is operating, so this is not magic, this "radar" is only a
FREE
QuantumAlert Stoch Navigator is a free indicator available for MT4/MT5 platforms, its work is to provide "alerts" when the market is inside "overbought and oversold" regions in the form of "buy or sell" signals. This indicator comes with many customization options mentioned in the parameter section below, user can customise these parameters as needful. Join our   MQL5 group , where we share important news and updates. You are also welcome to join our private channel as well, contact me for the p
FREE
QuantumAlert CCI Navigator is a free indicator available for MT4/MT5 platforms, its work is to provide "alerts" when the market is inside "overbought and oversold" regions in the form of "buy or sell" signals. This indicator comes with many customization options mentioned in the parameter section below, user can customise these parameters as needful. Join our   MQL5 group , where we share important news and updates. You are also welcome to join our private channel as well, contact me for the pri
FREE
PZ Three Drives MT5
PZ TRADING SLU
3.11 (9)
This indicator finds Three Drives patterns. The Three Drives pattern is a 6-point reversal pattern characterised by a series of higher highs or lower lows that complete at a 127% or 161.8% Fibonacci extension. It signals that the market is exhausted and a reversal can happen. [ Installation Guide | Update Guide | Troubleshooting | FAQ | All Products ] Customizable pattern sizes Customizable colors and sizes Customizable breakout periods Customizable 1-2-3 and 0-A-B ratios It implements visua
FREE
TilsonT3
Jonathan Pereira
Tillson's T3 moving average was introduced to the world of technical analysis in the article ''A Better Moving Average'', published in the American magazine Technical Analysis of Stock Commodities. Developed by Tim Tillson, analysts and traders of futures markets soon became fascinated with this technique that smoothes the price series while decreasing the lag (lag) typical of trend-following systems.
FREE
Envelopes Clouds
Samuel Manoel De Souza
The Indicator indicator draws 2 clouds based on Envelopes indicator values. The upper cloud is formed by the upper lines values and the lower cloud by the lowers lines values. The indicator allows to change the Envelopes parameters and the clouds colors the period of the base line and the deviations of each Envelopes instance. The indicator holds 5 buffer index as follow: [0] - Outer values of the upper cloud [1]  - Inner values of the upper cloud [2]  - Base/Center line values [3]  - Inner valu
FREE
PANEL OF TOPOS AND HISTORICAL BACKGROUNDS   This is a panel that does not open orders only manages all Symbols and calculates the tops and bottoms and presents the calculation in relation to the top and bottom in 5 Years, 2 Months and 1 Week. It is ideal for filtering the pairs that are in the good regions to operate. You can filter the range and choose whether to consider the body or shadow of the candle in the monthly. Good luck...
FREE
Virtual Targets MT5
Hoang Van Dien
4.71 (7)
This indicator is very useful for day traders or short term traders. (MT5 version) No need to calculate the number of pips manually, just look at the chart and you will see the Virtual Take Profit / Virtual Stop Loss target line and evaluate whether the entry point is feasible to reach the intended target or not. Enter the intended   Take Profit / Stop Loss   pips for your trade. The indicator will display   Virtual Take Profit / Virtual Stop Loss   lines for you to easily see if the target i
FREE
Supertrend Line
Flavio Javier Jarabeck
4.86 (14)
The Supertrend indicator was originally created by a french fellow named Olivier Seban , and its goal is to identify the Primary Trend of prices . Its calculation is easy and based on the average of Highs and Lows and then we add the volatility of a custom period, plus a multiplier. This way we get the Supertrend Line. You can find in the web several approaches and trading strategies using this very useful indicator. HOW TO "READ" THIS INDICATOR If the closing prices are above Supertrend Line
FREE
Graphic Alignment Context
Ricardo Alexandre Laurentino
The Graphic Alignment Context (GAC) Technical Indicator measures the vertical difference of the simple average price of a financial instrument in the context of three different timeframes determined by a defined number of bars or candles (periods) to determine the strength of the buy or sell trend. sale. Ascending average prices indicate Buying strength (1), Descending average prices indicate Selling strength (-1) and any scenario different from the previous two conditions indicates Neutrality
FREE
Alert System
Nguyen Thanh Sang
5 (3)
Alert System You use function keys to create horizontal lines for alerts. 1. Allow set horizontal line properties (line color, line style, line width, ...) for alerts. 2. Allow add text to horizotanl line. You can hide or show text when you need. You can change text and its price, but time of text will be set in input named "text_time" (0 is current time, you should test this input with -1, -2, -3 or lower). 3. It has 2 types of alert: above and bellow. You can set key to create them. If price i
FREE
PZ Chart Overlay MT5
PZ TRADING SLU
4.5 (2)
The Chart Overlay indicator displays the price action of several instruments on the same chart allowing you to evaluate how differently currency pairs fluctuate relative to each other.  [ Installation Guide | Update Guide | Troubleshooting | FAQ | All Products ] Find overbought or oversold currency pairs easily Plot up to six currency pairs overlayed on the same chart Display inverted symbols if necessary Adapt to chart size, zoom and timeframe Automatic price level calculation Customizable p
FREE
Time Session OPEN-HIGH-LOW-CLOSE This Indicator Will Draw Lines Of OHLC Levels Of Time Session Defined By User. It Will Plot Floating Lines On Current Day Chart. Time Session Can Of Current Day Or Previous Day. You Can Plot Multiple Session Lines By Giving Unique ID To Each Session. It Can Even Show Historical Levels Of Time Session Selected By User On Chart To Do Backdating Test. You Can Write Text To Describe The Lines.
FREE
Description. The basis for the formation of the Renko chart is the price range. If the price goes beyond its limits, the chart shows a box above or below the previous one. As a result, we see price movement without additional "noise" and important support and resistance levels. Features. For use in conjunction with the Expert Advisor, an additional buffer is implemented-a box counter. For convenience and to increase the speed of testing, the user can use the "new box" event, which the indicato
FREE
Basic Harmonic Pattern MT5
Mehran Sepah Mansoor
4.77 (44)
Questo indicatore identifica i   pattern armonici   più popolari che predicono i punti di inversione del mercato. Questi modelli armonici sono formazioni di prezzo che si ripetono costantemente nel mercato forex e suggeriscono possibili movimenti di prezzo futuri /   Versione MT4 gratuita Inoltre, questo indicatore è dotato di un segnale di entrata nel mercato e di vari take profit e stop loss. Va notato che, sebbene l'indicatore di pattern armonico possa fornire segnali di acquisto/vendita d
FREE
Gli utenti di questo prodotto hanno anche acquistato
Atomic Analyst MT5
Issam Kassas
5 (12)
Innanzitutto, vale la pena sottolineare che questo indicatore di trading non è repaint, non è ridisegno e non presenta ritardi, il che lo rende ideale sia per il trading manuale che per quello automatico. L'Analista Atomico è un indicatore di azione del prezzo PA che utilizza la forza e il momentum del prezzo per trovare un miglior vantaggio sul mercato. Dotato di filtri avanzati che aiutano a rimuovere rumori e segnali falsi, e aumentare il potenziale di trading. Utilizzando più strati di in
Innanzitutto è importante sottolineare che questo sistema di trading è un indicatore Non-Repainting, Non-Redrawing e Non-Lagging, il che lo rende ideale sia per il trading manuale che per quello automatico. Il "Sistema di Trading Smart Trend MT5" è una soluzione completa pensata sia per i trader principianti che per quelli esperti. Combina oltre 10 indicatori premium e offre più di 7 robuste strategie di trading, rendendolo una scelta versatile per diverse condizioni di mercato. Strategia di Tre
FX Volume MT5
Daniel Stein
4.94 (17)
Ricevi il tuo aggiornamento quotidiano sul mercato con dettagli e schermate tramite il nostro Morning Briefing qui su mql5 e su Telegram ! FX Volume è il PRIMO e UNICO indicatore di volume che fornisce una visione REALE del sentiment del mercato dal punto di vista del broker. Fornisce informazioni straordinarie su come gli operatori di mercato istituzionali, come i broker, sono posizionati sul mercato Forex, molto più velocemente dei rapporti COT. Vedere queste informazioni direttamente sul vo
Quantum Trend Sniper
Bogdan Ion Puscasu
5 (38)
Presentazione       Quantum Trend Sniper Indicator   , l'innovativo indicatore MQL5 che sta trasformando il modo in cui identifichi e scambi le inversioni di tendenza! Sviluppato da un team di trader esperti con un'esperienza di trading di oltre 13 anni,       Indicatore Quantum Trend Sniper       è progettato per spingere il tuo viaggio di trading verso nuove vette con il suo modo innovativo di identificare le inversioni di tendenza con una precisione estremamente elevata. *** Acquista Quant
Gold Stuff mt5
Vasiliy Strukov
4.89 (170)
Gold Stuff mt5 è un indicatore di tendenza progettato specificamente per l'oro e può essere utilizzato anche su qualsiasi strumento finanziario. L'indicatore non ridisegna e non è in ritardo. Periodo consigliato H1. Contattami subito dopo l'acquisto per avere le impostazioni e un bonus personale!   IMPOSTAZIONI Disegna freccia - acceso spento. disegnando frecce sul grafico. Avvisi: avvisi acustici disattivati. Notifica e-mail - on off. notifiche di posta elettronica. Notifica Puch - on of
Presentazione       Quantum Breakout PRO   , l'innovativo indicatore MQL5 che sta trasformando il modo in cui scambi le zone di breakout! Sviluppato da un team di trader esperti con un'esperienza di trading di oltre 13 anni,       Quantum Breakout PRO       è progettato per spingere il tuo viaggio di trading a nuovi livelli con la sua strategia innovativa e dinamica della zona di breakout. Quantum Breakout Indicator ti fornirà frecce di segnalazione sulle zone di breakout con 5 zone target
Trend Screener Pro MT5
STE S.S.COMPANY
4.87 (62)
Indicatore di tendenza, soluzione unica rivoluzionaria per il trading di tendenze e il filtraggio con tutte le importanti funzionalità di tendenza integrate in un unico strumento! È un indicatore multi-timeframe e multi-valuta al 100% non ridipingibile che può essere utilizzato su tutti i simboli/strumenti: forex, materie prime, criptovalute, indici e azioni. Trend Screener è un indicatore di tendenza che segue un indicatore efficiente che fornisce segnali di tendenza a freccia con punti nel gra
RelicusRoad Pro MT5
Relicus LLC
4.82 (22)
Ora $ 147 (aumentando a $ 499 dopo alcuni aggiornamenti) - account illimitati (PC o MAC) Manuale utente di RelicusRoad + Video di formazione + Accesso al gruppo Discord privato + Stato VIP UN NUOVO MODO DI GUARDARE IL MERCATO RelicusRoad è l'indicatore di trading più potente al mondo per forex, futures, criptovalute, azioni e indici, fornendo ai trader tutte le informazioni e gli strumenti di cui hanno bisogno per rimanere redditizi. Forniamo analisi tecniche e piani di trading per aiutar
Quantum Heiken Ashi PRO MT5
Bogdan Ion Puscasu
4.5 (8)
Ti presentiamo   Quantum Heiken Ashi PRO Progettate per fornire informazioni chiare sulle tendenze del mercato, le candele Heiken Ashi sono rinomate per la loro capacità di filtrare il rumore ed eliminare i falsi segnali. Dì addio alle confuse fluttuazioni dei prezzi e dai il benvenuto a una rappresentazione grafica più fluida e affidabile. Ciò che rende il Quantum Heiken Ashi PRO davvero unico è la sua formula innovativa, che trasforma i dati tradizionali delle candele in barre colorate di faci
A key element in trading is zones or levels from which decisions to buy or sell a trading instrument are made. Despite attempts by major players to conceal their presence in the market, they inevitably leave traces. Our task was to learn how to identify these traces and interpret them correctly. Reversal First Impulse levels (RFI)   -  Version MT4                  INSTRUCTIONS                 RUS                 ENG                         R ecommended to use with an indicator   -  TREND PRO  
AW Trend Predictor MT5
AW Trading Software Limited
4.77 (56)
La combinazione di trend e livelli di rottura in un unico sistema. Un algoritmo di indicatore avanzato filtra il rumore del mercato, determina la tendenza, i punti di ingresso e i possibili livelli di uscita. I segnali indicatori sono registrati in un modulo statistico, che permette di selezionare gli strumenti più adatti, mostrando l'efficacia dello storico dei segnali. L'indicatore calcola i segni Take Profit e Stop Loss. Manuale e istruzioni ->   QUI   / versione MT4 ->   QUI Come fare tradi
Innanzitutto, vale la pena sottolineare che questo Strumento di Trading è un Indicatore Non-Ridipingente, Non-Ridisegnante e Non-Laggante, il che lo rende ideale per il trading professionale. L'Indicatore Smart Price Action Concepts è uno strumento molto potente sia per i nuovi che per i trader esperti. Racchiude più di 20 utili indicatori in uno solo, combinando idee di trading avanzate come l'Analisi del Trader del Circolo Interno e le Strategie di Trading dei Concetti del Denaro Intelligen
FX Power MT5 NG
Daniel Stein
5 (5)
Ricevi il tuo aggiornamento quotidiano sul mercato con dettagli e schermate tramite il nostro Morning Briefing qui su mql5 e su Telegram ! FX Power MT5 NG è la nuova generazione del nostro popolare misuratore di forza delle valute, FX Power. Cosa offre questo misuratore di forza di nuova generazione? Tutto ciò che avete amato dell'FX Power originale IN PIÙ Analisi della forza di ORO/XAU Risultati di calcolo ancora più precisi Periodi di analisi configurabili individualmente Limite di calcolo pe
Advanced Supply Demand MT5
Bernhard Schweigert
4.53 (15)
La migliore soluzione per qualsiasi principiante o trader esperto! Questo indicatore è uno strumento di trading unico, di alta qualità e conveniente perché abbiamo incorporato una serie di funzionalità proprietarie e una nuova formula. Con questo aggiornamento, sarai in grado di mostrare fusi orari doppi. Non solo potrai mostrare una TF più alta, ma anche entrambe, la TF del grafico, PIÙ la TF più alta: SHOWING NESTED ZONES. Tutti i trader di domanda di offerta lo adoreranno. :) Informazioni imp
TPSproTREND PrO MT5
Roman Podpora
5 (6)
TPSpro TRENDPRO  - is a trend indicator that automatically analyzes the market and provides information about the trend and each of its changes, as well as giving signals for entering trades without redrawing! The indicator uses each candle, analyzing them separately. referring to different impulses - up or down impulse. Exact entry points into transactions for currencies, crypto, metals, stocks, indices!  -  Version MT4                  DETAILED DESCRIPTION        /       TRADING SETUPS       
IX Power MT5
Daniel Stein
5 (2)
IX Power   porta finalmente l'imbattibile precisione di FX Power ai simboli non-Forex. Determina con precisione l'intensità delle tendenze a breve, medio e lungo termine dei vostri indici preferiti, azioni, materie prime, ETF e persino criptovalute. Potete   analizzare tutto ciò che   il vostro terminale ha da offrire. Provatelo e sperimentate come   il vostro tempismo migliori significativamente   durante il trading. Caratteristiche principali di IX Power Risultati di calcolo precisi al
This is arguably the most complete harmonic price formation auto-recognition indicator you can find for the MetaTrader Platform. It detects 19 different patterns, takes fibonacci projections as seriously as you do, displays the Potential Reversal Zone (PRZ) and finds suitable stop-loss and take-profit levels. [ Installation Guide | Update Guide | Troubleshooting | FAQ | All Products ] It detects 19 different harmonic price formations It plots primary, derived and complementary Fibonacci p
Noize Absorption Index - is the manual trading system that measures the difference of pressure between bears forces and bulls forces. Green line - is a noize free index that showing curent situation. Zero value of index shows totally choppy/flat market.Values above zero level shows how powerfull bullish wave is and values below zero measures bearish forces.Up arrow appears on bearish market when it's ready to reverse, dn arrow appears on weak bullish market, as a result of reverse expectation.
MetaForecast M5
Vahidreza Heidar Gholami
5 (2)
MetaForecast predice e visualizza il futuro di qualsiasi mercato basandosi sull'armonia dei dati dei prezzi. Sebbene il mercato non sia sempre prevedibile, se esiste un modello nei prezzi, MetaForecast può prevedere il futuro con la massima precisione possibile. Rispetto ad altri prodotti simili, MetaForecast può generare risultati più accurati analizzando le tendenze di mercato. Parametri di input Past size (Dimensione passata) Specifica il numero di barre che MetaForecast utilizza per creare
ICT, SMC, SMART MONEY CONCEPTS, SMART MONEY, Smart Money Concept, Support and Resistance, Trend Analysis, Price Action, Market Structure, Order Blocks, BOS/CHoCH,   Breaker Blocks ,  Momentum Shift,   Supply&Demand Zone/Order Blocks , Strong Imbalance,   HH/LL/HL/LH,    Fair Value Gap, FVG,  Premium  &   Discount   Zones, Fibonacci Retracement, OTE, Buy Side Liquidity, Sell Side Liquidity, BSL/SSL Taken, Equal Highs & Lows, MTF Dashboard, Multiple Time Frame, BigBar, HTF OB, HTF Market Structure
Was: $249  Now: $99   Market Profile defines a number of day types that can help the trader to determine market behaviour. A key feature is the Value Area, representing the range of price action where 70% of trading took place. Understanding the Value Area can give traders valuable insight into market direction and establish the higher odds trade. It is an excellent addition to any system you may be using. Inspired by Jim Dalton’s book “Mind Over Markets”, this indicator is designed to suit the
Top indicator for MT5   providing accurate signals to enter a trade without repainting! It can be applied to any financial assets:   forex, cryptocurrencies, metals, stocks, indices .  Watch  the video  (6:22) with an example of processing only one signal that paid off the indicator! MT4 version is here It will provide pretty accurate trading signals and tell you when it's best to open a trade and close it. Most traders improve their trading results during the first trading week with the help of
Matrix Arrow Indicator MT5
Juvenille Emperor Limited
5 (14)
Matrix Arrow Indicator MT5   è un trend unico 10 in 1 che segue un indicatore multi-timeframe al   100% non ridipinto   che può essere utilizzato su tutti i simboli/strumenti:   forex ,   materie prime ,   criptovalute ,   indici ,   azioni .  Matrix Arrow Indicator MT5  determinerà la tendenza attuale nelle sue fasi iniziali, raccogliendo informazioni e dati da un massimo di 10 indicatori standard, che sono: Indice di movimento direzionale medio (ADX) Indice del canale delle materie prime (CCI
Gartley Hunter Multi
Siarhei Vashchylka
5 (6)
Gartley Hunter Multi - An indicator for searching for harmonic patterns simultaneously on dozens of trading instruments and on all classic timeframes: (m1, m5, m15, m30, H1, H4, D1, Wk, Mn). Manual (Be sure to read before purchasing) | Version for MT4 Advantages 1. Patterns: Gartley, Butterfly, Shark, Crab. Bat, Alternate Bat, Deep Crab, Cypher 2. Simultaneous search for patterns on dozens of trading instruments and on all classic timeframes 3. Search for patterns of all possible sizes. Fr
Il profitto dalla struttura del mercato cambia quando il prezzo si inverte e si ritira. L'indicatore di avviso di inversione della struttura del mercato identifica quando una tendenza o un movimento di prezzo si sta avvicinando all'esaurimento e pronto a invertire. Ti avvisa dei cambiamenti nella struttura del mercato che in genere si verificano quando stanno per verificarsi un'inversione o un forte pullback. L'indicatore identifica inizialmente i breakout e lo slancio del prezzo, ogni volta
Black Dragon indicator mt5
Ramil Minniakhmetov
4.82 (56)
L'indicatore di rilevamento delle tendenze integrerà qualsiasi strategia e può anche essere utilizzato come strumento indipendente. IMPORTANTE! Contattami subito dopo l'acquisto per ricevere istruzioni e un bonus!  Vantaggi Facile da usare, non sovraccarica il grafico con informazioni non necessarie; Possibilità di utilizzo come filtro per qualsiasi strategia; Ha livelli integrati di supporto e resistenza dinamici, che possono essere utilizzati sia per la presa di profitto che per imposta
Volume by Price MT5
Brian Collard
5 (3)
The Volume by Price Indicator for MetaTrader 5 features Volume Profile and Market Profile TPO (Time Price Opportunity). Get valuable insights out of currencies, equities and commodities data. Gain an edge trading financial markets. Volume and TPO histogram bar and line charts. Volume Footprint charts. TPO letter and block marker charts including split structures. Versatile segmentation and compositing methods. Static, dynamic and flexible ranges with relative and/or absolute visualizations. Lay
Golden Gate Algo MT5
James David Lane
4 (6)
40% DI SCONTO PER NATALE! AUMENTO DEL PREZZO A $250 IL 1 GENNAIO! Presentiamo GoldenGate Entries: una soluzione di trading all'avanguardia! Scopri un approccio rivoluzionario al trading con GoldenGate Entries (GGE), un indicatore avanzato progettato per migliorare la tua esperienza di trading. GGE offre un set completo di funzionalità per fornire agli utenti precisione e fiducia nelle loro decisioni di trading. Coppie: Qualsiasi (FX - Materie prime - Azioni - Azioni - Cripto) TimeFrame
Good day! I present to you a trading technical indicator for Deriv broker synthetic indices. This indicator ONLY works with the following indices: Boom 300 Index Boom 500 Index Boom 1000 Index Crash 300 Index Crash 500 Index Crash 1000 Index The indicator was created to give signals to open medium-term trades in the direction of Spikes. But you can open trades in the opposite direction to Spikes, at your own risk. Trade only on M1. Other TFs do not guarantee the correct operation of the indic
FxaccurateLS
Shiv Raj Kumawat
WHY IS OUR FXACCCURATE LS MT5 THE PROFITABLE ? PROTECT YOUR CAPITAL WITH RISK MANAGEMENT Gives entry, stop and target levels from time to time. It finds Trading opportunities by analyzing what the price is doing during established trends. POWERFUL INDICATOR FOR A RELIABLE STRATEGIES We have made these indicators with a lot of years of hard work. It is made at a very advanced level. Established trends provide dozens of trading opportunities, but most trend indicators completely ignore them!
Altri dall’autore
Supports And Resistances Lines
Francisco Gomes Da Silva
4.78 (40)
Indicatore zone di supporto e resistenza MT5 questo indicatore sa come identificare automaticamente massimi e minimi. Questo indicatore di supporto e resistenza crea linee di supporto e linee di resistenza basate su massimi e minimi. come creare linee di supporto e resistenza. questo è un indicatore per creare linee automatiche di supporto e resistenza. come trovare il livello di supporto con l'indicatore. questo indicatore trova i massimi e i minimi automaticamente. L'indicatore crea automatica
FREE
Sweet VWAP MT5
Francisco Gomes Da Silva
4.36 (14)
Scopri dove le grandi istituzioni stanno facendo trading e ottimizza i tuoi investimenti con l'indicatore gratuito VWAP Ancorato Questo indicatore è progettato per trader esperti nelle strategie VWAP ancorate, offrendo molta velocità nell'analizzare il comportamento del VWAP da specifici punti di ancoraggio con il semplice uso del cursore del tuo mouse. Funzionalità Principali: Ancoraggio del VWAP: La funzione principale di questo indicatore è mostrare come si comporterebbe il VWAP se fosse anco
FREE
Sweet VWAP Anchored MT5
Francisco Gomes Da Silva
5 (3)
Risparmia tempo e prendi decisioni più sicure con le VWAP ancorate Se vuoi testare il potere di questo strumento, puoi scaricare l' indicatore gratuito di VWAP ancorate per MT5 . Oltre a lavorare in modo indipendente, questo indicatore è anche un'estensione della versione gratuita Sweet VWAP. Questo perché, quando fai clic sulla versione gratuita, quella VWAP che vedi al puntatore del mouse verrà fissata. E per una migliore comprensione, ciò che sarà fissato è questo indicatore, con tutte le sue
Supports And Resistances Lines MTF MT4
Francisco Gomes Da Silva
4.91 (11)
Supporti e resistenze, è stato creato per aiutarti a identificare automaticamente i massimi e i minimi su diversi intervalli di tempo diversi e quindi tracciare questi massimi e minimi sul grafico corrente. Andiamo alla spiegazione della creazione delle resistenze C'è un campo regola, che puoi definire cos'è un alto e un basso la regola superiore è impostata per impostazione predefinita in questo modo: H[ 0 ]<=H[ 1 ] and H[ 1 ]=>H[ 2 ] Dove: Elemento Descrizione H  significa   Alto [0]  si
FREE
Sweet VWAP Aux
Francisco Gomes Da Silva
4.25 (4)
Risparmia tempo e prendi decisioni più accurate con Sweet VWAP Aux Se non hai ancora scaricato il nostro gratuito indicatore VWAP per Metatrader 4 , fallo ora e sperimenta le sue incredibili capacità di visualizzazione del VWAP ancorato. Quindi, torna qui e scopri Sweet VWAP Aux - l'estensione perfetta per il tuo indicatore Sweet VWAP. Con un solo clic, Sweet VWAP ti consente di fissare questo indicatore VWAP al punto che scegli, risparmiando tempo ed eliminando la necessità di configurare manua
Bar Number
Francisco Gomes Da Silva
5 (2)
Contatore di candele Questo indicatore conta le candele e ne mostra i numeri in base a un Lasso di tempo più grande Lasso di tempo più grande Puoi scegliere l'intervallo di tempo giornaliero come " Bigger Timeframe " ed eseguirlo su qualsiasi grafico con l'intervallo di tempo più piccolo. che il contatore conterà le barre secondo il grafico giornaliero . Se passi il periodo di tempo " H1 " come parametro, l'indicatore saprà come contare le barre all'interno del grafico H1, deve solo eseguirlo su
FREE
VWAP With Alerts
Francisco Gomes Da Silva
5 (2)
Questa VWAP è una VWAP semplice, ma abbiamo inserito degli avvisi per farti sapere quando il prezzo tocca la VWAP semplice o quando il prezzo incrocia la VWAP. Questo indicatore è un indicatore VWAP tradizionale per MetaTrader 5 (MT5). I parametri predefiniti sono quelli della VWAP normale, ma hai la possibilità di utilizzare nuovi calcoli e il meglio: Quando il prezzo tocca o incrocia la VWAP, verrai avvisato attraverso avvisi, notifiche sul cellulare, e-mail o segnali sonori. indicatore gratui
FREE
Paula Bollinger Bands
Francisco Gomes Da Silva
5 (1)
Trasforma la tua strategia di investimento con il robot investitore Expert Advisor per MetaTrader. Basato sulla potente strategia delle bande di Bollinger, creata da Joe Ross e soprannominata Paula dal famoso trader brasiliano Rodrigo Cohen, avrai accesso a una tecnologia avanzata che massimizzerà i tuoi profitti e minimizzerà i tuoi rischi. Non perdere altro tempo con strategie vecchie e inefficienti. Con il nostro robot investitore, avrai accesso a un algoritmo altamente accurato che combin
FREE
OHLC Shifted
Francisco Gomes Da Silva
5 (3)
Chiusura del Giorno Precedente e Spostamento delle Barre per MetaTrader! L'Indicatore di Chiusura del Giorno Precedente e Spostamento delle Barre è uno strumento progettato per migliorare l'analisi tecnica e la presa di decisioni nel trading. Con questo indicatore, avrai accesso a informazioni dettagliate sui livelli di apertura, massimo, minimo e chiusura di qualsiasi barra, consentendo un'analisi precisa e completa dei movimenti di mercato. Immagina di avere la capacità di inserire un timefram
FREE
Sweet VWAP
Francisco Gomes Da Silva
3.67 (3)
Scopri dove le grandi istituzioni stanno negoziando e ottimizza i tuoi investimenti con l'Indicatore VWAP Ancorata Gratuito per MetaTrader 4. Scopri il prezzo a cui le grandi istituzioni stanno effettuando le negoziazioni con il nostro Indicatore VWAP Ancorata Gratuito per MetaTrader 4! Ora puoi risparmiare il tuo prezioso tempo automatizzando la creazione delle VWAP ancorate ai massimi e minimi di mercato. La nostra versione gratuita ti consente di visualizzare facilmente la VWAP in tempo reale
FREE
Auto Anchored VWAPs MT4
Francisco Gomes Da Silva
5 (1)
Rivelare le Visioni del Trading con Auto Anchored VWAPs: Auto Anchored VWAPs sono la tua guida nel mondo del trading. Questi indicatori individuano i punti cruciali di inversione del mercato e li illustrano sul tuo grafico utilizzando le linee VWAP. Questo rappresenta un cambiamento epocale per i trader che utilizzano strategie ancorate alle VWAP. Come Funziona? Identificazione dei Punti Altai: Se il prezzo più alto della candela corrente è inferiore al prezzo più alto della candela precedente,
FREE
VWAP With Alerts MT4
Francisco Gomes Da Silva
Questa VWAP è una VWAP semplice, ma abbiamo incorporato notifiche che informano quando il prezzo raggiunge o attraversa la linea VWAP. Questo indicatore è un indicatore VWAP tradizionale per MetaTrader 4 (MT4). I parametri predefiniti sono quelli della VWAP normale, ma hai la possibilità di modificare il calcolo della VWAP e, meglio ancora: Quando il prezzo tocca o attraversa la VWAP, sarai avvisato attraverso allarmi, notifiche sul cellulare, e-mail o suoni. indicatore di VWAP ancorate per MT4
FREE
Auto Anchored VWAPs
Francisco Gomes Da Silva
Rivelare le Visioni del Trading con Auto Anchored VWAPs: Auto Anchored VWAPs sono la tua guida nel mondo del trading. Questi indicatori individuano i punti cruciali di inversione del mercato e li illustrano sul tuo grafico utilizzando le linee VWAP. Questo rappresenta un cambiamento epocale per i trader che utilizzano strategie ancorate alle VWAP. Come Funziona? Identificazione dei Punti Altai: Se il prezzo più alto della candela corrente è inferiore al prezzo più alto della candela precedente,
FREE
Bar Counter MT4
Francisco Gomes Da Silva
5 (6)
Indicatore contatore candelieri questo indicatore conta le candele che si trovano sul grafico in qualsiasi intervallo di tempo un bancone bar gratuito da scaricare su mt4 il contatore delle candele conta quante candele ci sono all'interno di un grafico più grande con questo contatore di candele puoi fare il conteggio automatico delle candele Indicatore di conteggio delle candele gratuito per scaricare e contare le barre automaticamente bar counter to count the bars count candle counter indicator
FREE
Rule Plotter MT4
Francisco Gomes Da Silva
5 (1)
Come Creare un Robot di Trading Automatico con Rule Plotter Vi siete mai chiesti quanto potente sarebbe poter automatizzare le vostre strategie di trading con pochi clic del mouse? Immaginate di avere la libertà di creare e testare diverse strategie di trading senza la necessità di immergervi in complicati codici. Con Rule Plotter, questa visione diventa realtà. Esploreremo come potete creare il vostro robot di trading personalizzato usando Rule Plotter, uno strumento di creazione di trade-syste
FREE
OHLC Shifted MT4
Francisco Gomes Da Silva
5 (2)
Chiusura del Giorno Precedente e Spostamento delle Barre per MetaTrader! L'Indicatore di Chiusura del Giorno Precedente e Spostamento delle Barre è uno strumento progettato per migliorare l'analisi tecnica e la presa di decisioni nel trading. Con questo indicatore, avrai accesso a informazioni dettagliate sui livelli di apertura, massimo, minimo e chiusura di qualsiasi barra, consentendo un'analisi precisa e completa dei movimenti di mercato. Immagina di avere la capacità di inserire un timefram
FREE
Rule Plotter Scanner
Francisco Gomes Da Silva
Hai mai pensato di avere uno scanner che analizza tutte le strategie e mostra i punti di acquisto e vendita su tutti i timeframes di quell'attivo, tutto contemporaneamente? È esattamente ciò che fa questo scanner. Questo scanner è progettato per mostrare i segnali di acquisto e vendita che hai creato nel Rule Plotter: creatore di strategie senza programmazione ed eseguirli all'interno di questo scanner su vari attivi e timeframes differenti. La strategia predefinita di Rule Plotter riguarda solo
FREE
Paula Bollinger Bands Strategy
Francisco Gomes Da Silva
4 (2)
Bollinger bands out/in strategy A strategy created by Joe Ross, and very useful for finding trades when the market is overloaded. Indicator You don't need to find where there are entries on the chart, this indicator shows them for you. The entrance The trade is confirmed when the price closes outside the bollinger bands on a candle and the candle after the price closes inside the bands. comment I want to improve this indicator, so you can help me sending me your reviews and comments, thanks :).
FREE
First Bar
Francisco Gomes Da Silva
Sistema commerciale Scegli una barra nel giorno in cui fare trading, quando questa barra chiude il robot invierà due ordini uno al massimo l'altro al minimo della candela, che si riprende l'altro verrà annullato StopLoss lo stop sarà un tick sotto il minimo in caso di acquisto, o un tick sopra il massimo in caso di vendita Prendi profitto Il take può essere impostato quanto vuoi del range dello stopLoss, può essere personalizzato nell'ottimizzazione della strategia Ottimizzazione Questo robot ha
FREE
My Candle Patterns
Francisco Gomes Da Silva
5 (1)
Questo indicatore è una versione demo di My candle completa che può essere scaricata qui: Candle Patterns Creator Con la versione completa, è possibile creare le proprie regole di candle e modificare un pattern di candle tradizionale per renderlo più preciso in base alla propria strategia. Nell'indicatore sono presenti diverse regole di candle di esempio, ma qui ne mostrerò solo alcune: Pattern Rule Candle Green C > O Candle Red C < O Doji C = O Hammer (C > O and (C-O) *2 < O-L and (C-O) *0.5 >
FREE
Fibonacci on ZigZag
Francisco Gomes Da Silva
4.93 (15)
Mouse You can draw fibonaccis moving the mouse over the zigzag indicator Pin them You can click on fibonacci with this option and it will no longer be deleted unless you click on it again :) Precision The tuned fibonacci gets the precise point in lower timeframes Enjoy it You can ask me for add more features, so please comment and leave your ranting for me to be happy, thank you :)
FREE
Rule Plotter Expert
Francisco Gomes Da Silva
5 (2)
Questo Expert Advisor è stato progettato per testare ed eseguire le tue strategie create all'interno dell'indicatore Rule Plotter . Come utilizzarlo: Scarica gratuitamente l'indicatore Rule Plotter - strumento per la creazione di sistemi di trading senza conoscenze di programmazione . Successivamente, sviluppa le tue strategie all'interno dell'indicatore Rule Plotter. Infine, esegui le tue strategie create utilizzando questo Expert Advisor. Parametri: Strategy Il tuo sistema di trading creato al
Trailing on Last Top Bottom
Francisco Gomes Da Silva
5 (1)
Questo strumento pone fermate sulle tue posizioni Testa rapidamente da Metatrade Strategy Tester. La tua fermata sarà all'ultimo fondo in caso di una posizione lunga Oppure il tuo stop sarà all'ultimo top in caso di una posizione short Inoltre, questo strumento gestisce il trailing delle tue posizioni aperte. posizionare sempre lo stop all'ultimo massimo formato o all'ultimo fondo formato per creare i massimi e i minimi utilizzo l'indicatore gratuito "Linee di supporti e resistenze" che è
Trailing on Last Top Bottom MT4
Francisco Gomes Da Silva
5 (1)
Scopri il Potere della Gestione del Rischio del Price Action per posizionare i tuoi stop loss! Hai mai provato la situazione in cui sai esattamente quando entrare in un'operazione, ma sei indeciso sul momento giusto per uscire? Non preoccuparti, non sei solo! Molti trader affrontano questa sfida quotidianamente. La buona notizia è che il nostro strumento di gestione del rischio basato sul price action è qui per risolvere questo problema. Mentre ti concentri nell'individuare i punti di ingresso i
Rule Plotter Expert MT4
Francisco Gomes Da Silva
5 (1)
Operare con le tue Strategie Create con Rule Plotter Indicatore tramite Rule Plotter Expert: Ora che hai creato le tue strategie personalizzate utilizzando Rule Plotter Indicatore e hai visualizzato le frecce che indicano i punti di ingresso e di uscita nel grafico, è il momento di dare vita a queste strategie sui mercati finanziari. Con Rule Plotter Expert, puoi operare in modo autonomo e preciso basandoti su queste frecce, sfruttando appieno il potenziale delle tue strategie. Trasformare le Fr
Pattern Wizard
Francisco Gomes Da Silva
Patterns Wizard è uno strumento per la creazione di pattern di candele. Con esso, puoi creare vari pattern diversi e aggiungere quante istanze di questo indicatore desideri al tuo grafico, ognuna con un pattern diverso. Per capire meglio come funzionano le formule di creazione, puoi prendere esempi dall'indicatore My Candle su   My Candle, che ha più di 70 esempi di pattern di candele . La differenza principale di questo indicatore è che ha 30 parametri di regole , il che significa che puoi impo
FREE
TrendPlator
Francisco Gomes Da Silva
TrendLines Plator: Potenzia le tue Strategie di Trading con un Avanzato Indicatore di Proiezione delle Tendenze Esplora il potenziale del nostro indicatore innovativo! Con la capacità di analizzare e proiettare le linee di tendenza di time frame più ampi direttamente sul tuo intervallo di tempo attuale, offre un supporto strategico che cattura l'attenzione dei trader in generale. Questi punti diventano livelli strategici di supporto o resistenza per le tue operazioni, rafforzando la tua strategi
Hide Scale MT4
Francisco Gomes Da Silva
5 (2)
Nascondi Scala - Lo strumento ideale per i trader che desiderano massimizzare lo spazio del grafico Come utilizzare Nascondi Scala Premere "T" per nascondere la scala temporale e "P" per nascondere la scala dei prezzi. E' possibile personalizzare i tasti di scelta rapida facendo clic sui pulsanti corrispondenti e scegliere un nuovo tasto per ogni funzione. Se si desidera nascondere entrambe le scale contemporaneamente, è possibile assegnare lo stesso tasto per entrambe le opzioni. Per ripristina
FREE
Hide Scale
Francisco Gomes Da Silva
5 (1)
Nascondi la Scala - Strumento per i Trader che Vogliono Più Spazio sullo Schermo Istruzioni Premere "T" per nascondere la scala temporale e "P" per nascondere la scala dei prezzi. Puoi personalizzare queste tasti cliccando sul pulsante corrispondente e digitando un nuovo tasto sulla tastiera. Per nascondere entrambe le scale contemporaneamente, puoi assegnare lo stesso tasto a entrambe le opzioni. Per mostrare di nuovo le scale, è sufficiente premere nuovamente il tasto corrispondente. Perché ab
FREE
Pattern Wizard MT4
Francisco Gomes Da Silva
Patterns Wizard è uno strumento per la creazione di pattern di candele. Con esso, puoi creare vari pattern diversi e aggiungere quante istanze di questo indicatore desideri al tuo grafico, ognuna con un pattern diverso. Per capire meglio come funzionano le formule di creazione, puoi prendere esempi dall'indicatore My Candle su   My Candle, che ha più di 70 esempi di pattern di candele . La differenza principale di questo indicatore è che ha 30 parametri di regole , il che significa che puoi impo
Filtro:
Elsier Jimenez
46
Elsier Jimenez 2024.04.07 23:29 
 

Excelente herramienta para automatizar una estrategia. Felicitaciones al desarrollador.

Francisco Gomes Da Silva
74365
Risposta dello sviluppatore Francisco Gomes Da Silva 2024.04.08 20:49
Muchas gracias por usar y por esta gratificante reseña, Sr. Elsier
Moeen Ghiyas
299
Moeen Ghiyas 2024.03.10 09:30 
 

It's an excellent indicator, though difficult to understand initially as it took me a few days to comprehend. Anyhow your effort and idea are highly appreciated. ...... It needs little improvement as at present it does not provide nesting (use of parenthesis within rules for logical AND /OR operations), the same is available in Math Operation but misses logical AND / OR operation there as well. Suggested improvement will make it awesome, but I will still give it 5-star rating based on your idea and effort.

Francisco Gomes Da Silva
74365
Risposta dello sviluppatore Francisco Gomes Da Silva 2024.03.10 14:20
Thank you very much for your 5 star rating and your review Moeen, in fact it is a little difficult to understand initially, as the previous knowledge should be programming logic, but after mastering the tool, we can automate infinite combinations, especially after fix this alignment that you said, even I didn't understand exactly, but perhaps what you said can be resolved by pressing the back button and revisiting the rule by pressing the edit button again, in the current version Rule Plotter 1.7, will make it have more fields available for add more AND/OR logic
MickeBo
120
MickeBo 2024.03.02 19:35 
 

I highly recommend this tool and I'm glad to be able to use it! The purpose of this tool is to enter and save an existing strategy in order to then receive current entry signals in the form of arrows during operation according to the parameters I previously entered. It took me a while at the beginning to understand how to enter the parameters and I had a lot of help from Francisco, thank you very much for that! Once everything was entered and saved, everything worked perfectly. I receive entry arrows according to my strategy and I am very happy about this as it makes trading much clearer and easier for me. I don't want to miss it anymore, a really great tool that's worth trying. It is also possible to do a backtest with the saved parameters using the Rule Plotter EA and thus test the entered strategy - what more could you want? I can also highly recommend Francisco, his programming is flawless, he is very helpful and patient and I will always be happy to come back to him if there is a need for an indicator or an EA. Thank you, Francisco, for everything!!

Francisco Gomes Da Silva
74365
Risposta dello sviluppatore Francisco Gomes Da Silva 2024.03.03 20:52
Thank you so much for sharing your experience with Rule Plotter, MickeBo! I truly appreciate your fantastic review and the time you took to provide it. Your feedback means a lot to me, and I am thrilled to hear that you found the tool helpful in your trading journey. I also want to extend our gratitude for your patience and cooperation throughout the process. It's customers like you that motivate us to continually improve and provide the best service possible. If you ever need further assistance or have any questions, please don't hesitate to reach out. We're here to help and support you every step of the way. Thanks again for choosing Rule Plotter, and I wish you continued success in your trading endeavors!
Evgeny Belyaev
87754
Evgeny Belyaev 2023.11.01 00:16 
 

Convenient tool.

Francisco Gomes Da Silva
74365
Risposta dello sviluppatore Francisco Gomes Da Silva 2023.11.01 08:54
thank you for your reviews Evgeny Belyaev
Rispondi alla recensione
Versione 1.10 2024.05.05
Il bug nell'importazione della strategia è stato corretto, ora tutte le regole vengono cancellate prima di importare una strategia condivisa da un amico.
Versione 1.9 2024.03.10
+ Salvare le regole pulite
- Evitare che la strategia zero venga riempita con il valore predefinito
Versione 1.7 2024.02.22
Ora è possibile definire una regola di segnale per chiudere la posizione.
Versione 1.6 2024.02.19
Compatibilità con più indicatori
Versione 1.5 2024.02.06
In questa versione stiamo esportando la strategia nel formato .txt perché è un formato accettato per allegare al forum.
Versione 1.4 2024.01.31
- Il valore nella finestra dell'indicatore viene ora aggiornato nel punto del grafico in cui si trova il mouse
Versione 1.3 2023.12.02
+ Ricontrollare l'allerta della candela in corso dopo che la candela si chiude anche.
Versione 1.2 2023.11.30
Quando compare una freccia di segnalazione:
+ Notifica sonora
+ Allarme su MetaTrader
+ Notifica push su smartphone
+ Allarme via email
Versione 1.1 2023.11.26
Layout per importare ed esportare strategie