• Panoramica
  • Recensioni
  • Commenti
  • Novità

Market Session Times

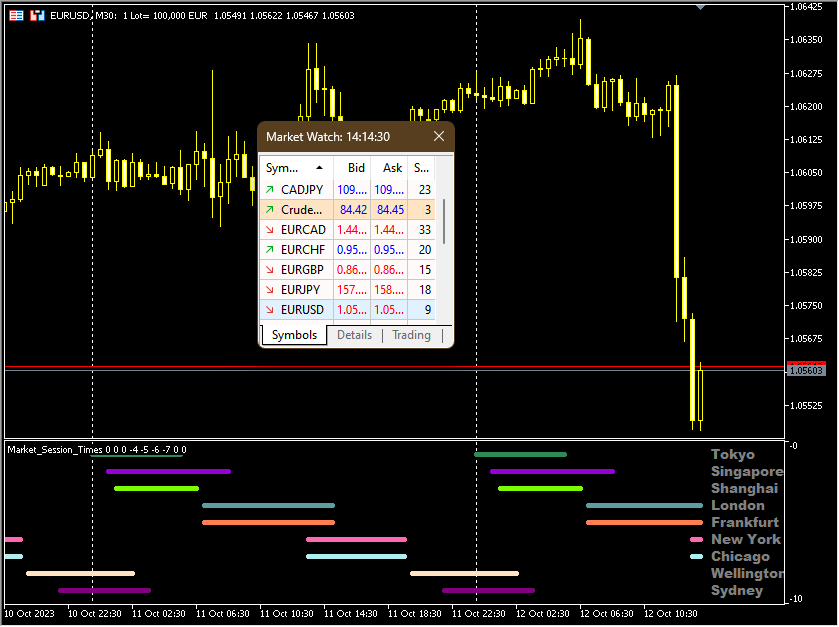
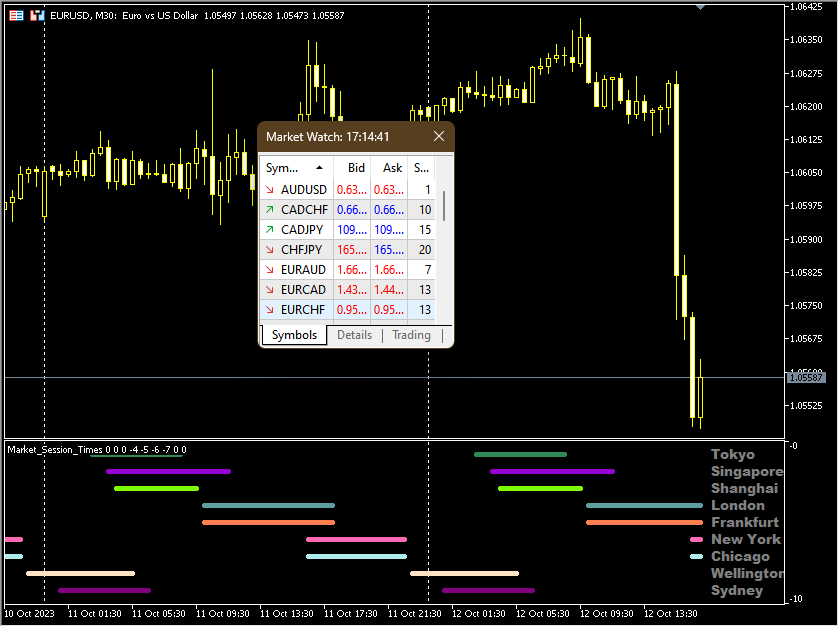
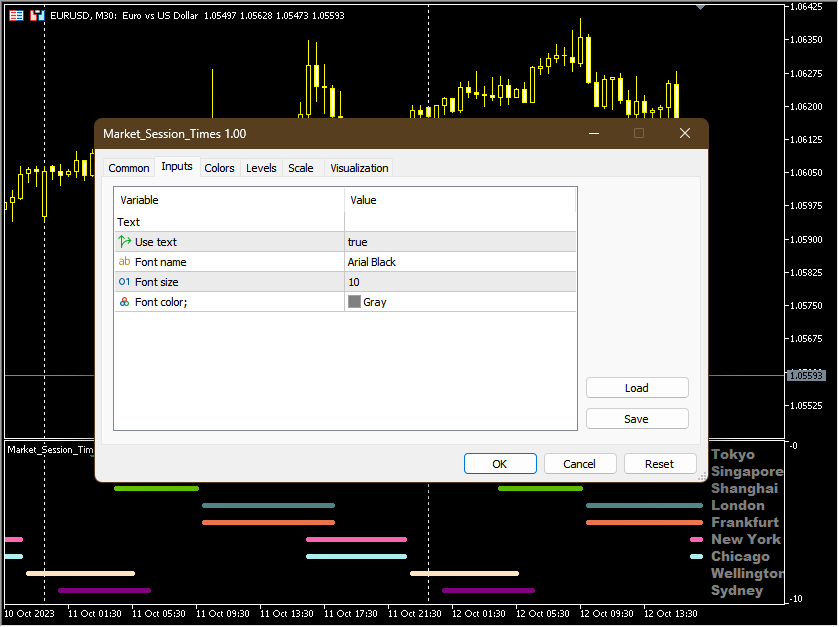
L'indicatore " Market Session Times " mostra il tempo di quattro sessioni di negoziazione: Asia, Europa, America e Pacifico. L'orario delle sessioni di negoziazione è impostato nel formato   GMT e quindi non dipende affatto dal server di trading.

Vengono utilizzati i seguenti dati:

Sessione di negoziazione
Città
GMT

Asia

Tokio
Singapore
Shangai

00:00-06:00
01:00-09:00
01:30-07:00

Europa

Londra
Francoforte

07:00-15:30
07:00-15:30

America

New York
Chicago

13:30-20:00
13:30-20:00

Pacifico

Wellington
Sydney

20:00-02:45
22:00-04:00


Prodotti consigliati
The best time to trade Using this Indicator is when the time reach exactly hour,half,45 minutes,15 minutes and sometimes 5 minutes.. This indicators is helpful to those who trade boom and crash indecies.How to read this indicator first you'll see Blue allow and Red allow all these allows used to indicate or to detect the spike which will happen so the allow happens soon before the spike happen.This indicator works properly only in boom and crash trading thing which you have to consider when
Was: $249  Now: $99   Market Profile defines a number of day types that can help the trader to determine market behaviour. A key feature is the Value Area, representing the range of price action where 70% of trading took place. Understanding the Value Area can give traders valuable insight into market direction and establish the higher odds trade. It is an excellent addition to any system you may be using. Inspired by Jim Dalton’s book “Mind Over Markets”, this indicator is designed to suit the
MetaCOT 2 is a set of indicators and specialized utilities for the analysis of the U.S. Commodity Futures Trading Commission reports. Thanks to the reports issued by the Commission, it is possible to analyze the size and direction of the positions of the major market participants, which brings the long-term price prediction accuracy to a new higher-quality level, inaccessible to most traders. These indicators, related to the fundamental analysis, can also be used as an effective long-term filter
You can change the time period of the chart at the touch of a button. You can also change multiple charts at the touch of a button. You can also change multiple charts at the touch of a button,   saving you the trouble of changing time periods. We are live-streaming the actual operation of the system. Please check for yourself if it is usable. Please check it out for yourself. https://www.youtube.com/@ganesha_forex We do not guarantee your investment results. Investments should be made at y
The Netsrac Correlation Trade Indicator (NCTI) was created to trade correlations between different assets. NCTI offers five different strategies to do this. Five different correlation trading strategies with two or three assets Fast access your assets with one click via asset buttons Your profit/loss at a glance Configurable alerts via screen or mobile You can use the indicator with every timeframe. Higher timeframes give fewer but better signals. If you have some questions or suggestions - pl
Awesome Oscillator by Bill Williams with the ability to fine-tune and replace the averaging algorithms of the indicator, which significantly expands the possibilities of using this oscillator in algorithmic trading and brings it closer in its properties to such an indicator as the MACD. To reduce price noise, the final indicator is processed with an additional Smooth averaging. The indicator has the ability to give alerts, send mail messages and push signals when the direction of movement of th
Knowledge of the strength and weakness of each currency is vital for every forex trader. Our   Currency Strength Meter indicator   measures the strength of eight major currencies (USD, EUR, GBP, CHF, JPY, CAD, AUD, NZD) by using the Relative Strength Index indicator, also known as RSI. The Currency Strength Meter indicator shows you, simply and quickly, when a currency is oversold, overbought, or in "normal area". This way, you can identify which currency is the strongest and the weakest. Our
Una delle sequenze numeriche è chiamata "Sequenza di incendi boschivi". È stata riconosciuta come una delle nuove sequenze più belle. La sua caratteristica principale è che questa sequenza evita andamenti lineari, anche quelli più brevi. È questa proprietà che ha costituito la base di questo indicatore. Quando si analizza una serie temporale finanziaria, questo indicatore cerca di rifiutare tutte le possibili opzioni di tendenza. E solo se fallisce, riconosce la presenza di una tendenza e dà il
US30NinjaMT5
Satyaseelan Shankarananda Moodley
US30 Ninja is a 5 minute scalping indicator that will let know you when there is a trade set up (buy or sell). Once the indicator gives the trade direction, you can open a trade and use a 30 pip stop loss and a 30 pip to 50 pip take profit. Please trade at own own risk. This indicator has been created solely for the US30 market and may not yield positive results on any other pair. 
Il livello Premium è un indicatore unico con una precisione superiore all'80% delle previsioni corrette! Questo indicatore è stato testato dai migliori Specialisti di Trading per più di due mesi! L'indicatore dell'autore che non troverai da nessun'altra parte! Dagli screenshot puoi vedere di persona la precisione di questo strumento! 1 è ottimo per il trading di opzioni binarie con un tempo di scadenza di 1 candela. 2 funziona su tutte le coppie di valute, azioni, materie prime, cript
Bar Follow EA
Aurelio Miguel Machado Da Silva
1 (1)
This robot has the purpose of operating in favor of force bars, the size of the force bar can be configured, the takeprofit and stoploss can be defined by the users or can be automatically placed by the robot (in this case the takeprofit and stoploss targets are the size of the previous bar). The values ​​defined in the parameters must be changed according to the users' needs. 
FREE
This MT5 indicator has been designed to be used on any currency pair and any time frame . It has the scalper and swing trader in mind.  The indicator looks for short-term high-probability reversals in price and will indicate to you to go long (buy) or short (sell) if you see a green or red arrow next to the current candlestick respectively. The indicator provides the best trading opportunities to you during the active trading hours of London and New York, but it will continue to give signals al
Your Pointer is no ordinary Forex channel. This corridor is built on the basis of the analysis of several candles, starting from the last one, as a result of which the extremes of the studied interval are determined. They are the ones who create the channel lines. Like all channels, it has a middle line as well as a high and low line. This channel is worth watching for its unusual behavior. The use of the Your Pointer indicator allows the trader to react in time to the price going beyond the bo
Upgraded - Stars added to indentify Areas you can scale in to compound on your entry  when buying or selling version 2.4 Upgraded Notifications and alerts added version 2.3 *The indicator is suitable for all pairs fromm  Deriv pairs (Vix,jump,boom & crash indices) , Currencies, cryptos , stocks(USA100, USA30 ), and metals like gold etc. How does it work? Increasing the period make it more stable hence will only focus on important entry points However  lowering the period will mean the indica
VSA target
Evgenii Bazhenov
Obiettivo VSA L'indicatore identifica un acquirente professionista o un venditore professionista sul grafico utilizzando il sistema VSA (Volume Spread Analysis) e costruisce una zona di supporto alla tendenza rispetto a queste barre (Candele) e ai livelli target.  Comportamento: 1. In questo indicatore, è possibile scegliere la modalità in cui verrà determinato solo l'acquirente professionista o il venditore professionista e entrambi i partecipanti professionali saranno determinati contemporane
Attention!!! Do not try to test the EA in the MT4 Tester, it is simply impossible, because the EA opens positions on 27 different instruments and 8 timeframe . The tester is able to test only one pair. Multi-currency tester is possible only in MT5. Instructions for launching a multi-currency tester in MT5:  https://youtu.be/WrQQwMQclrY How EA works: 1. The main strategy for the breakdown of local extremes is used. 2. An additional algorithm is used to control losing trades and redistribute loss
Cet indicateur innovant de mesure de la force des devises de INFINITY est une aide indispensable pour les scalpers et les commerçants qui négocient à long terme. Le système d'analyse De la force/faiblesse des devises est connu depuis longtemps et utilisé sur le marché par les principaux traders du monde. Tout commerce d'arbitrage n'est pas complet sans cette analyse. Notre indicateur détermine facilement la force des devises sous-jacentes les unes par rapport aux autres. Il affiche des graphiqu
PZ Trend Trading MT5
PZ TRADING SLU
3.67 (3)
Trend Trading is an indicator designed to profit as much as possible from trends taking place in the market, by timing pullbacks and breakouts. It finds trading opportunities by analyzing what the price is doing during established trends. [ Installation Guide | Update Guide | Troubleshooting | FAQ | All Products ] Trade financial markets with confidence and efficiency Profit from established trends without getting whipsawed Recognize profitable pullbacks, breakouts and early reversals The ind
ABCD Pattern Scanner MT5
Reza Aghajanpour
5 (9)
** All Symbols x All Timeframes scan just by pressing scanner button ** *** Contact me after the purchase to send you instructions and add you in "ABCD scanner group" for sharing or seeing experiences with other users. Introduction This indicator scans AB=CD retracement patterns in all charts. The ABCD is the basic foundation for all harmonic patterns and highly repetitive with a high success rate . The ABCD Scanner indicator is a scanner reversal ABCD pattern that helps you identify when the pr
Several techniques use volume as an important point in the trade. Whether to indicate strength, exhaustion, pullback weakness, among others. In chief I quote Richard Wyckoff's theory, which said about the importance of looking price and volume. However, there are several possibilities to filter what is volume that should be noticed. PVRSA/PVA users use an indicator with specific colors, which assist in identifying the volume and type of movement that the price has made. Will the high
L'indicatore costruisce le quotazioni attuali, che possono essere confrontate con quelle storiche e su questa base fanno una previsione del movimento dei prezzi. L'indicatore ha un campo di testo per una rapida navigazione fino alla data desiderata. Opzioni: Simbolo - selezione del simbolo che visualizzerà l'indicatore; SymbolPeriod - selezione del periodo da cui l'indicatore prenderà i dati; IndicatorColor - colore dell'indicatore; HorisontalShift - spostamento delle virgolette d
40% off. Original price: $50 ATR Scanner Pro is a multi symbol multi timeframe volatility scanner that monitors and analyzes Average True Range indicator value in up to 28 symbols and 9 timeframes   in 3 modes : ATR value:   As a volatility dashboard it shows the ATR indicator value in all pairs and timeframes and signals when the ATR value reaches a maximum or minimum in a given duration. Short term ATR/Long term ATR ratio:  It shows ratio of 2 ATRs with different periods. It's useful in detec
Your Trend Friend
Luigi Nunes Labigalini
The trend is your friend! Look at the color of the indicator and trade on that direction. It does not  repaint. After each candle is closed, that's the color of the trend. You can focus on shorter faster trends or major trends, just test what's most suitable for the symbol and timeframe you trade. Simply change the "Length" parameter and the indicator will automatically adapt. You can also change the color, thickness and style of the lines. Download and give it a try! There are big movements
Indicator and Expert Adviser  EA Available in the comments section of this product. Download with Indicator must have indicator installed for EA to work. Mt5 indicator alerts for bollinger band and envelope extremes occurring at the same time. Buy signal alerts occur when A bullish candle has formed below both the lower bollinger band and the lower envelope  Bar must open and close below both these indicators. Sell signal occur when A bear bar is formed above the upper bollinger band and upp
Gioteen Volatility Index (GVI) - your ultimate solution to overcoming market unpredictability and maximizing trading opportunities. This revolutionary indicator helps you in lowering your losing trades due to choppy market movements. The GVI is designed to measure market volatility, providing you with valuable insights to identify the most favorable trading prospects. Its intuitive interface consists of a dynamic red line representing the volatility index, accompanied by blue line that indicate
Market book tester
Aliaksandr Hryshyn
1 (1)
Using data from the order book in the strategy tester Key features: Simultaneous use of several symbols, up to 7 pieces DOM visualization With the visualization of order books, real-time simulation is available, as well as acceleration or deceleration Working with the library: This product also requires a utility to save data:  https://www.mql5.com/en/market/product/71642 Speed control utility:  https://www.mql5.com/en/market/product/81409 Include file:   https://c.mql5.com/31/735/Market_book_s
FREE
Visible Market Profile graphically represents the amount of trades made on each price level. This indicator in particular, unlike the daily  market profile , is calculated on the visible area of ​​the chart. Visible Market Profile cannot be considered an indicator of operational signals, but it can be a good support for reading the market, in addition to what is already used by every trader in his work process. The Visible Market Profile is able to determine with a good approximation the pric
The  DYJ  CandleShape   contains 80 candlestick Patterns, such as MORNING STAR, DOJI STAR, HARAMI CROSS,INVERT HAMMER,ENGULFING..... candlestick is a valid form of market technical analysis.  The recommended short stoploss is near the highest price of the first three to five candles The recommended long   stoploss   is near the lowest price of the first three to five candles Input InpPeriodSMA   =10         -- Period of averaging InpAlert       =true          --  Enable. alert InpCountBars   =
Sam TrendBlaster for MT5
AKILA THILINDA JAYARATHNA RANASINGHEGE
3.5 (2)
***** This is an indicator for MT5 providing accurate arrow signals without repainting. ***** Trade With Sam Simple Strategy Guide :  https://www.mql5.com/en/blogs/post/740855 MT4 version of the indicator Try Out and see the Difference The Sam's Trend Blaster indicator tracks the market trend with an unmatched reliability, by ignoring sudden fluctuations and market noise. It has been designed to trend-trade intraday charts and small timeframes. Its winning ratio is around 85%. This is a
Hello, This is an easy symbol change panel. This is a full version of Symbol1 2Changer Symbols must be active on your Market Watch list. Parameters: SymbolList - you can add more symbols with a comma(,) ratio - change the size LineNumber - you can set that how many symbols are displayed per line. button_width - modify the button size button_height - modify the button size Thank you.
Gli utenti di questo prodotto hanno anche acquistato
Innanzitutto è importante sottolineare che questo sistema di trading è un indicatore Non-Repainting, Non-Redrawing e Non-Lagging, il che lo rende ideale sia per il trading manuale che per quello automatico. Il "Sistema di Trading Smart Trend MT5" è una soluzione completa pensata sia per i trader principianti che per quelli esperti. Combina oltre 10 indicatori premium e offre più di 7 robuste strategie di trading, rendendolo una scelta versatile per diverse condizioni di mercato. Strategia di Tre
Atomic Analyst MT5
Issam Kassas
4.82 (11)
Innanzitutto, vale la pena sottolineare che questo indicatore di trading non è repaint, non è ridisegno e non presenta ritardi, il che lo rende ideale sia per il trading manuale che per quello automatico. L'Analista Atomico è un indicatore di azione del prezzo PA che utilizza la forza e il momentum del prezzo per trovare un miglior vantaggio sul mercato. Dotato di filtri avanzati che aiutano a rimuovere rumori e segnali falsi, e aumentare il potenziale di trading. Utilizzando più strati di in
FX Volume MT5
Daniel Stein
4.94 (17)
Ricevi il tuo aggiornamento quotidiano sul mercato con dettagli e schermate tramite il nostro Morning Briefing qui su mql5 e su Telegram ! FX Volume è il PRIMO e UNICO indicatore di volume che fornisce una visione REALE del sentiment del mercato dal punto di vista del broker. Fornisce informazioni straordinarie su come gli operatori di mercato istituzionali, come i broker, sono posizionati sul mercato Forex, molto più velocemente dei rapporti COT. Vedere queste informazioni direttamente sul vo
Quantum Trend Sniper
Bogdan Ion Puscasu
5 (37)
Presentazione       Quantum Trend Sniper Indicator   , l'innovativo indicatore MQL5 che sta trasformando il modo in cui identifichi e scambi le inversioni di tendenza! Sviluppato da un team di trader esperti con un'esperienza di trading di oltre 13 anni,       Indicatore Quantum Trend Sniper       è progettato per spingere il tuo viaggio di trading verso nuove vette con il suo modo innovativo di identificare le inversioni di tendenza con una precisione estremamente elevata. *** Acquista Quant
Trend Screener Pro MT5
STE S.S.COMPANY
4.89 (61)
Indicatore di tendenza, soluzione unica rivoluzionaria per il trading di tendenze e il filtraggio con tutte le importanti funzionalità di tendenza integrate in un unico strumento! È un indicatore multi-timeframe e multi-valuta al 100% non ridipingibile che può essere utilizzato su tutti i simboli/strumenti: forex, materie prime, criptovalute, indici e azioni. Trend Screener è un indicatore di tendenza che segue un indicatore efficiente che fornisce segnali di tendenza a freccia con punti nel gra
Innanzitutto, vale la pena sottolineare che questo Strumento di Trading è un Indicatore Non-Ridipingente, Non-Ridisegnante e Non-Laggante, il che lo rende ideale per il trading professionale. L'Indicatore Smart Price Action Concepts è uno strumento molto potente sia per i nuovi che per i trader esperti. Racchiude più di 20 utili indicatori in uno solo, combinando idee di trading avanzate come l'Analisi del Trader del Circolo Interno e le Strategie di Trading dei Concetti del Denaro Intelligen
Top indicator for MT5   providing accurate signals to enter a trade without repainting! It can be applied to any financial assets:   forex, cryptocurrencies, metals, stocks, indices .  Watch  the video  (6:22) with an example of processing only one signal that paid off the indicator! MT4 version is here It will provide pretty accurate trading signals and tell you when it's best to open a trade and close it. Most traders improve their trading results during the first trading week with the help of
FX Power MT5 NG
Daniel Stein
5 (4)
Ricevi il tuo aggiornamento quotidiano sul mercato con dettagli e schermate tramite il nostro Morning Briefing qui su mql5 e su Telegram ! FX Power MT5 NG è la nuova generazione del nostro popolare misuratore di forza delle valute, FX Power. Cosa offre questo misuratore di forza di nuova generazione? Tutto ciò che avete amato dell'FX Power originale IN PIÙ Analisi della forza di ORO/XAU Risultati di calcolo ancora più precisi Periodi di analisi configurabili individualmente Limite di calcolo pe
RelicusRoad Pro MT5
Relicus LLC
4.82 (22)
Ora $ 147 (aumentando a $ 499 dopo alcuni aggiornamenti) - account illimitati (PC o MAC) Manuale utente di RelicusRoad + Video di formazione + Accesso al gruppo Discord privato + Stato VIP UN NUOVO MODO DI GUARDARE IL MERCATO RelicusRoad è l'indicatore di trading più potente al mondo per forex, futures, criptovalute, azioni e indici, fornendo ai trader tutte le informazioni e gli strumenti di cui hanno bisogno per rimanere redditizi. Forniamo analisi tecniche e piani di trading per aiutar
Auto Order Block with break of structure based on ICT and Smart Money Concepts Futures Break of Structure ( BoS )             Order block ( OB )            Higher time frame Order block / Point of Interest ( POI )    shown on current chart           Fair value Gap ( FVG ) / Imbalance   ,  MTF      ( Multi Time Frame )    Volume Imbalance     ,  MTF          vIMB Gap’s Equal High / Low’s     ,  MTF             EQH / EQL Liquidity               Current Day High / Low           HOD /
XQ Indicator MetaTrader 5
Marzena Maria Szmit
5 (1)
Step into the realm of Forex trading with confidence and precision using XQ, a cutting-edge Forex indicator designed to elevate your trading game to unprecedented heights. Whether you're a seasoned trader or just stepping into the world of currency exchange, XQ Forex Indicator empowers you with the insights and signals needed to make informed trading decisions. The signal conditions are a combination of three indicators, and XQ Forex Indicator only display  medium and long-term trends . The ind
Blahtech Supply Demand MT5
Blahtech Limited
4.57 (14)
Was: $299  Now: $99   Supply Demand uses previous price action to identify potential imbalances between buyers and sellers. The key is to identify the better odds zones, not just the untouched ones. Blahtech Supply Demand indicator delivers functionality previously unavailable on any trading platform. This 4-in-1 indicator not only highlights the higher probability zones using a multi-criteria strength engine, but also combines it with multi-timeframe trend analysis, previously confirmed swings
Advanced Supply Demand MT5
Bernhard Schweigert
4.53 (15)
La migliore soluzione per qualsiasi principiante o trader esperto! Questo indicatore è uno strumento di trading unico, di alta qualità e conveniente perché abbiamo incorporato una serie di funzionalità proprietarie e una nuova formula. Con questo aggiornamento, sarai in grado di mostrare fusi orari doppi. Non solo potrai mostrare una TF più alta, ma anche entrambe, la TF del grafico, PIÙ la TF più alta: SHOWING NESTED ZONES. Tutti i trader di domanda di offerta lo adoreranno. :) Informazioni imp
ICT, SMC, SMART MONEY CONCEPTS, SMART MONEY, Smart Money Concept, Support and Resistance, Trend Analysis, Price Action, Market Structure, Order Blocks, BOS/CHoCH,   Breaker Blocks ,  Momentum Shift,   Supply&Demand Zone/Order Blocks , Strong Imbalance,   HH/LL/HL/LH,    Fair Value Gap, FVG,  Premium  &   Discount   Zones, Fibonacci Retracement, OTE, Buy Side Liquidity, Sell Side Liquidity, BSL/SSL Taken, Equal Highs & Lows, MTF Dashboard, Multiple Time Frame, BigBar, HTF OB, HTF Market Structure
L'indicatore Quadrato di Gann è uno strumento potente di analisi di mercato basato sull'articolo "Formula Matematica per le Previsioni di Mercato" scritto da W.D. Gann. Questo strumento utilizza concetti matematici e teorie di Gann per effettuare un'analisi precisa del mercato. Utilizza i quadrati di 144, 90, 52 e anche il quadrato di 9. Inoltre, integra il metodo del  per il quadrato di 9 e la sua relazione con canali e modelli stellari di quel quadrato. Manuale Utente e Applicazione: Prima di
AW Trend Predictor MT5
AW Trading Software Limited
4.76 (54)
La combinazione di trend e livelli di rottura in un unico sistema. Un algoritmo di indicatore avanzato filtra il rumore del mercato, determina la tendenza, i punti di ingresso e i possibili livelli di uscita. I segnali indicatori sono registrati in un modulo statistico, che permette di selezionare gli strumenti più adatti, mostrando l'efficacia dello storico dei segnali. L'indicatore calcola i segni Take Profit e Stop Loss. Manuale e istruzioni ->   QUI   / versione MT4 ->   QUI Come fare tradi
Il profitto dalla struttura del mercato cambia quando il prezzo si inverte e si ritira. L'indicatore di avviso di inversione della struttura del mercato identifica quando una tendenza o un movimento di prezzo si sta avvicinando all'esaurimento e pronto a invertire. Ti avvisa dei cambiamenti nella struttura del mercato che in genere si verificano quando stanno per verificarsi un'inversione o un forte pullback. L'indicatore identifica inizialmente i breakout e lo slancio del prezzo, ogni volta
Volume by Price MT5
Brian Collard
5 (3)
The Volume by Price Indicator for MetaTrader 5 features Volume Profile and Market Profile TPO (Time Price Opportunity). Get valuable insights out of currencies, equities and commodities data. Gain an edge trading financial markets. Volume and TPO histogram bar and line charts. Volume Footprint charts. TPO letter and block marker charts including split structures. Versatile segmentation and compositing methods. Static, dynamic and flexible ranges with relative and/or absolute visualizations. Lay
Presentazione       Quantum Breakout PRO   , l'innovativo indicatore MQL5 che sta trasformando il modo in cui scambi le zone di breakout! Sviluppato da un team di trader esperti con un'esperienza di trading di oltre 13 anni,       Quantum Breakout PRO       è progettato per spingere il tuo viaggio di trading a nuovi livelli con la sua strategia innovativa e dinamica della zona di breakout. Quantum Breakout Indicator ti fornirà frecce di segnalazione sulle zone di breakout con 5 zone target
TrendLine PRO MT5
Evgenii Aksenov
4.78 (49)
The Trend Line PRO indicator is an independent trading strategy. It shows the trend change, the entry point to the transaction, as well as automatically calculates three levels of Take Profit and Stop Loss protection Trend Line PRO is perfect for all Meta Trader symbols: currencies, metals, cryptocurrencies, stocks and indices Advantages of Trend Line PRO Never redraws its signals The possibility of using it as an independent strategy It has three automatic levels Take Profit and Stop Loss lev
Owl Smart Levels MT5
Sergey Ermolov
4.47 (36)
Versione MT4  |  FAQ L' indicatore Owl Smart Levels è un sistema di trading completo all'interno dell'unico indicatore che include strumenti di analisi di mercato popolari come i frattali avanzati di Bill Williams , Valable ZigZag che costruisce la corretta struttura a onde del mercato, e i livelli di Fibonacci che segnano i livelli esatti di entrata nel mercato e luoghi per prendere profitti. Descrizione dettagliata della strategia Istruzioni per lavorare con l'indicatore Consulente-assistente
Gartley Hunter Multi
Siarhei Vashchylka
5 (5)
Gartley Hunter Multi - An indicator for searching for harmonic patterns simultaneously on dozens of trading instruments and on all classic timeframes: (m1, m5, m15, m30, H1, H4, D1, Wk, Mn). Manual (Be sure to read before purchasing) | Version for MT4 Advantages 1. Patterns: Gartley, Butterfly, Shark, Crab. Bat, Alternate Bat, Deep Crab, Cypher 2. Simultaneous search for patterns on dozens of trading instruments and on all classic timeframes 3. Search for patterns of all possible sizes. Fr
Trend Line Map Pro MT5
STE S.S.COMPANY
4.67 (9)
Trend Line Map indicator is an addons for   Trend Screener Indicator . It's working as a scanner for all signals generated by Trend screener ( Trend Line Signals ) . It's a Trend Line Scanner based on Trend Screener Indicator.  If you don't have Trend Screener Pro Indicator,   the Trend Line Map Pro will not work.     LIMITED TIME OFFER : Trend Line Map Indicator is available for only 50 $ and lifetime. ( Original price 125$ ) By accessing to our MQL5 Blog,  you can find all our premium indica
TrendDecoder Premium MT5
Christophe, Pa Trouillas
5 (1)
Identificare i range e le prossime mosse probabili     |    Ottenere i primi segnali e la forza delle tendenze     |    Ottenere uscite chiare prima dell'inversione     |    Individuare i livelli di Fibo che il prezzo testerà   |  Indicatore non tracciante e non ritardato - ideale per il trading manuale e automatizzato - adatto a tutti gli asset e a tutte le unità temporali 50% di sconto   - per il lancio poi torna a   >>   149 $ Dopo l'acquisto,   contattatemi su questo canale  per le impostazi
MetaBands M5
Vahidreza Heidar Gholami
4.67 (3)
MetaBands uses powerful and unique algorithms to draw channels and detect trends so that it can provide traders with potential points for entering and exiting trades. It’s a channel indicator plus a powerful trend indicator. It includes different types of channels which can be merged to create new channels simply by using the input parameters. MetaBands uses all types of alerts to notify users about market events. Features Supports most of the channel algorithms Powerful trend detection algorith
TPSproTREND PrO MT5
Roman Podpora
5 (5)
TPSpro TRENDPRO  - is a trend indicator that automatically analyzes the market and provides information about the trend and each of its changes, as well as giving signals for entering trades without redrawing! The indicator uses each candle, analyzing them separately. referring to different impulses - up or down impulse. Exact entry points into transactions for currencies, crypto, metals, stocks, indices!  -  Version MT4                  DETAILED DESCRIPTION        /       TRADING SETUPS       
Disegna automaticamente i livelli di supporto e resistenza PIÙ i gap delle candele di propulsione sul vostro grafico, in modo da poter vedere dove il prezzo potrebbe dirigersi successivamente e/o potenzialmente invertire. Questo indicatore è stato progettato per essere utilizzato come parte della metodologia di trading di posizione insegnata sul mio sito web (The Market Structure Trader) e visualizza informazioni chiave per il targeting e le potenziali entrate. MT4 Version:  https://www.mql5.
Golden Spikes Detector
Batsirayi L Marango
5 (1)
Golden Spikes Detector This indicator is based on an advanced strategy primarily for trading spikes on Boom and Crash Indices. Complex algorithms were implemented to detect high probability entries only. It alerts on potential Buy and Sell entries. To trade spikes on the Deriv or Binary broker, only take Buy Boom and Sell Cash alerts. It was optimised to be loaded on 5-minute timeframe although multiple timeframe analysis is done in the background. Features ·             Desktop pop up and sound
IX Power MT5
Daniel Stein
5 (2)
IX Power   porta finalmente l'imbattibile precisione di FX Power ai simboli non-Forex. Determina con precisione l'intensità delle tendenze a breve, medio e lungo termine dei vostri indici preferiti, azioni, materie prime, ETF e persino criptovalute. Potete   analizzare tutto ciò che   il vostro terminale ha da offrire. Provatelo e sperimentate come   il vostro tempismo migliori significativamente   durante il trading. Caratteristiche principali di IX Power Risultati di calcolo precisi al
Smart Peak Bottom
Xiaoyu Huang
5 (2)
Questo è un chiaro indicatore per giudicare massimi e minimi e funziona bene per il mercato oscillante. Prezzo promozionale 49$ → 59$ caratteristiche bravo a giudicare alti e bassi Nessun ridisegno, nessuna deriva Calcolo veloce, nessun ritardo Ricca modalità di promemoria È possibile regolare più parametri e colori parametro "======== Principale ========" HighLowPeriod1 = 9 HighLowPeriod2 = 60 HighLowPeriod3 = 34 HighLowEMAPeriod = 4 MASignalPeriod = 5 "======== Notifica ========" UseAle
Altri dall’autore
La strategia di trading di tendenza "Super Trend flessibile Alert EA" si basa sull'indicatore con lo stesso nome "Super Trend flessibile Alert". L'advisor utilizza tutte le informazioni dell'indicatore, quindi l'advisor ha solo tre parametri, questi sono: “Tempo di lavoro” – specifica il periodo di tempo di lavoro, il periodo di tempo in cui viene creato l’indicatore e anche da cui vengono presi i dati “OHLC”. "Stop Loss" è la dimensione costante dello stop loss, misurata in "punti" (puoi veder
Descrizione: L'indicatore "Struttura del mercato HH HL LH LL" è uno strumento potente e allo stesso tempo semplice per analizzare la dinamica dei prezzi nei mercati finanziari. Questo indicatore aiuta i trader e gli investitori a identificare i cambiamenti nelle tendenze e a identificare i punti importanti nelle serie temporali dei prezzi. Componenti chiave dell’indicatore: HH (Higher High): il massimo al quale il prezzo chiude sopra il massimo precedente. HH indica un rafforzamento del t
L'indicatore di tendenza "   Avviso flessibile Super Trend   " ha un minimo di impostazioni. Questo indicatore è progettato per essere il più facile possibile da usare. L'indicatore mostra il trend con una linea principale colorata (linea "SuperTrend", che puoi vedere nella finestra "Finestre dati"). Inoltre, nei punti in cui il trend cambia, l'indicatore mostra delle frecce colorate (   icone "STBuy" e "   STSell", che puoi vedere nella finestra "Finestre dati"       ). Nei punti in cui la tend
L’indicatore mostra una divergenza rialzista e ribassista. L'indicatore stesso (come il normale stocastico) viene visualizzato in una sottofinestra. Interfaccia grafica   : Nella finestra principale vengono creati oggetti grafici "linea di tendenza" - prodotti dal prezzo "Basso" al prezzo "Basso" (per divergenza rialzista) e prodotti dal prezzo "Alto" al prezzo "Alto" (per divergenza ribassista) ). L'indicatore disegna nella sua finestra utilizzando esclusivamente buffer grafici: “Main”, “Signa
L'indicatore 'Supertrend MetaTrader 5' è la base del più semplice sistema di trend trading. Eppure rimane molto efficace. L'indicatore funziona su qualsiasi periodo di tempo (sul periodo di tempo del grafico corrente). Dal nome puoi vedere che questo indicatore segue la tendenza e quando la tendenza cambia, l'indicatore mostra accuratamente il punto del cambiamento di tendenza. La base di "Supertrend MetaTrader 5" è il confronto dei valori del prezzo e dell'indicatore "Average True Range" molti
The Candle Length Indicator Alarm generates a sound alert, sends a push notification and an email when the size of the current candlestick changes. The size of the current candlestick can be measured in two ways: The first method: the size of the candlestick is measured from the beginning of the candlestick (from the OPEN price). The second method: the size of the candlestick is measured from current price. The indicator has the following settings: sound — a sound file from the folder: "...\Meta
The Buy Sell Color Background indicator changes the background color depending on position direction. It has three settings: Background color for BUY - background color for a Buy position Background color for SELL - background color for a Sell position Default background color - background color with no open position After you detach the indicator from a chart, its background color changes to Default background color .
The calculator of signals operates directly from the MetaTrader 5 terminal, which is a serious advantage, since the terminal provides a preliminary selection and sorts out signals. This way, users can see in the terminal only the signals that ensure a maximum compatibility with their trading accounts. The calculator of signals gives the answer to the one of the questions most frequently asked by users of the Signals service: "Will I be able to subscribe to the signal NNN, and what volume of the
Arrow Signal
Vladimir Karputov
Questo indicatore appartiene alla categoria "Stocastico". Ho cercato di semplificare il più possibile il controllo dell'indicatore, quindi le impostazioni minime sono mostrate nei parametri di input: questa è la scelta di un'icona per le frecce di segnale. Il segnale "Acquista" è codificato con il   parametro "Codice freccia Acquista   " e il segnale "Vendi" è codificato con il parametro "   Codice freccia Vendi".   I codici freccia del segnale per i segnali (si prega di utilizzare i valori da 3
Arrow Signal EA
Vladimir Karputov
An Expert Advisor based on the custom indicator. Search for a signal at every tick. Positions are closed by an opposite signal. No trailing. There is no stop loss. There is no take profit. Has a minimum of settings Money management: Lot OR Risk   - type Money management The value for "Money management"   - Money management value Deviation   - admissible slippage Buy Arrow code   (font Wingdings) - character code from 'Wingdings' font for BUY signals Sell Arrow code   (font Wingdings) - characte
Ma Dema Alert
Vladimir Karputov
L'indicatore visualizza tre linee e monitora due tipi di intersezioni. Tre linee dell'indicatore: "   MA   " - indicatore lento "Media mobile", "   DEMA Slow   " - indicatore lento "   Double Exponential Moving Average" e "   DEMA Fast   " - indicatore veloce "Double Exponential Moving Average". Due tipi di intersezioni       : "   Alert Price MA   " - il prezzo attraversa la   linea "MA" e   "   Alert DEMA DEMA   " - le linee si incrociano       "DEMA lento" e   "DEMA veloce   ". Durante l'attr
Questo Expert Advisor appartiene alla classe delle utilità per il trading manuale e semiautomatico. L'"   ordine in sospeso agli estremi del giorno   " EA colloca due ordini in sospeso agli estremi del giorno precedente. Parametro "   Ordini in sospeso: ...       " permette di selezionare il tipo di ordini pendenti: "   Buy Stop e Sell Stop   " o "   Buy Limit e Sell Limit   "   .       estremo       L'offset "Basso" viene eseguito verso il basso). "   Nuovi pendenti -> cancella precedenti   " i
Il pannello di utilità "Panel Partial Closure" è destinato alla rapida chiusura parziale di una posizione che ha un profitto. Ha solo due parametri: "   Chiusura parziale #1   " e "   Chiusura parziale #2   ". Funziona per qualsiasi simbolo e per qualsiasi "numero magico", ovvero l'utilità è destinata principalmente al trading manuale. Come funziona: Ad esempio, hai diverse posizioni su "EURUSD", "Jump 100 Index" e "XAUUSD" (oro). L'utility trova la posizione con il maggior profitto - nello scre
Indicatore MQL5 "Resistenza e supporto giornalieri": disegna linee di supporto e resistenza giornaliere. Il disegno viene eseguito solo con l'ausilio di oggetti grafici (linee di tendenza) - i buffer indicatori non vengono utilizzati in questo indicatore. L'indicatore non ha impostazioni - la ricerca dei livelli viene effettuata sulle ultime 500 barre dall'intervallo di tempo "D1" e questo parametro è cablato all'interno del codice. Trading manuale: Quando si fa trading manualmente, si consigli
L'utility "   Multi Symbol Trailing   " sposta lo Stop Loss per tutte le posizioni attualmente aperte (multi-symbol trailing). È destinato principalmente ad assistere nel trading manuale. Non ci sono restrizioni per l'utilità né per il nome della coppia di valute né per l'identificatore individuale (numero magico): l'utilità elabora assolutamente tutte le posizioni attualmente aperte. L'unità di misura dei parametri "   Trailing Stop   " e "   Trailing Step   " è il punto (la differenza tra il p
L'indicatore di tendenza "Trend Two Moving Average" utilizza due tipi di freccia per visualizzare i risultati del calcolo: "Trend UP" e "Trend DN".       Frecce "Trend Up"       sono disegnate       Di       prezzo       'Basso'       barra   ,       UN       Frecce "Trend DN" -       Di       prezzo       'alto'. L'algoritmo di ricerca dei trend si basa sull'analisi del prezzo di una barra e dei valori di due indicatori di 'Media Mobile'. La direzione del trend è calcolata sulla barra corrente
Three TimeFrames
Vladimir Karputov
Pannello indicatore a tre TimeFrames. L'indicatore è realizzato sotto forma di un pannello basato sulla classe CAppDialog. Il pannello può essere ridotto a icona o spostato all'interno del grafico corrente utilizzando il mouse. L'indicatore mostra tre tempi del simbolo corrente nel pannello. Nella versione attuale, l'indicatore ha un numero minimo di impostazioni: questi sono i parametri di tre periodi di tempo: "Frame di tempo più giovane", "   Frame di tempo   medio   " e "   Frame di tempo  
Constant stream
Vladimir Karputov
Sistema di trading per una varietà di transazioni commerciali. Consente di impostare il saldo in modo che oscilli intorno allo zero, utilizzato per attività di sconto specifiche o simili. Configurato per funzionare con   conti di copertura.   Non può esserci più di una posizione nel mercato   . Un'impostazione generale, il parametro "   Step, Stop Loss, Take Profit   " viene misurato in punti (esempio per EURUSD: 1.00055-1.00045 = 10 punti). L'advisor interrompe il trading (rimanendo sul grafico
L'indicatore mostra i frattali dal periodo di tempo più elevato. È possibile visualizzare due tipi di frattali: 'Frattale regolare' e 'Frattale BW'. Consideriamo la formazione del frattale 'SU'. Il "frattale regolare" è un frattale molto rigoroso in cui ogni successivo prezzo "alto" (a sinistra e a destra della barra centrale) è più piccolo. Mentre in 'BW Fractal' c'è una sola condizione: la barra centrale (il suo prezzo 'alto') deve essere la più alta. Visivamente, la differenza tra queste due
Resistenza al supporto dell'IA Questo è un indicatore che cerca le linee “Supporto” e “Resistenza”. La ricerca viene effettuata utilizzando un algoritmo per l'analisi numerica e l'elaborazione dei dati. Sono disponibili tre opzioni di ricerca (“modalità n. 1”, “modalità n. 2” e “modalità n. 3”). Ognuna di queste opzioni differisce nel suo algoritmo interno (al momento si tratta di impostazioni completamente interne, non sono disponibili per l'utente). Possiamo dire che queste opzioni differiscon
Open Time Manager
Vladimir Karputov
L'utilità "   Open Time Manager   " apre una posizione a un'ora specificata e quindi attiva il trailing classico. L'ora ("   Ora   ":"   Minuti   ") è sempre impostata nel fuso orario GMT con un offset GMT Offset. E' possibile selezionare tre opzioni per l'apertura di una posizione utilizzando il parametro '   Modalità Trade   ': '   ACQUISTARE   ' '   VENDERE   ' '   ACQUISTA e VENDI (contemporaneamente)   ' '   OFF (no scambi, solo lavori finali)   ' Il quarto parametro viene utilizzato quand
Indicatore           mostra le linee "Supporto" e "Resistenza" (queste linee sono disegnate utilizzando lo stile di disegno DRAW_LINE - cioè non sono oggetti grafici). La ricerca di nuovi minimi e massimi avviene a sinistra e a destra della "barra del segnale" - la "barra del segnale" è il centro convenzionale di ogni nuova costruzione. Perché la parola Flessibile nel nome dell'indicatore? Perché abbiamo la possibilità di specificare un numero diverso di barre a sinistra (“Left Bars”) e a destra
Il dashboard scansiona le letture di due indicatori: "MACD" e "Stocastico". Visualizza i segnali in tre colonne: per MACD, per Stocastico e la colonna risultante (se il segnale è lo stesso per entrambi gli indicatori). La scansione può essere selezionata su uno o più intervalli temporali. Se disabiliti tutti gli intervalli di tempo, la dashboard verrà comunque caricata, ma con impostazioni specifiche per questi casi. I segnali vengono sempre controllati per la barra zero (la barra zero è la barr
ATR Bands Alert
Vladimir Karputov
ATR Bands Alert è un indicatore di canale in cui la larghezza del canale viene calcolata come un moltiplicatore costante ("Moltiplicatore") e il valore dell'indicatore "Average True Range". A differenza delle bande di Bollinger, la larghezza di banda non viene modificata così spesso: nell'indicatore ATR Bands Alert, le bande spesso hanno lunghe linee rette. L'interpretazione dell'ATR Bands Alert si basa sul fatto che il prezzo si trova all'interno delle bande per la maggior parte del tempo e,
Filtro:
Nessuna recensione
Rispondi alla recensione
Versione 1.11 2023.11.01
Bug fixes
Versione 1.10 2023.11.01
Rimosse "Francoforte" e "Chicago"