YKL Maps
- Indicatori
- Ygor Keller Luccas
- Versione: 1.0
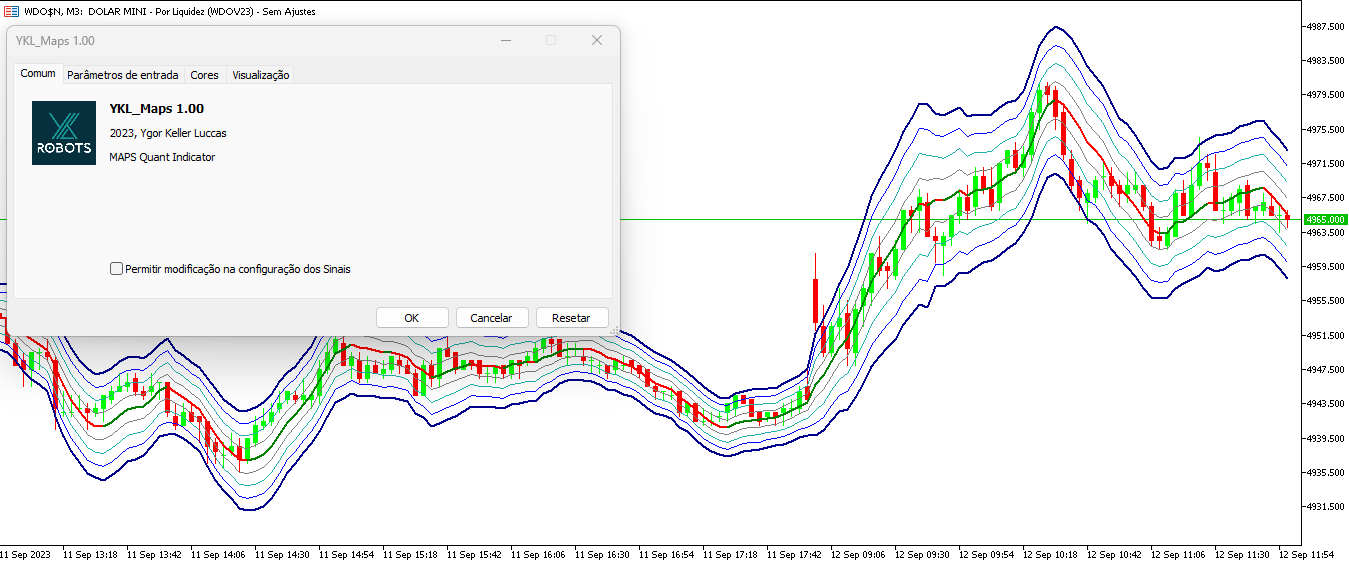
Indicador MAPS
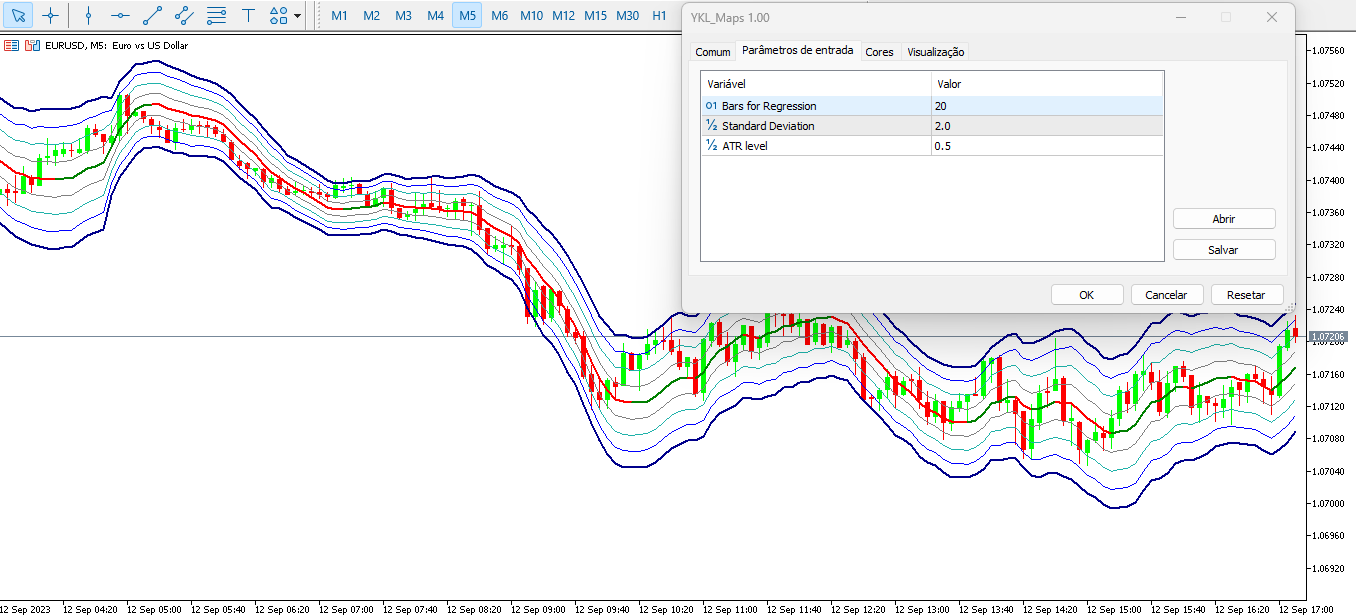
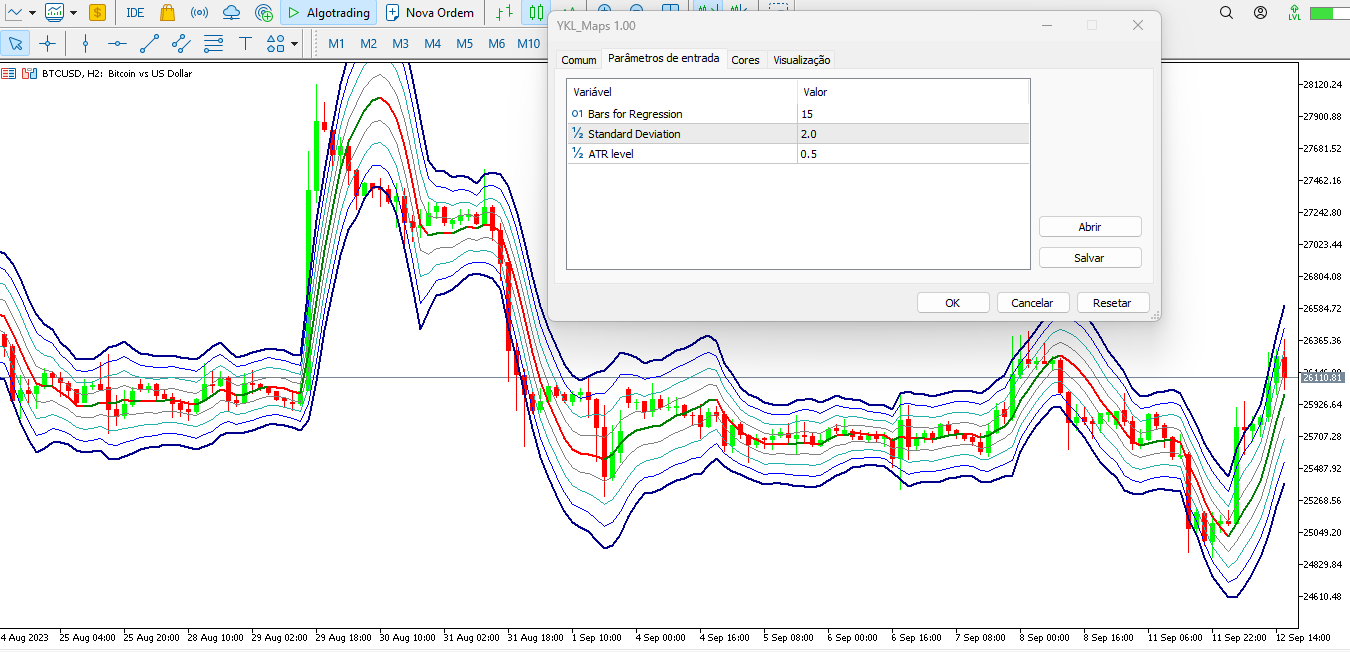
Indicador é um oscilador que faz o plot da Curva de Retorno de uma regressão de segundo grau para os preços de fechamento do ativo do gráfico. A Curva de Retorno é a linha central do indicador MAPS e representa a região de equilíbrio do preço entre vendedores e compradores.
Os plots do indicador são:
- Linha central - C0 - cor da mesma varia de acordo com a tendência do mercado, sendo verde para tendência de alta e vermelho para baixa;
- Linhas superiores: S1, S2, S3 e S4, sendo que a S4 é a mais afastada do centro;
- Linhas inferiores: I1, I2, I3 e I4, sendo que a I4 é a mais afastada do centro.
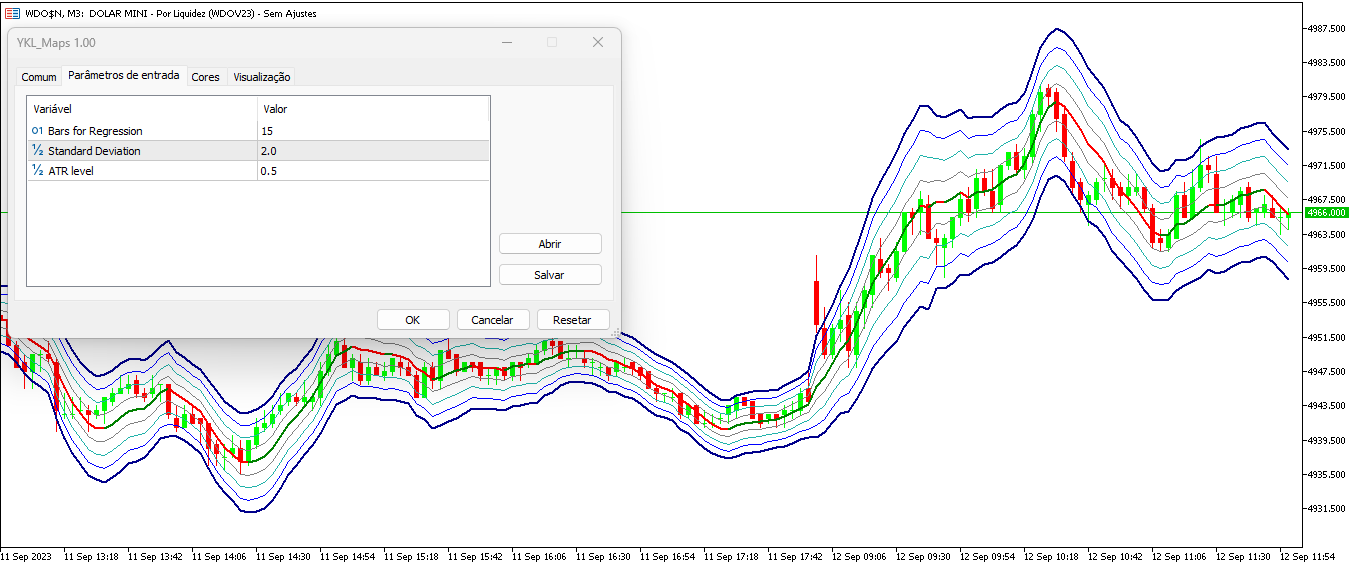
Inputs do indicador:
- Barras de regressão: número de barras para que seja feita a regressão de segundo grau.
- Desvio padrão: é o desvio considerado nos cálculos da regressão de segundo grau.
- Nível ATR: é o tamanho de cada nível (linha do plot) no indicador MAPS. Quanto maior o nível de ATR, maior será o espaçamento entre as linhas do indicador. Considere um nível de ATR 0.5 como sendo um nível equilibrado para que o total de 4 linhas para baixo ou para cima resulte em um valor de 2 desvios padrão da linha central.
Resumo de todos os buffers do indicador:
- Buffer 0 - Linha Superior 1 (S1)
- Buffer 1 - Linha Superior 2 (S2)
- Buffer 2 - Linha Superior 3 (S3)
- Buffer 3 - Linha Superior 4 (S4)
- Buffer 4 - Linha Inferior 1 (I1)
- Buffer 5 - Linha Inferior 2 (I2)
- Buffer 6 - Linha Inferior 3 (I3)
- Buffer 7 - Linha Inferior 4 (I4)
- Buffer 8 - Linha Central (C0)
- Buffer 9 - buffer de coloração da linha central
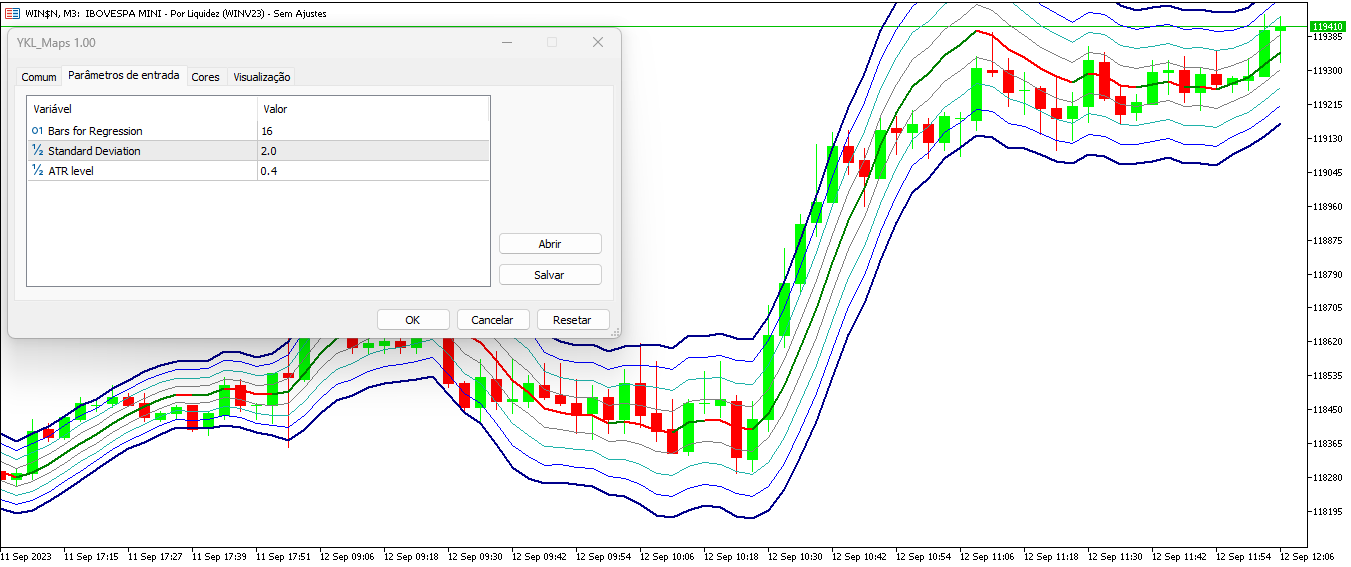
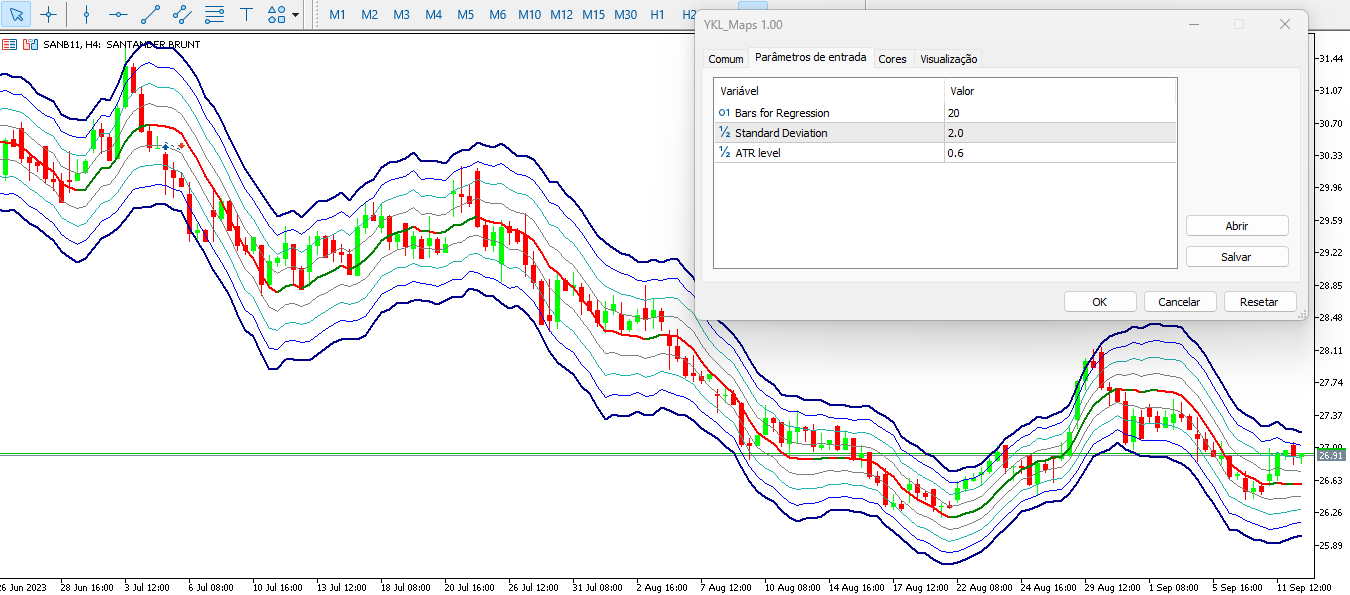
Indicador está otimizado para o par de ativos do WINFUT e WDOFUT da Bolsa Brasileira B3, porém funciona para qualquer ativo incluindo Forex.

GOOD!!!