Breakout Scanner All Symbols
- Indicatori
- Davoud Moghaddam
- Versione: 1.4
- Aggiornato: 21 dicembre 2023
- Attivazioni: 20
All Symbols AND All Time frames Scan |
|---|
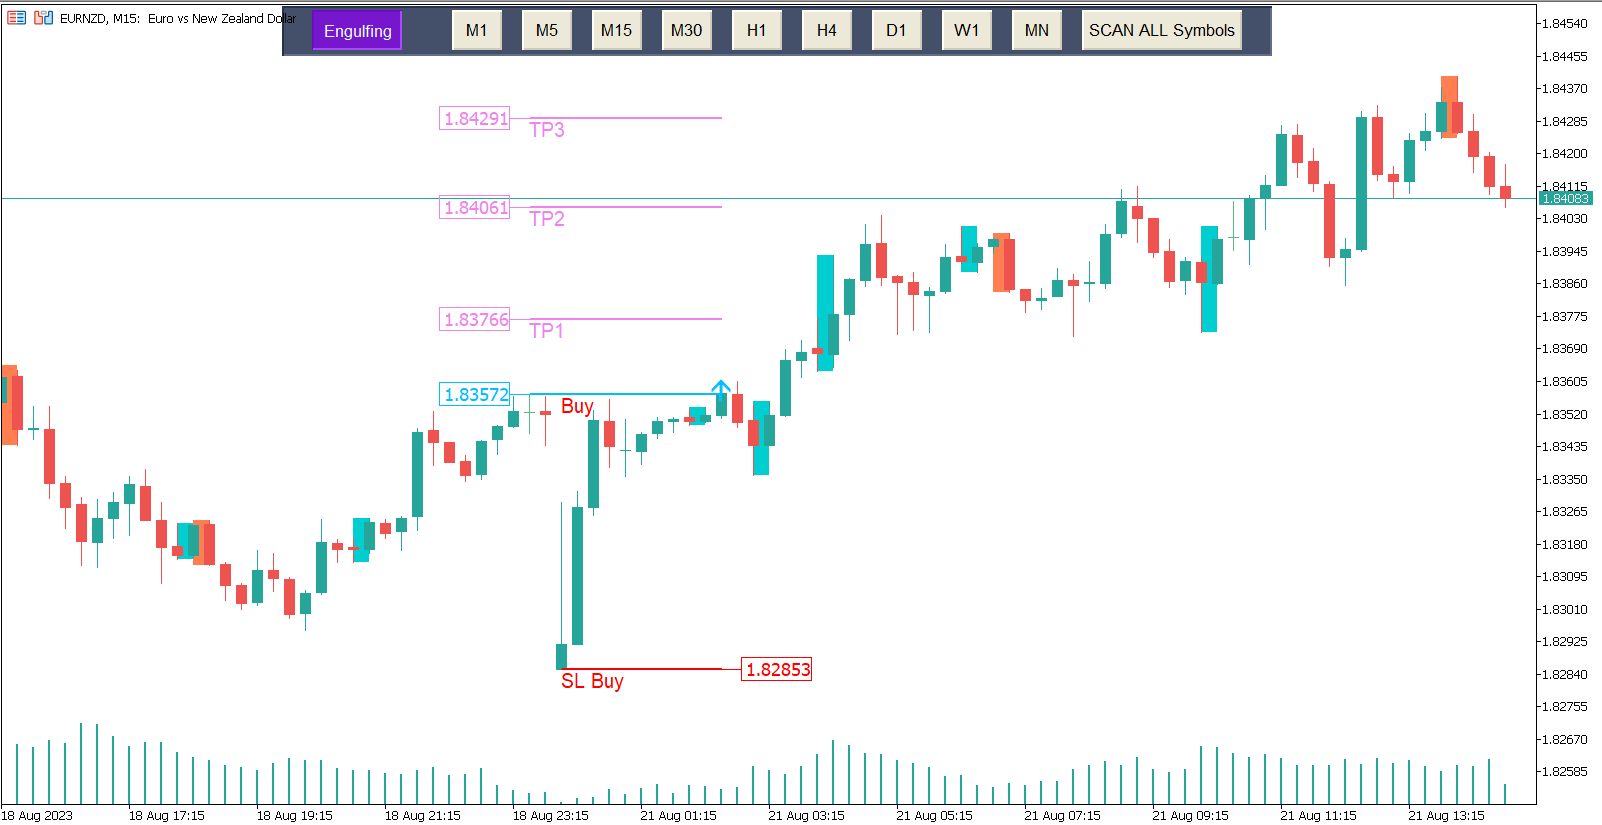
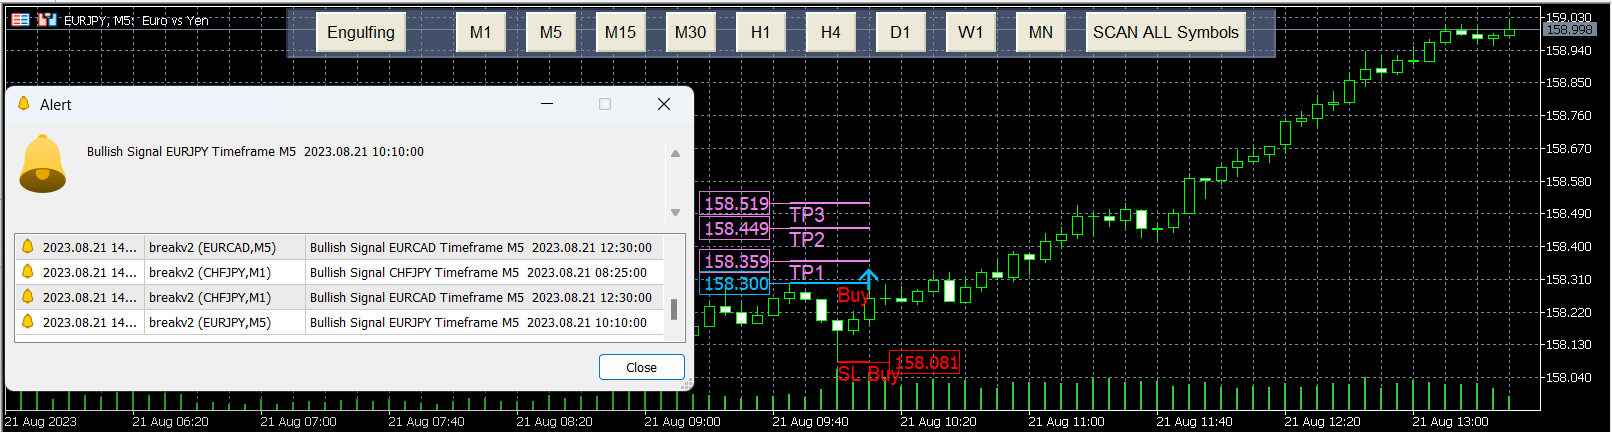
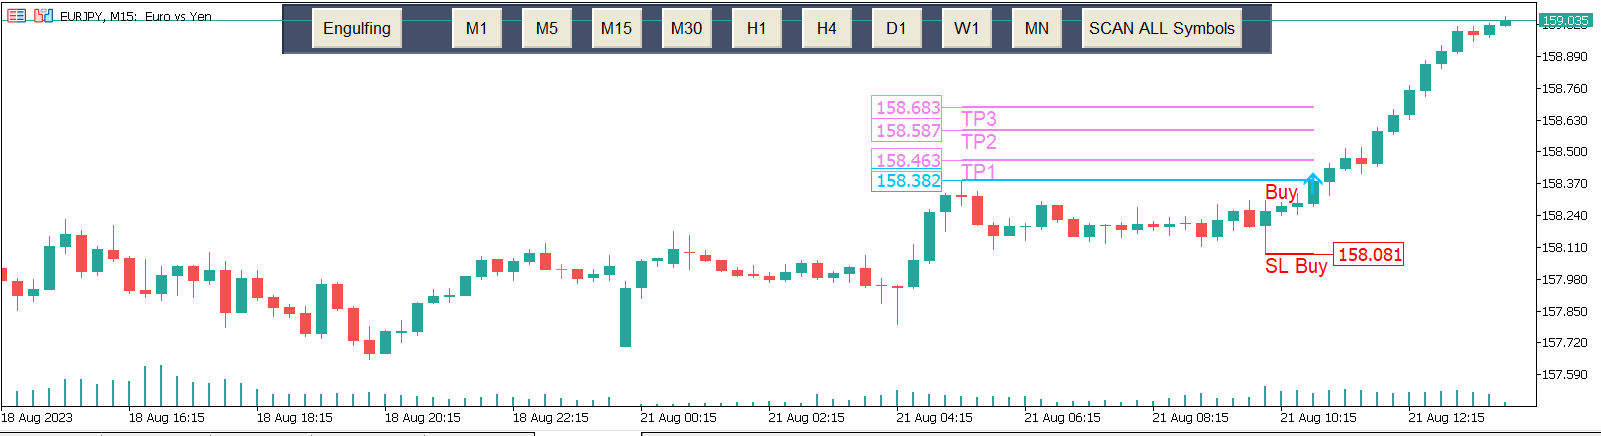
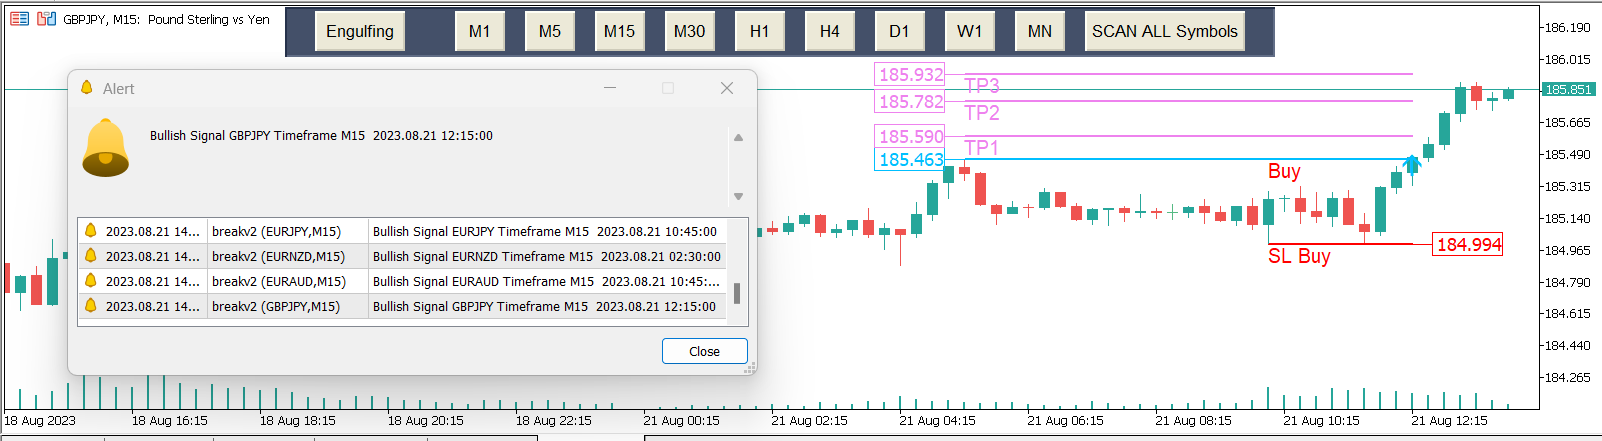
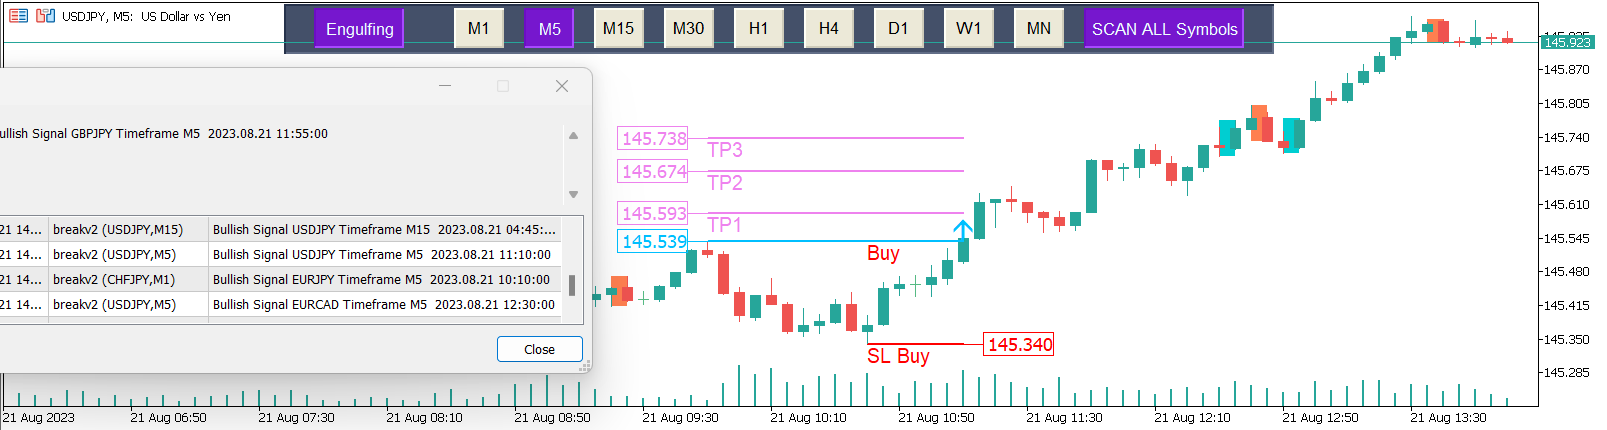
A breakout refers to when the price of an asset moves above a resistance zone or moves below a support zone. A breakout indicates the potential for a price trend to break.Break provides a potential business opportunity. A break from the top signals to traders that it is better to take a buy position or close a sell position. A breakout from the bottom signals to traders that it is better to take sell positions or close their buy positions.
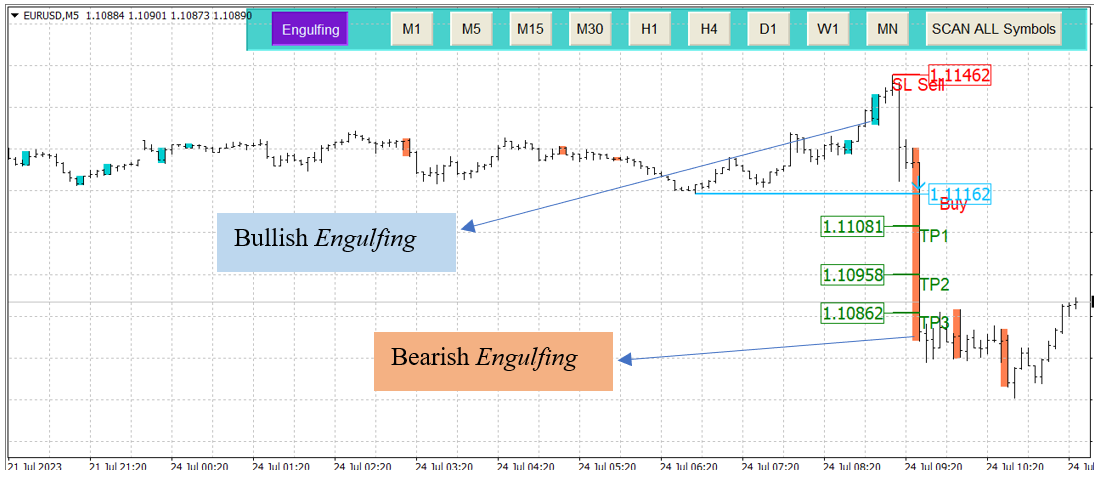
engulfing, Bullish and bearish engulfing candlesticks are a key part of technical analysis, often used to identify reversals in the price of an asset commonly Forex.
Main Features |
|---|
- Easy-to-use and user-friendly indicator
- NO repaint
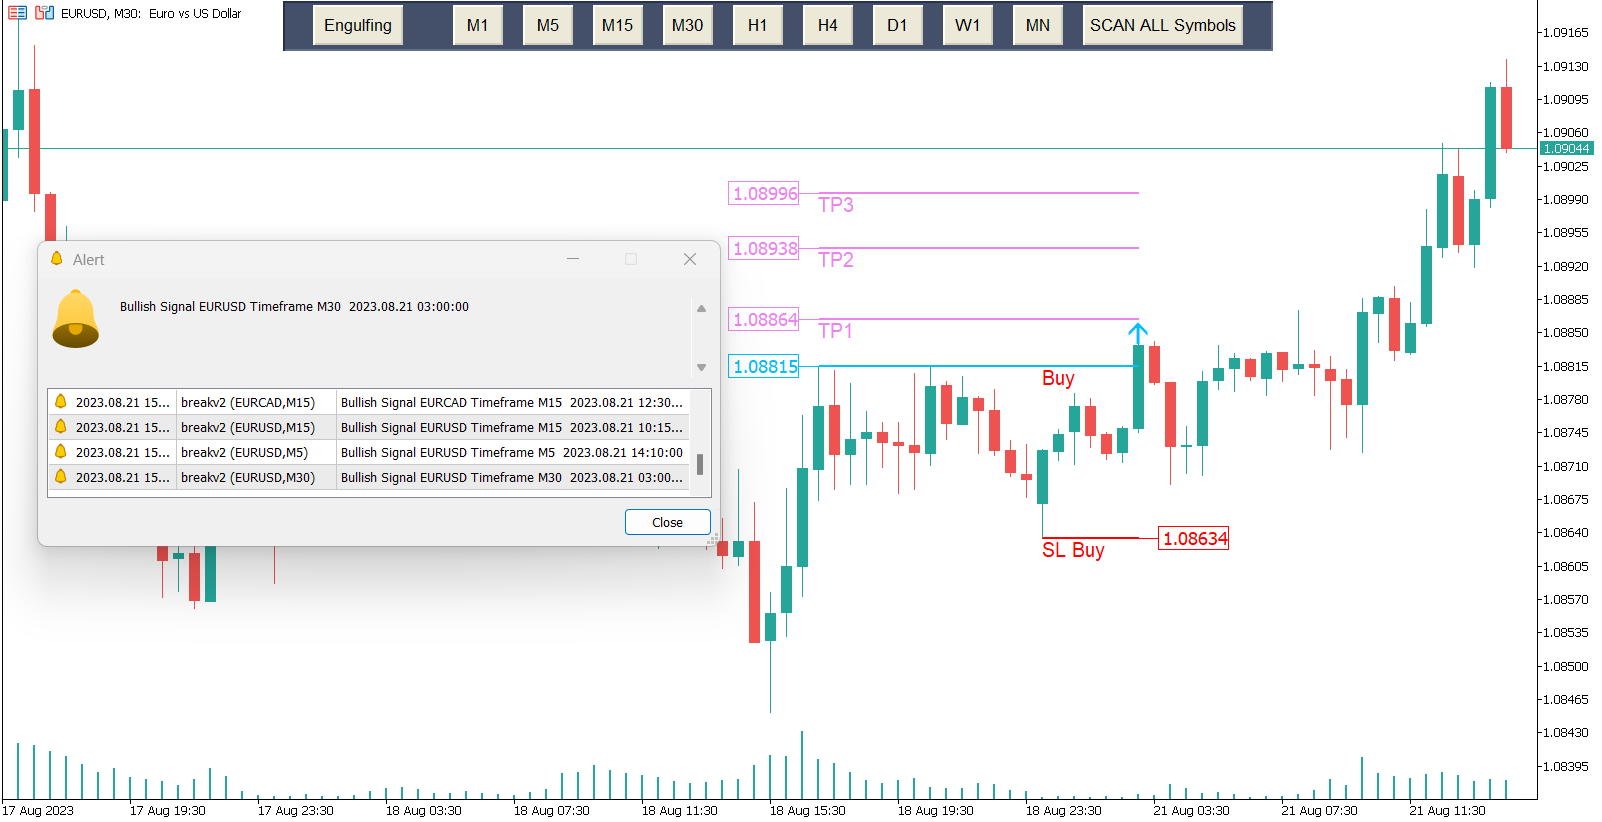
- Sending the alert and push notification and Email
- Fibonacci level is added automatically
- Scan All charts
- Select and deselect time frames button for scan (M1,M5,M15,M30,H1,H4,D1,W1,MN)
- pattern setting
Input Parameters |
|---|
Display / Style Option
- Changing the color of the bullish breakout , bearish breakout,TP,SL
- Changing line thickness
- Changing Fontsize
Alert Settings
- Display Alert, Enable or disable Alert
- Display Notification, Enable or disable Notification
- Send Email, Enable or disable Email
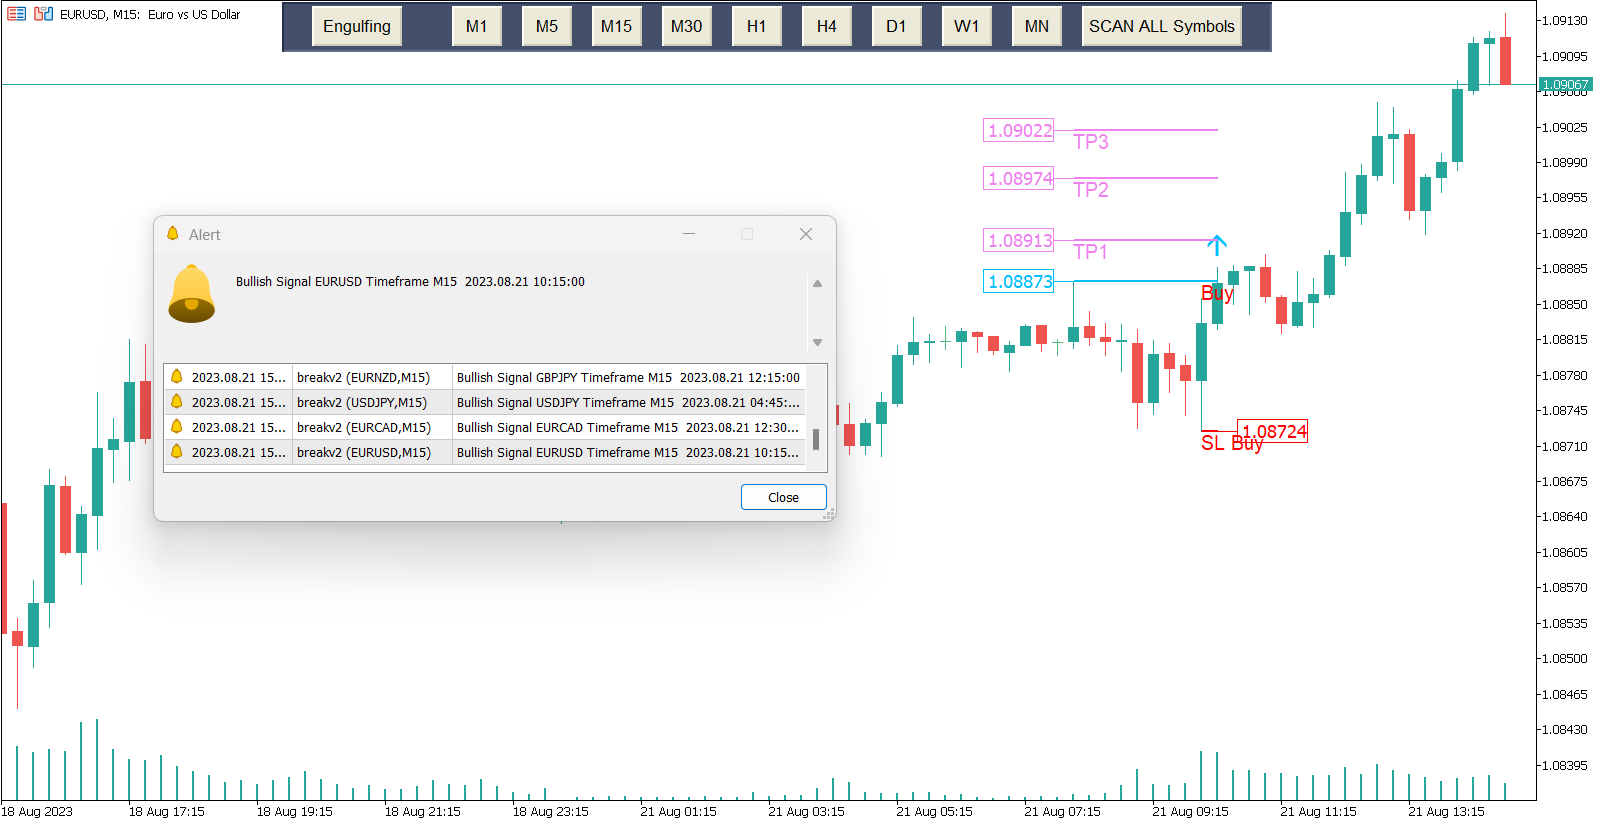
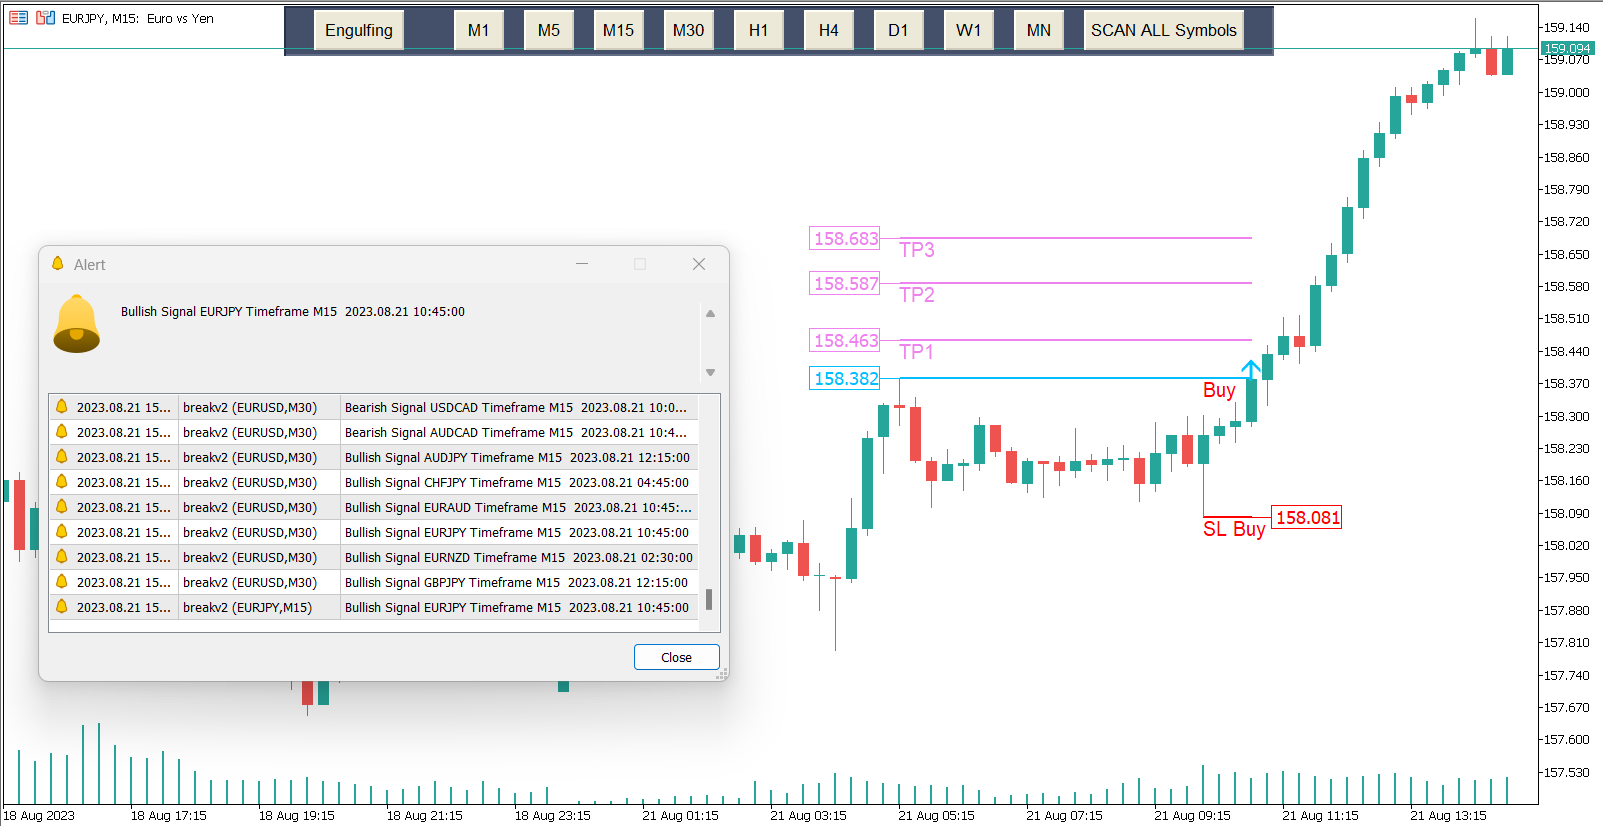
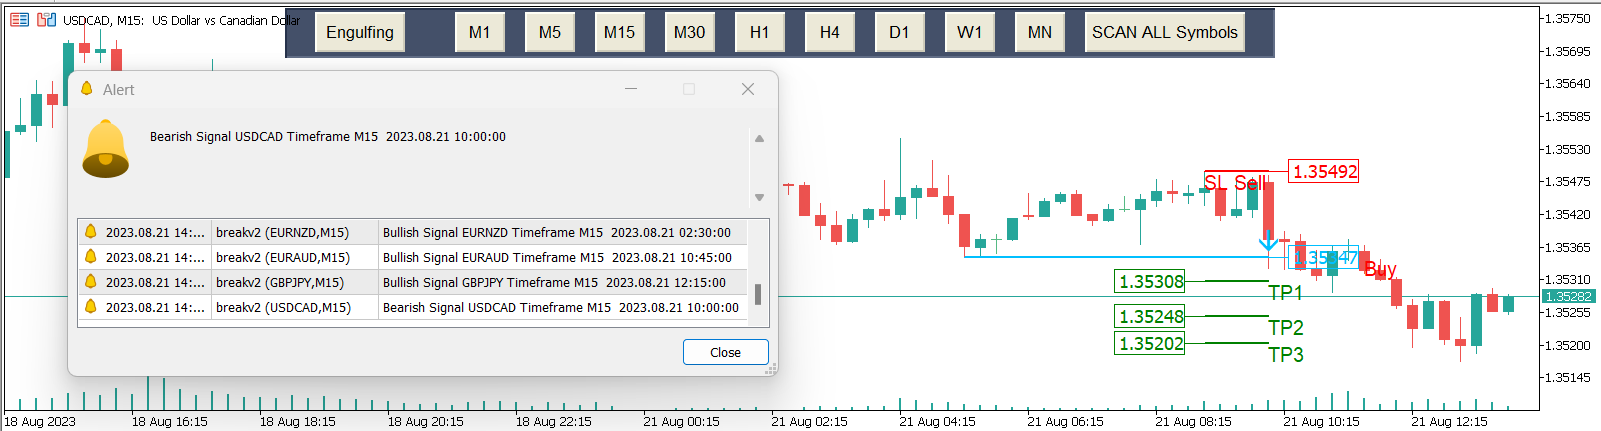


A very useful indicator during the NY Forex session. It alerted me when I was not able to watch the charts, and accurately set the TP and SL levels. Paid for itself with one trade. The only thing I would change is for sell trades the blue open trade line still says, "Buy". I would change that to say "Sell". And it is also difficult to see because it is behind the blue arrow.