Vertical Volume
- Indicatori
- Kim Yonghwa
- Versione: 1.3
- Aggiornato: 2 settembre 2023
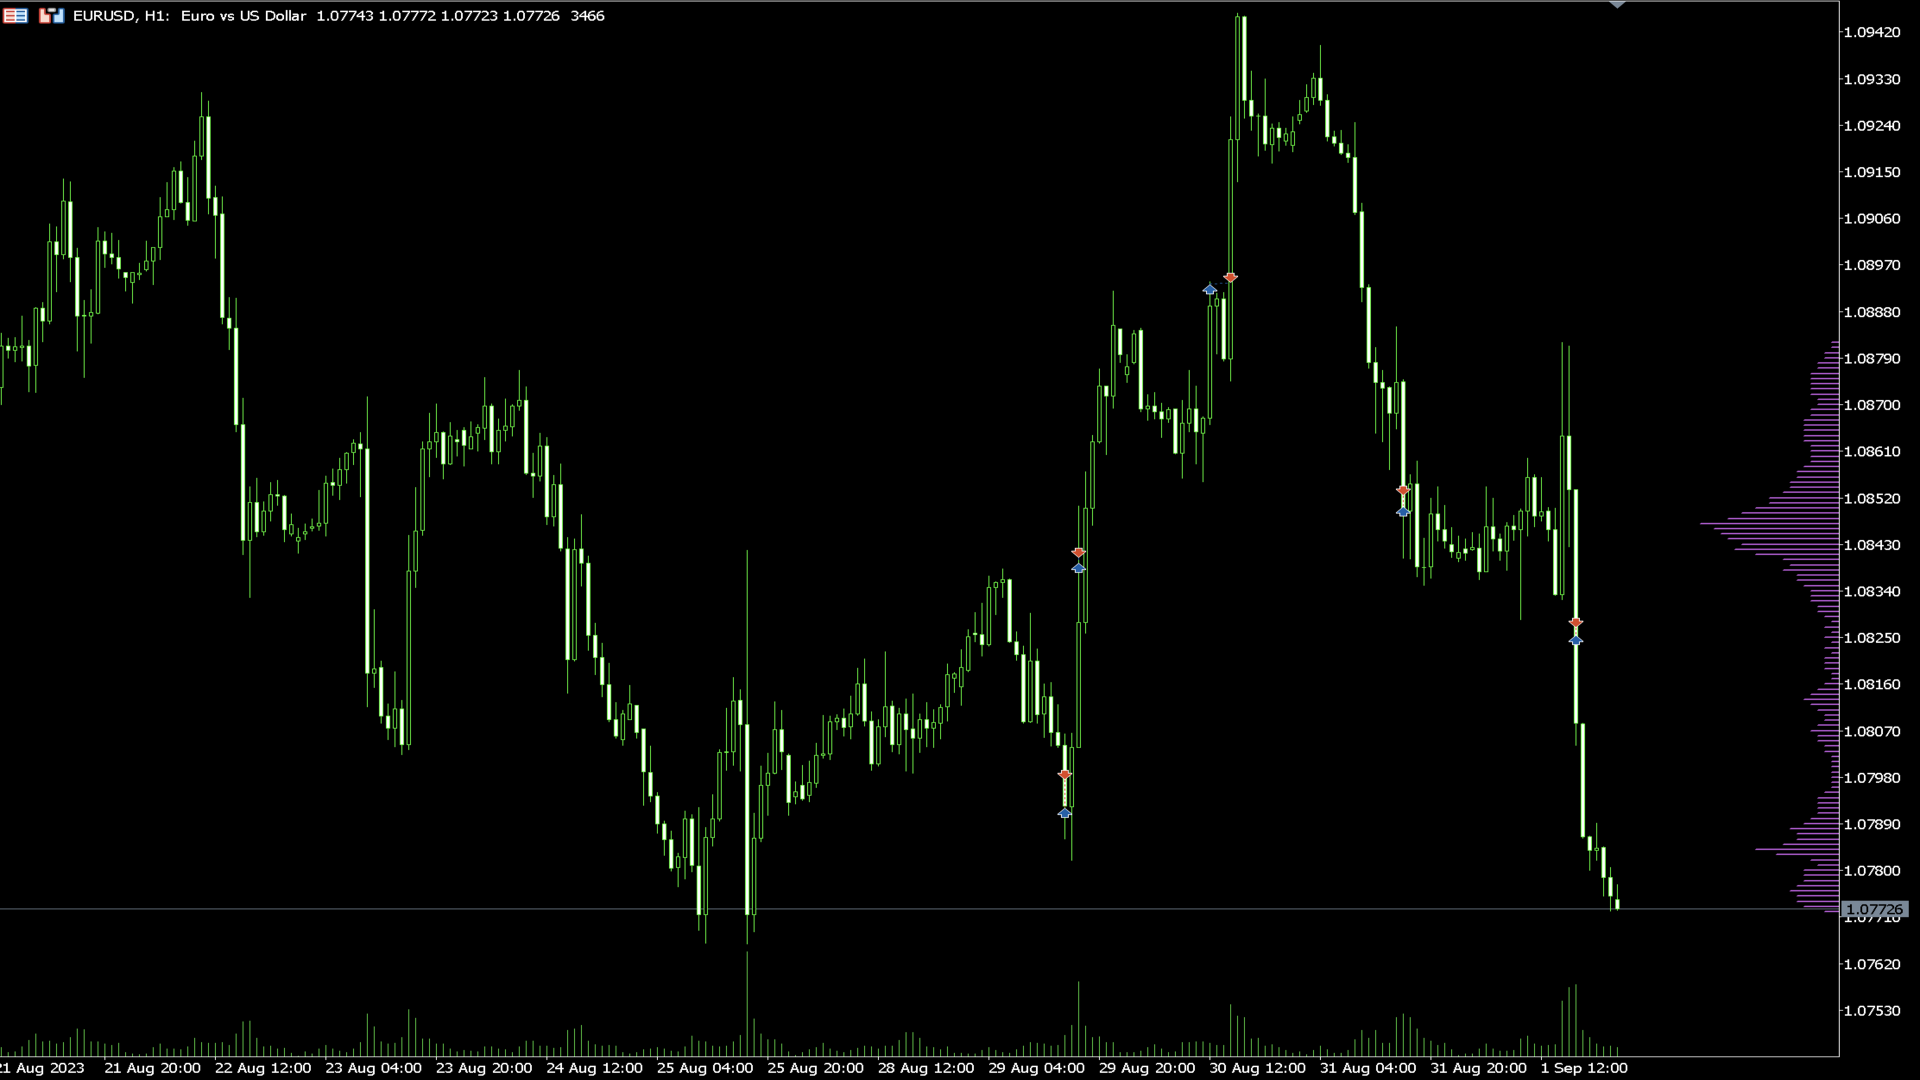
Caratteristiche
- Indicatore per verificare il volume per prezzo.
- Funziona principalmente per EURUSD, su altre coppie di valute potrebbe non funzionare o il calcolo potrebbe richiedere molto tempo.
- Per un uso fluido, attivare l'opzione "Sposta il confine della fine del grafico dal margine destro", come mostrato nello screenshot.
- Quando appare una nuova barra, i dati vengono reimpostati.
Variabili
- COlOR: Impostazione del colore dell'indicatore
- WIDTH: Impostazione della larghezza dell'indicatore
- PERIOD: Determina il periodo di tempo per calcolare i dati


Thank you...