Win rate signal Echidna
- Indicatori
- Eve sense Co., Ltd.
- Versione: 1.21
- Attivazioni: 10
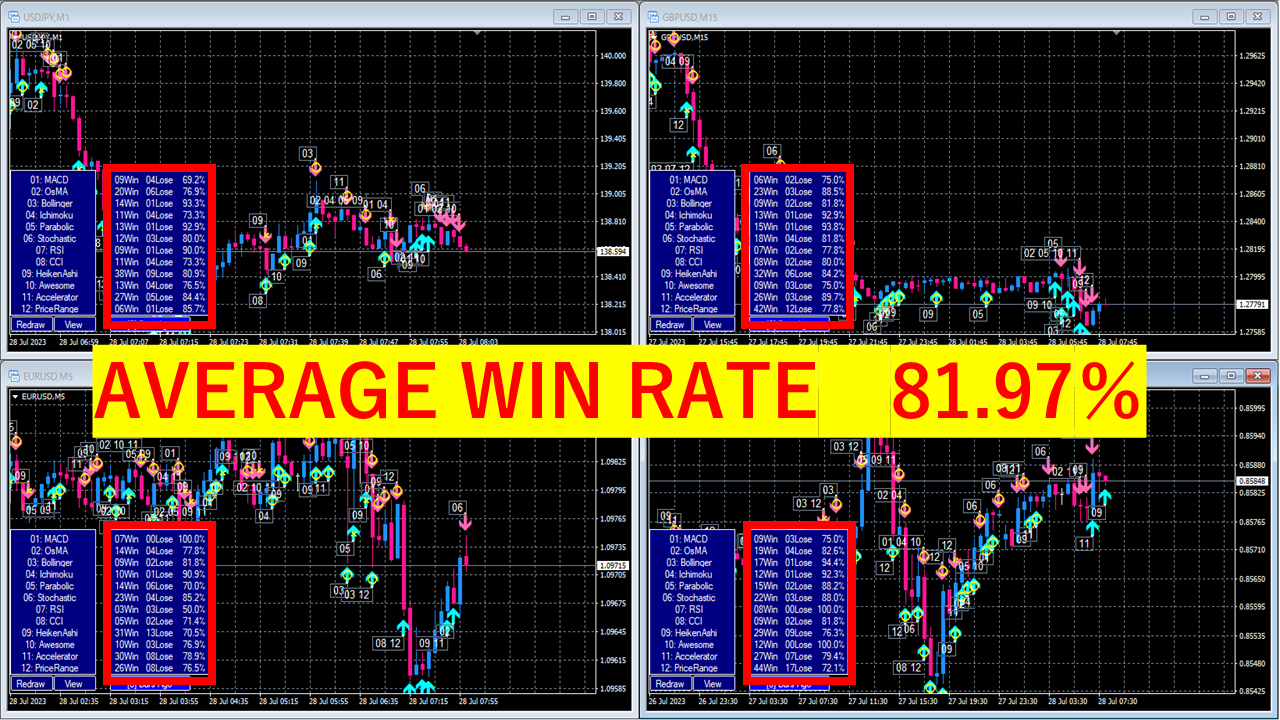
■ 12 tipi di analisi tecnica inclusi! Indicatore dotato di sistema di calcolo del tasso di vincita
【Caratteristiche dell'indicatore】
Questo indicatore consente di confermare in modo intuitivo e chiaro 12 tipi di analisi tecnica normale attraverso segnali di segnale.
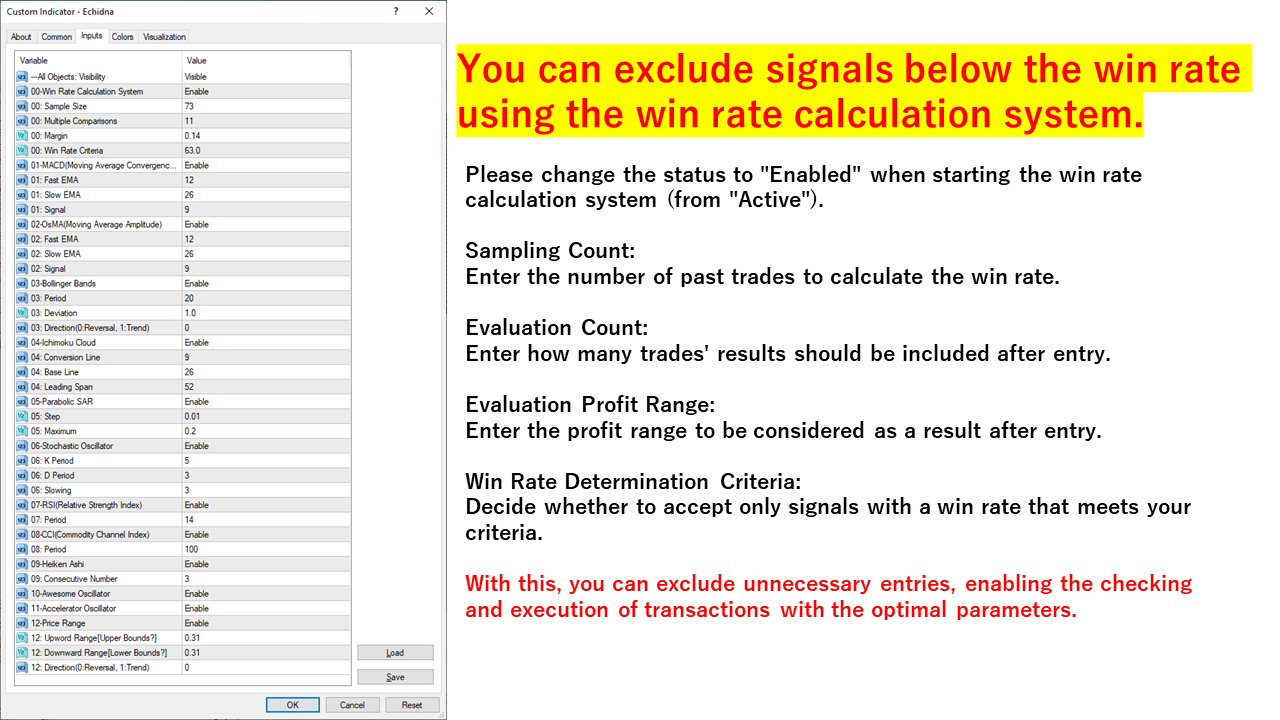
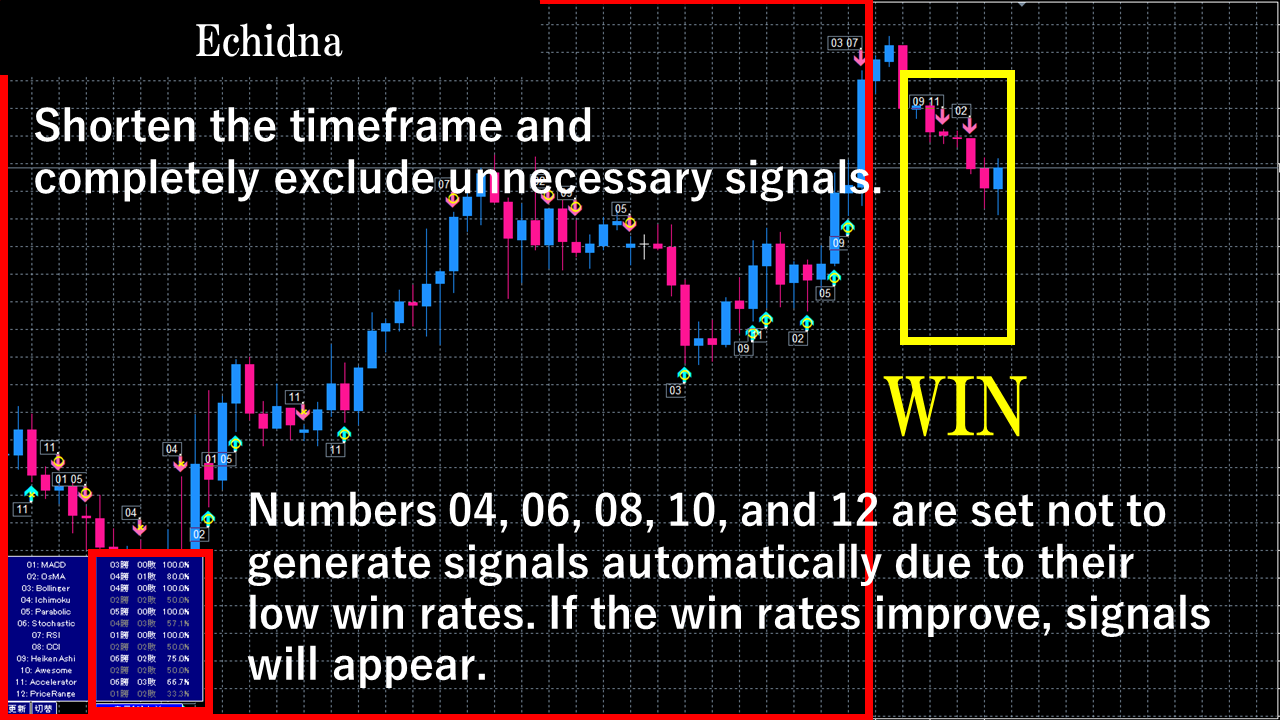
Inoltre, dispone di un sistema di determinazione automatica del tasso di vincita che controlla se i parametri correnti sono adeguati ed evita di emettere segnali quando il tasso di vincita è basso.
Ciò riduce le voci non necessarie e ti consente di entrare in operazioni solo quando la percentuale di vincita è elevata.
【Spiegazione importante】
・Nessuna riverniciatura. Utilizzabile da 1 minuto a grafici settimanali.
・Nessuna restrizione valutaria. Utilizzabile per tutte le coppie di valute.
・Possibilità di calcolare le percentuali di vincita.
・I segnali vengono generati solo quando viene raggiunta la percentuale di vincita predeterminata o superiore.
・Ottimizzato per ridurre il carico! Adatto per il funzionamento a lungo termine e l'uso simultaneo con 9 coppie di valute.
・Essendo un indicatore ben noto, permette di studiare seguendo i segnali.
・Il debug è stato supportato e verificato dai debugger per risolvere eventuali problemi.
【Spiegazione del segno di freccia ECHIDNA】
ECHIDNA Arrow Sign Indicator è uno strumento utile che fornisce 12 tipi di analisi tecnica famosi in tutto il mondo attraverso "segni di freccia".
È progettato per la facilità d'uso e consente l'impostazione di parametri individuali e la rimozione di indicatori non necessari.
Ti guida con segni di freccia basati sugli aspetti tecnici che ritieni importanti.
Caratteristiche:
・Fornisce 12 tipi di analisi degli indicatori tramite "segni freccia".
・Controlla le percentuali di vincita e visualizza i segnali solo quando viene raggiunta la percentuale di vincita predeterminata o superiore.
・Ottimizzato per ridurre il carico, consentendo un utilizzo a lungo termine.
Indicatori supportati:
01-MACD (media mobile convergenza divergenza)
02-OsMA (media mobile dell'oscillatore)
03-Bande di Bollinger
04-Nube Ichimoku
05-SAR parabolico (arresto e inversione)
06-Oscillatore stocastico
07-RSI (indice di forza relativa)
08-CCI (Indice canale merci)
09-Heiken Ashi (barre medie)
10-Fantastico oscillatore
Oscillatore a 11 acceleratori
12 fasce di prezzo
L'indicatore del segno di freccia ECHIDNA è un potente strumento per i trader, che supporta un trading efficiente e accurato.
Con tutti i mezzi, acquisiamo questo indicatore da sogno e miriamo al successo nel trading!