• Panoramica
  • Recensioni
  • Commenti

KT Triple Top Bottom MT5

KT Triple Top-Bottom identifies the triple top/bottom pattern with a breakout signal in the opposite direction. It is used to identify potential trend reversals.

A Triple Top pattern is formed when the price reaches a high point three times, while a Triple Bottom pattern occurs when the price comes to a low point three times.


Features

  • The indicator detects the triple top/bottom pattern with high precision and accuracy.
  • The indicator suggests a shift in momentum, with sellers or buyers taking control.
  • Indicates that the price has reached a resistance or support level multiple times and failed to break through it.
  • It provides a clear visual representation of potential trend reversals.
  • It may give traders an early indication of potential market movements, allowing for profitable trades.
  • It comes with all kind of Metatrader alerts.

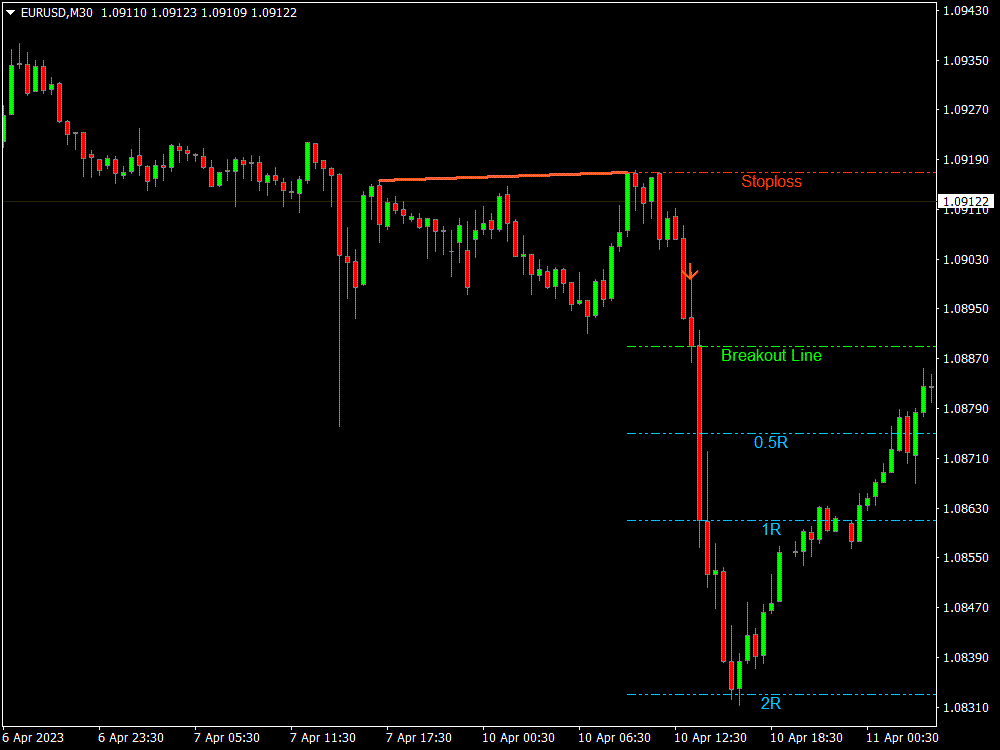
The Triple Top Pattern

When a Triple Top pattern is formed, the price has reached a high point three times and failed to break through, suggesting significant resistance at that level.

This is a positive sign for traders looking to buy, as it clearly indicates where the market may be headed. By identifying the Triple Top pattern, traders can use it to set buy orders at a lower price point, expecting the price to bounce back up after hitting the support level.


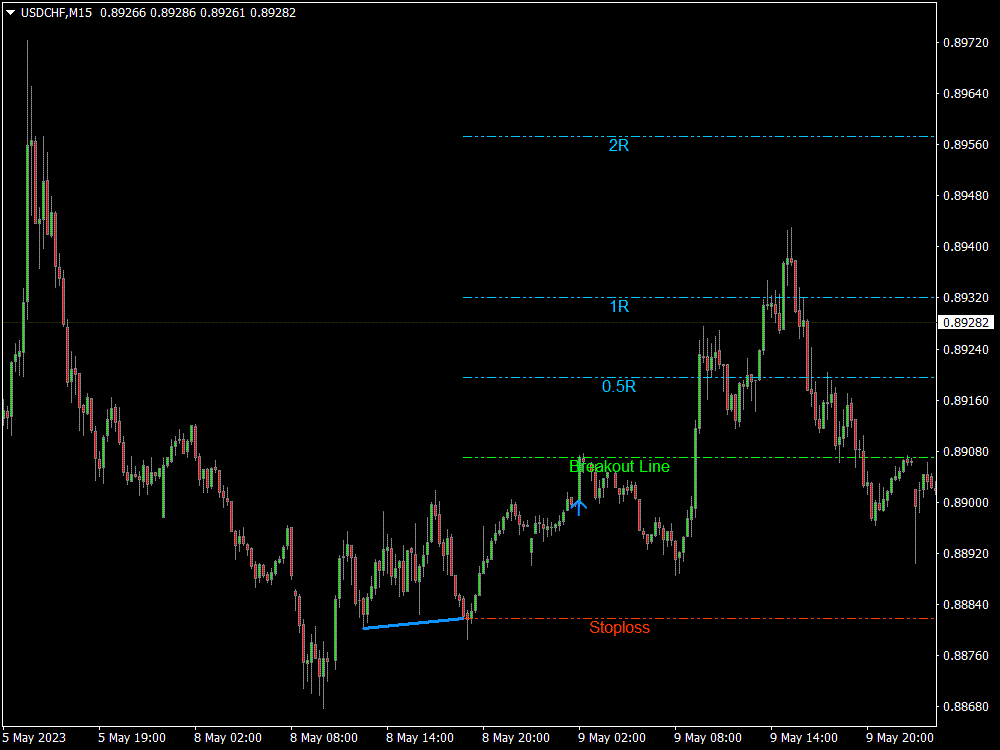
The Triple Bottom Pattern

When a Triple Bottom pattern is formed, the price has reached a low point three times and failed to break through, suggesting significant support at that level.

This is a positive sign for traders looking to sell, indicating where the market may be headed. In addition, by identifying the Triple Bottom pattern, traders can use it to set sell orders at a higher price point, expecting the price to bounce back down after hitting the resistance level.
Prodotti consigliati
KT Horizontal Lines MT5
KEENBASE SOFTWARE SOLUTIONS
In MetaTrader, plotting multiple   horizontal lines   and then tracking their respective price levels can be a hassle. This indicator automatically plots multiple horizontal lines at equal intervals for setting price alerts, plotting support and resistance levels, and other manual purposes. This indicator is suitable for Forex traders who are new and looking for chances to make quick profits from buying and selling. Horizontal lines can help traders find possible areas to start trading when the
The best time to trade Using this Indicator is when the time reach exactly hour,half,45 minutes,15 minutes and sometimes 5 minutes.. This indicators is helpful to those who trade boom and crash indecies.How to read this indicator first you'll see Blue allow and Red allow all these allows used to indicate or to detect the spike which will happen so the allow happens soon before the spike happen.This indicator works properly only in boom and crash trading thing which you have to consider when
ZigZag with Fibonacci
Rafael Caetano Pinto
This indicator uses the metaquotes ZigZag indicator as base to plot fibonacci extension and fibonacci retracement based in the Elliot waves. A fibonacci retracement will be plotted on every wave draw by the ZigZag. A fibonacci extension will be plotted only after the 2nd wave. Both fibonacci will be updated over the same wave tendency. Supporting until 9 consecutive elliot waves. Parameters: Depth: How much the algorithm will iterate to find the lowest and highest candles Deviation: Amoun
VVWAP Bandas
Edipaulo Zanella
Daily VWAP, continues for a period of hours (eg, 10 hours of history), with color to indicate change of direction and bands to map good entry and exit points. The indicator was created to map the center of the market, and find good buying moments, trend analysis or market correction points are easily detected, allowing you to understand moments of exhaustion and buying and selling points Copyright (c) <year> <copyright holders> Permission is hereby granted, free of charge, to any person obtain
QuantumAlert Stoch Navigator is a free indicator available for MT4/MT5 platforms, its work is to provide "alerts" when the market is inside "overbought and oversold" regions in the form of "buy or sell" signals. This indicator comes with many customization options mentioned in the parameter section below, user can customise these parameters as needful. Join our   MQL5 group , where we share important news and updates. You are also welcome to join our private channel as well, contact me for the p
FREE
Stormer RSI 2
Ricardo Rodrigues Lucca
This strategy was learned from Stormer to be used on B3. Basically, 15 minutes before closing the market, it will check RSI and decided if it will open an position. This strategy do not define a stop loss. If the take profit reach the entry price it will close at market the position. The same happens if the maximal number of days is reached. It is created to brazilian people, so all configuration are in portuguese. Sorry Activations allowed have been set to 50.
To download MT4 version please click here . This is the exact conversion from TradingView: "WaveTrend [LazyBear]" By "zeusuk3". One of the coolest indicators out there to detect overbought and oversold zones. It can be used as a part of more complicated strategy and for confirming a potential trade setup. There are buffers to use in EAs also. The indicator is loaded light and non-repaint. - You can message in private chat for further changes you need. Thanks for downloading 
A useful scanner/dashboard that shows the RSI values for multiple symbols and Time-frames. It can be easily hidden/displayed with a simple click on the scanner man top left of the dashboard. You can input upper and lower RSI values and the colours can be set to show when above/below these values. The default values are 70 and 30. There are also input colours for when the RSI is above or below 50 (but not exceeding the upper/lower levels Symbols and time-frames are input separated by commas.
Magic EA MT5
Kyra Nickaline Watson-gordon
Magic EA is an Expert Advisor based on Scalping, Elliot Waves and with filters such as RSI, Stochastic and 3 other strategies managed and decided with the robot smartly. Large number of inputs and settings are tested and optimized and embedded in the program thus inputs are limited and very simple. Using EA doesn't need any professional information or Forex Trading Knowledge. EA can trade on all symbols and all time frames, using special and unique strategies developed by the author. The EA
Follow The Line MT5
Oliver Gideon Amofa Appiah
4.4 (30)
This indicator obeys the popular maxim that: "THE TREND IS YOUR FRIEND" It paints a GREEN line for BUY and also paints a RED line for SELL. (you can change the colors). It gives alarms and alerts of all kinds. IT DOES NOT REPAINT and can be used for all currency pairs and timeframes. Yes, as easy and simple as that. Even a newbie can use it to make great and reliable trades. NB: For best results, get my other premium indicators for more powerful and reliable signals. Get them here: https://www.m
FREE
Exclusive FOREX account HEDGE FuzzyLogicTrendEA is based on fuzzy logic strategy based on  analysis 5 indicators and filters. When the EA analysis all this indicators, it decides, based on its fuzzy strategy, which trade will be better: sell or buy. As additional functions, it´s possible defines spread maximum, stop loss and others. Recomm. Symbol: EURUSD, AUDUSD, GBPUSD, NZDUSD, USDCAD, AUDCAD, EURCAD e USDJPY Recomm. timeframe: H1. Backtest were done on EURUSD, H1, 01/07/2023 - 26/0
Questo indicatore ti mostrerà i valori TP e SL (in quella valuta) che hai già impostato per ogni ordine sui grafici (chiuso alla riga della transazione/ordine) che ti aiuteranno molto a stimare il tuo profitto e la tua perdita per ogni ordine. E ti mostra anche i valori PIP. il formato mostrato è "Valori valutari dei nostri profitti o perdite / valori PIP". Il valore TP sarà mostrato in colore verde e il valore SL sarà mostrato in colore rosso. Per qualsiasi domanda o ulteriori informazioni,
Spike Catch Pro
Amani Fungo
4 (5)
Spike Catch Pro 22:03 release updates Advanced engine for searching trade entries in all Boom and Crash pairs (300,500 and 1000) Programmed strategies improvements Mx_Spikes (to combine Mxd,Mxc and Mxe), Tx_Spikes,   RegularSpikes,   Litho_System,   Dx_System,   Md_System,   MaCross,   Omx_Entry(OP),  Atx1_Spikes(OP),   Oxc_Retracement (AT),M_PullBack(AT) we have added an arrow on strategy identification, this will help also in the visual manual backtesting of the included strategies and see h
FREE
Owl Smart Levels MT5
Sergey Ermolov
4.47 (36)
Versione MT4  |  FAQ L' indicatore Owl Smart Levels è un sistema di trading completo all'interno dell'unico indicatore che include strumenti di analisi di mercato popolari come i frattali avanzati di Bill Williams , Valable ZigZag che costruisce la corretta struttura a onde del mercato, e i livelli di Fibonacci che segnano i livelli esatti di entrata nel mercato e luoghi per prendere profitti. Descrizione dettagliata della strategia Istruzioni per lavorare con l'indicatore Consulente-assistente
Rocket Trend
Andriy Sydoruk
The Rocket Trend indicator is trending. The indicator draws two-color points connected by lines along the chart. This is a trend indicator, it is an algorithmic indicator. It is easy to work and understand when a blue circle appears, you need to buy, when a red one appears, sell. The indicator is used for scalping and pipsing, and has proven itself well. Rocket Trend is available for analyzing the direction of the trend for a specific period of time. Ideal for novice traders learning the laws o
Your Trend Friend
Luigi Nunes Labigalini
The trend is your friend! Look at the color of the indicator and trade on that direction. It does not  repaint. After each candle is closed, that's the color of the trend. You can focus on shorter faster trends or major trends, just test what's most suitable for the symbol and timeframe you trade. Simply change the "Length" parameter and the indicator will automatically adapt. You can also change the color, thickness and style of the lines. Download and give it a try! There are big movements
The new update makes this indicator a complete tool for studying, analyzing and operating probabilistic patterns. It includes: On-chart Multi-asset percentage monitor. Configurable martingales. Twenty-one pre-configured patterns, including Mhi patterns and C3. An advanced pattern editor to store up to 5 custom patterns. Backtest mode to test results with loss reports. Trend filter. Hit operational filter. Martingale Cycles option. Various types of strategies and alerts. Confluence between patter
Are you tired of drawing trendlines every time you're analyzing charts? Or perhaps you would like more consistency in your technical analysis. Then this is for you. This indicator will draw trend lines automatically when dropped on a chart. How it works Works similar to standard deviation channel found on mt4 and mt5. It has 2 parameters: 1. Starting Bar 2. Number of bars for calculation The   starting bar   is the bar which drawing of the trend lines will begin, while the   number of bars for c
FREE
QuantumAlert RSI Navigator is a free indicator available for MT4/MT5 platforms, its work is to provide "alerts" when the market is inside "overbought and oversold" regions in the form of "buy or sell" signals. This indicator comes with many customization options mentioned in the parameter section below, user can customise these parameters as needful. Join our MQL5 group , where we share important news and updates. You are also welcome to join our private channel as well, contact me for the priva
FREE
TrendDetect
Pavel Gotkevitch
The Trend Detect indicator combines the features of both trend indicators and oscillators. This indicator is a convenient tool for detecting short-term market cycles and identifying overbought and oversold levels. A long position can be opened when the indicator starts leaving the oversold area and breaks the zero level from below. A short position can be opened when the indicator starts leaving the overbought area and breaks the zero level from above. An opposite signal of the indicator can
True Day
Aurthur Musendame
5 (1)
True Days is a tool designed specifically for the trader who wants to catch intraday volatility in price charts.  True day makes it easier for the trader to avoid trading in the dead zone - a period in time where markets are considered dead or non volatile. The trader can concentrate on finding opportunities only during periods of profound market movements. By default the indicator gives you a true day starting at 02:00 to 19:00 hours GMT+2. You can adjust according to your Time Zone. By deafult
FREE
Three Candles Pattern
Edson Cavalca Junior
5 (1)
The patterns of 3 (three) Candles: Three White Soldiers; Three Black Crows; These are reversal patterns widely used by traders, as they have a high probability of showing the inversion of the current market movement. For example, if in a bullish trend there are three black crows, there is a high probability of reversing the current bullish movement. The Three White Soldiers have the following characteristics: There are 3 consecutive candles with a good body, that is, the difference between
RevCan Trend Entry MT5
A K M Syedur Rahman
5 (1)
[75% OFF - SALE ENDS SOON] - RevCan Trend Entry Point   is a trend based trade alert indicator for serious traders. It does all the price and chart analysis all by itself, and whenever it finds any potential high quality trading opportunity(Buy or Sell) using its revolutionized price prediction algorithms, it sends instant trade alert directly on the chart, MT4 terminal and on the mobile device.  The trade signals will be visible on the chart as Up and Down arrows, while the instant audible ale
Tops and Bottoms Indicator
Josue De Matos Silva
4.8 (5)
Tops & Bottoms Indicator FREE   Tops abd Bottoms:   An effective indicator for your trades The tops and bottoms indicator helps you to find  ascending and descending channel formations with indications of ascending and/or descending tops and bottoms. In addition, it  show possibles  opportunities with a small yellow circle when the indicator encounters an impulse formation. This indicator provide to you  more security and speed in making entry decisions. Also test our FREE advisor indicator:
FREE
WanaScalper
Isaac Wanasolo
1 (1)
A scalping indicator based on mathematical patterns, which on average gives signals with relatively small SL, and also occasionally helps to catch big moves in the markets (more information in the video) This indicator has three main types of notifications: The first type warns of a possible/upcoming signal on the next bar The second type indicates the presence of a ready signal to enter the market/open a position The third type is for SL and TP levels - you will be notified every time price r
Reversal Vol Propagation
Thalles Nascimento De Carvalho
Are you tired of missing out on trading opportunities by not being able to identify price reversals in time? Do you want to maximize your profits and make informed trading decisions? Introducing the Reversal Vol Propagation Indicator, the revolutionary tool that uses neural networks and volume data to predict potential price reversals. Based on a powerful combination of advanced algorithms and cutting-edge technology, the Reversal Vol Propagation meticulously analyzes volume patterns and past pr
Volume Zone Fractal
Eduardo Da Costa Custodio Santos
VZO Plus è un indicatore che mostra le regioni di ipercomprato e ipervenduto in base al volume scambiato. #Quando la linea dell'indicatore è compresa tra -40 e -60 è ipervenduta #Quando la linea dell'indicatore è tra 40 e 60 è ipercomprato. Al di fuori di queste regioni, il mercato segue per inerzia il suo percorso naturale. Sopra la linea verde, significa che il mercato è positivo, Un altro modo per analizzare l'indicatore è attraverso le regioni di divergenza. Quando abbiamo il minimo più alto
MarketMagnet
Kelly Adediran Raymond
Are you ready to take your trading journey to new heights? Look no further than MarketMagnet, this groundbreaking indicator designed to propel your trading success with excitement and accuracy. Powered by the convergence of Momentum and CCI (Commodity Channel Index), MarketMagnet equips traders with the ultimate tool to determine direction and entry prices for a wide range of recommended currency pairs and instruments. It is designed for traders seeking to scalp for a few pips on lower timeframe
The Antique Trend Indicator is a revolutionary trend trading and filtering solution with all the important features of a trend tool built into one tool! The Antique Trend indicator is good for any trader, suitable for any trader both for Forex and binary options. There is no need to configure anything, everything has been perfected by time and experience, it works great during flats and trends. The Antique Trend indicator is a tool for technical analysis of financial markets, reflecting curre
Double HMA MTF for MT5
Pavel Zamoshnikov
5 (2)
This is an advanced multi-timeframe version of the popular Hull Moving Average (HMA) Features Two lines of the Hull indicator of different timeframes on the same chart. The HMA line of the higher timeframe defines the trend, and the HMA line of the current timeframe defines the short-term price movements. A graphical panel with HMA indicator data from all timeframes at the same time . If the HMA switched its direction on any timeframe, the panel displays a question or exclamation mark with a tex
Gli utenti di questo prodotto hanno anche acquistato
Innanzitutto è importante sottolineare che questo sistema di trading è un indicatore Non-Repainting, Non-Redrawing e Non-Lagging, il che lo rende ideale sia per il trading manuale che per quello automatico. Il "Sistema di Trading Smart Trend MT5" è una soluzione completa pensata sia per i trader principianti che per quelli esperti. Combina oltre 10 indicatori premium e offre più di 7 robuste strategie di trading, rendendolo una scelta versatile per diverse condizioni di mercato. Strategia di Tre
Atomic Analyst MT5
Issam Kassas
5 (11)
Innanzitutto, vale la pena sottolineare che questo indicatore di trading non è repaint, non è ridisegno e non presenta ritardi, il che lo rende ideale sia per il trading manuale che per quello automatico. L'Analista Atomico è un indicatore di azione del prezzo PA che utilizza la forza e il momentum del prezzo per trovare un miglior vantaggio sul mercato. Dotato di filtri avanzati che aiutano a rimuovere rumori e segnali falsi, e aumentare il potenziale di trading. Utilizzando più strati di in
Quantum Trend Sniper
Bogdan Ion Puscasu
5 (37)
Presentazione       Quantum Trend Sniper Indicator   , l'innovativo indicatore MQL5 che sta trasformando il modo in cui identifichi e scambi le inversioni di tendenza! Sviluppato da un team di trader esperti con un'esperienza di trading di oltre 13 anni,       Indicatore Quantum Trend Sniper       è progettato per spingere il tuo viaggio di trading verso nuove vette con il suo modo innovativo di identificare le inversioni di tendenza con una precisione estremamente elevata. *** Acquista Quant
FX Volume MT5
Daniel Stein
4.94 (17)
Ricevi il tuo aggiornamento quotidiano sul mercato con dettagli e schermate tramite il nostro Morning Briefing qui su mql5 e su Telegram ! FX Volume è il PRIMO e UNICO indicatore di volume che fornisce una visione REALE del sentiment del mercato dal punto di vista del broker. Fornisce informazioni straordinarie su come gli operatori di mercato istituzionali, come i broker, sono posizionati sul mercato Forex, molto più velocemente dei rapporti COT. Vedere queste informazioni direttamente sul vo
Trend Screener Pro MT5
STE S.S.COMPANY
4.89 (61)
Indicatore di tendenza, soluzione unica rivoluzionaria per il trading di tendenze e il filtraggio con tutte le importanti funzionalità di tendenza integrate in un unico strumento! È un indicatore multi-timeframe e multi-valuta al 100% non ridipingibile che può essere utilizzato su tutti i simboli/strumenti: forex, materie prime, criptovalute, indici e azioni. Trend Screener è un indicatore di tendenza che segue un indicatore efficiente che fornisce segnali di tendenza a freccia con punti nel gra
FX Power MT5 NG
Daniel Stein
5 (4)
Ricevi il tuo aggiornamento quotidiano sul mercato con dettagli e schermate tramite il nostro Morning Briefing qui su mql5 e su Telegram ! FX Power MT5 NG è la nuova generazione del nostro popolare misuratore di forza delle valute, FX Power. Cosa offre questo misuratore di forza di nuova generazione? Tutto ciò che avete amato dell'FX Power originale IN PIÙ Analisi della forza di ORO/XAU Risultati di calcolo ancora più precisi Periodi di analisi configurabili individualmente Limite di calcolo pe
Top indicator for MT5   providing accurate signals to enter a trade without repainting! It can be applied to any financial assets:   forex, cryptocurrencies, metals, stocks, indices .  Watch  the video  (6:22) with an example of processing only one signal that paid off the indicator! MT4 version is here It will provide pretty accurate trading signals and tell you when it's best to open a trade and close it. Most traders improve their trading results during the first trading week with the help of
Innanzitutto, vale la pena sottolineare che questo Strumento di Trading è un Indicatore Non-Ridipingente, Non-Ridisegnante e Non-Laggante, il che lo rende ideale per il trading professionale. L'Indicatore Smart Price Action Concepts è uno strumento molto potente sia per i nuovi che per i trader esperti. Racchiude più di 20 utili indicatori in uno solo, combinando idee di trading avanzate come l'Analisi del Trader del Circolo Interno e le Strategie di Trading dei Concetti del Denaro Intelligen
RelicusRoad Pro MT5
Relicus LLC
4.82 (22)
Ora $ 147 (aumentando a $ 499 dopo alcuni aggiornamenti) - account illimitati (PC o MAC) Manuale utente di RelicusRoad + Video di formazione + Accesso al gruppo Discord privato + Stato VIP UN NUOVO MODO DI GUARDARE IL MERCATO RelicusRoad è l'indicatore di trading più potente al mondo per forex, futures, criptovalute, azioni e indici, fornendo ai trader tutte le informazioni e gli strumenti di cui hanno bisogno per rimanere redditizi. Forniamo analisi tecniche e piani di trading per aiutar
Auto Order Block with break of structure based on ICT and Smart Money Concepts Futures Break of Structure ( BoS )             Order block ( OB )            Higher time frame Order block / Point of Interest ( POI )    shown on current chart           Fair value Gap ( FVG ) / Imbalance   ,  MTF      ( Multi Time Frame )    Volume Imbalance     ,  MTF          vIMB Gap’s Equal High / Low’s     ,  MTF             EQH / EQL Liquidity               Current Day High / Low           HOD /
AW Trend Predictor MT5
AW Trading Software Limited
4.76 (55)
La combinazione di trend e livelli di rottura in un unico sistema. Un algoritmo di indicatore avanzato filtra il rumore del mercato, determina la tendenza, i punti di ingresso e i possibili livelli di uscita. I segnali indicatori sono registrati in un modulo statistico, che permette di selezionare gli strumenti più adatti, mostrando l'efficacia dello storico dei segnali. L'indicatore calcola i segni Take Profit e Stop Loss. Manuale e istruzioni ->   QUI   / versione MT4 ->   QUI Come fare tradi
Blahtech Supply Demand MT5
Blahtech Limited
4.57 (14)
Was: $299  Now: $99   Supply Demand uses previous price action to identify potential imbalances between buyers and sellers. The key is to identify the better odds zones, not just the untouched ones. Blahtech Supply Demand indicator delivers functionality previously unavailable on any trading platform. This 4-in-1 indicator not only highlights the higher probability zones using a multi-criteria strength engine, but also combines it with multi-timeframe trend analysis, previously confirmed swings
ICT, SMC, SMART MONEY CONCEPTS, SMART MONEY, Smart Money Concept, Support and Resistance, Trend Analysis, Price Action, Market Structure, Order Blocks, BOS/CHoCH,   Breaker Blocks ,  Momentum Shift,   Supply&Demand Zone/Order Blocks , Strong Imbalance,   HH/LL/HL/LH,    Fair Value Gap, FVG,  Premium  &   Discount   Zones, Fibonacci Retracement, OTE, Buy Side Liquidity, Sell Side Liquidity, BSL/SSL Taken, Equal Highs & Lows, MTF Dashboard, Multiple Time Frame, BigBar, HTF OB, HTF Market Structure
L'indicatore Quadrato di Gann è uno strumento potente di analisi di mercato basato sull'articolo "Formula Matematica per le Previsioni di Mercato" scritto da W.D. Gann. Questo strumento utilizza concetti matematici e teorie di Gann per effettuare un'analisi precisa del mercato. Utilizza i quadrati di 144, 90, 52 e anche il quadrato di 9. Inoltre, integra il metodo del  per il quadrato di 9 e la sua relazione con canali e modelli stellari di quel quadrato. Manuale Utente e Applicazione: Prima di
TPSproTREND PrO MT5
Roman Podpora
5 (5)
TPSpro TRENDPRO  - is a trend indicator that automatically analyzes the market and provides information about the trend and each of its changes, as well as giving signals for entering trades without redrawing! The indicator uses each candle, analyzing them separately. referring to different impulses - up or down impulse. Exact entry points into transactions for currencies, crypto, metals, stocks, indices!  -  Version MT4                  DETAILED DESCRIPTION        /       TRADING SETUPS       
Advanced Supply Demand MT5
Bernhard Schweigert
4.53 (15)
La migliore soluzione per qualsiasi principiante o trader esperto! Questo indicatore è uno strumento di trading unico, di alta qualità e conveniente perché abbiamo incorporato una serie di funzionalità proprietarie e una nuova formula. Con questo aggiornamento, sarai in grado di mostrare fusi orari doppi. Non solo potrai mostrare una TF più alta, ma anche entrambe, la TF del grafico, PIÙ la TF più alta: SHOWING NESTED ZONES. Tutti i trader di domanda di offerta lo adoreranno. :) Informazioni imp
Disegna automaticamente i livelli di supporto e resistenza PIÙ i gap delle candele di propulsione sul vostro grafico, in modo da poter vedere dove il prezzo potrebbe dirigersi successivamente e/o potenzialmente invertire. Questo indicatore è stato progettato per essere utilizzato come parte della metodologia di trading di posizione insegnata sul mio sito web (The Market Structure Trader) e visualizza informazioni chiave per il targeting e le potenziali entrate. MT4 Version:  https://www.mql5.
A key element in trading is zones or levels from which decisions to buy or sell a trading instrument are made. Despite attempts by major players to conceal their presence in the market, they inevitably leave traces. Our task was to learn how to identify these traces and interpret them correctly. Reversal First Impulse levels (RFI)   -  Version MT4                  INSTRUCTIONS                 RUS                 ENG                         R ecommended to use with an indicator   -  TREND PRO  
Il profitto dalla struttura del mercato cambia quando il prezzo si inverte e si ritira. L'indicatore di avviso di inversione della struttura del mercato identifica quando una tendenza o un movimento di prezzo si sta avvicinando all'esaurimento e pronto a invertire. Ti avvisa dei cambiamenti nella struttura del mercato che in genere si verificano quando stanno per verificarsi un'inversione o un forte pullback. L'indicatore identifica inizialmente i breakout e lo slancio del prezzo, ogni volta
Presentazione       Quantum Breakout PRO   , l'innovativo indicatore MQL5 che sta trasformando il modo in cui scambi le zone di breakout! Sviluppato da un team di trader esperti con un'esperienza di trading di oltre 13 anni,       Quantum Breakout PRO       è progettato per spingere il tuo viaggio di trading a nuovi livelli con la sua strategia innovativa e dinamica della zona di breakout. Quantum Breakout Indicator ti fornirà frecce di segnalazione sulle zone di breakout con 5 zone target
TrendLine PRO MT5
Evgenii Aksenov
4.78 (49)
The Trend Line PRO indicator is an independent trading strategy. It shows the trend change, the entry point to the transaction, as well as automatically calculates three levels of Take Profit and Stop Loss protection Trend Line PRO is perfect for all Meta Trader symbols: currencies, metals, cryptocurrencies, stocks and indices Advantages of Trend Line PRO Never redraws its signals The possibility of using it as an independent strategy It has three automatic levels Take Profit and Stop Loss lev
XQ Indicator MetaTrader 5
Marzena Maria Szmit
5 (1)
Step into the realm of Forex trading with confidence and precision using XQ, a cutting-edge Forex indicator designed to elevate your trading game to unprecedented heights. Whether you're a seasoned trader or just stepping into the world of currency exchange, XQ Forex Indicator empowers you with the insights and signals needed to make informed trading decisions. The signal conditions are a combination of three indicators, and XQ Forex Indicator only display  medium and long-term trends . The ind
Trend Line Map Pro MT5
STE S.S.COMPANY
4.67 (9)
Trend Line Map indicator is an addons for   Trend Screener Indicator . It's working as a scanner for all signals generated by Trend screener ( Trend Line Signals ) . It's a Trend Line Scanner based on Trend Screener Indicator.  If you don't have Trend Screener Pro Indicator,   the Trend Line Map Pro will not work.     LIMITED TIME OFFER : Trend Line Map Indicator is available for only 50 $ and lifetime. ( Original price 125$ ) By accessing to our MQL5 Blog,  you can find all our premium indica
TrendDecoder Premium MT5
Christophe, Pa Trouillas
5 (1)
Identificare i range e le prossime mosse probabili     |    Ottenere i primi segnali e la forza delle tendenze     |    Ottenere uscite chiare prima dell'inversione     |    Individuare i livelli di Fibo che il prezzo testerà   |  Indicatore non tracciante e non ritardato - ideale per il trading manuale e automatizzato - adatto a tutti gli asset e a tutte le unità temporali 50% di sconto   - per il lancio poi torna a   >>   149 $ Dopo l'acquisto,   contattatemi su questo canale  per le impostazi
MetaBands M5
Vahidreza Heidar Gholami
4.67 (3)
MetaBands uses powerful and unique algorithms to draw channels and detect trends so that it can provide traders with potential points for entering and exiting trades. It’s a channel indicator plus a powerful trend indicator. It includes different types of channels which can be merged to create new channels simply by using the input parameters. MetaBands uses all types of alerts to notify users about market events. Features Supports most of the channel algorithms Powerful trend detection algorith
Was: $249  Now: $99   Market Profile defines a number of day types that can help the trader to determine market behaviour. A key feature is the Value Area, representing the range of price action where 70% of trading took place. Understanding the Value Area can give traders valuable insight into market direction and establish the higher odds trade. It is an excellent addition to any system you may be using. Inspired by Jim Dalton’s book “Mind Over Markets”, this indicator is designed to suit the
Malaysian SNR Levels
Matthias Horst Pieroth
This indicator can be used to display Support and Resistance levels according to  the  Malaysian SNR concept , in which Support and Resistance are exact levels of a line chart. Malaysian SNR There are 3 different horizontal levels in Malaysian SNR: A-Level : This level is located at the peak of this line chart. (shape looks like the letter A) V-Level : Level at the valley of a line chart, (shape looks like the letter V) Gap-Leve l: This level is located at the Close/Open gap between two cand
Volume by Price MT5
Brian Collard
5 (3)
The Volume by Price Indicator for MetaTrader 5 features Volume Profile and Market Profile TPO (Time Price Opportunity). Get valuable insights out of currencies, equities and commodities data. Gain an edge trading financial markets. Volume and TPO histogram bar and line charts. Volume Footprint charts. TPO letter and block marker charts including split structures. Versatile segmentation and compositing methods. Static, dynamic and flexible ranges with relative and/or absolute visualizations. Lay
ICT Silver Bullet MT5
Haidar, Lionel Haj Ali
5 (19)
ICT Silver Bullet If you are searching for a reliable indicator to trade the ICT Silver Bullet concept, or ICT concepts, Smart Money Concepts, or SMC, this indicator will respond to your need!  Before version 2.2, this indicator was focused only on ICT Silver Bullet, but moving forward, we will include the different elements for smart money concept trading. This indicator will help you identify the following: FVG - fair value gaps Market structure: BOS and CHOCH. It is based on ZIGZAG as it is
Account Graph MT5
Kyra Nickaline Watson-gordon
5 (1)
An indicator to draw a graph of account current and historical state such as Balance, Equity, Margin, Free Margin, Margin Level, Drawdown, Account Profit, Deposit and Withdrawals. Indicator Inputs : Draw Balance Graph Draw Equity Graph Draw Margin Graph Draw Free Margin Graph Draw Margin Level Graph Draw Drawdown Graph Draw Account Profit Graph Hide Data on Chart and Buffers Connect Gaps by Lines Sign of DDs on Profit Sign of DDs on Loss Tips : The Indicator will draw historical balance gra
Altri dall’autore
If you trade Forex, having detailed information about the currency strength and currency pairs correlation can take your trading to new heights. The correlation will help to cut your risk in half, and strength analysis will help to maximize the profits. This indicator provides a hybrid approach for selecting the most appropriate currency pairs using the strength analysis and currency pairs correlation. How to use the Currency Strength Analysis Suppose your trading strategy provides a buying o
KT Trend Magic MT5
KEENBASE SOFTWARE SOLUTIONS
KT Trend Magic shows the trend depiction on chart using the combination of market momentum and volatility. A smoothing coefficient is used to smooth out the noise from the signal.It can be used to find out the new entries or confirm the trades produced by other EA or indicator. Features Drag n drop MTF scanner which scans for the new signals across multiple time-frames. Find new entries in the trend direction. Improve the accuracy of other indicators when used in conjunction. Can be used as a
ACB Breakout Arrows
KEENBASE SOFTWARE SOLUTIONS
4.17 (35)
The ACB Breakout Arrows indicator provides a crucial entry signal in the market by detecting a special breakout pattern. The indicator constantly scans the chart for a settling momentum in one direction and provide the accurate entry signal right before the major move.  Get multi-symbol and multi-timeframe scanner from here - Scanner for ACB Breakout Arrows MT4 Key features Stoploss and Take Profit levels are provided by the indicator. Comes with a MTF Scanner dashboard which tracks the brea
KT Currency Strength and Correlation MT5
KEENBASE SOFTWARE SOLUTIONS
5 (1)
If you trade Forex, having detailed information about the currency strength and currency pairs correlation can take your trading to new heights. The correlation will help to cut your risk in half, and strength analysis will help to maximize the profits. This indicator provides a hybrid approach for selecting the most appropriate currency pairs using the strength analysis and currency pairs correlation. How to use the Currency Strength Analysis Suppose your trading strategy provides a buying o
ACB Breakout Arrows MT5
KEENBASE SOFTWARE SOLUTIONS
5 (1)
The ACB Breakout Arrows indicator provides a crucial entry signal in the market by detecting a special breakout pattern. The indicator constantly scans the chart for a settling momentum in one direction and provide the accurate entry signal right before the major move. Get multi-symbol and multi-timeframe scanner from here - Scanner for ACB Breakout Arrows MT 5 Key features Stoploss   and Take Profit levels are provided by the indicator. Comes with a MTF Scanner dashboard which tracks the br
KT Asian Breakout MT5
KEENBASE SOFTWARE SOLUTIONS
KT Asian Breakout carefully analyzes the range-bound market during the Asian session and then fires a long or short trade after doing some preassessment based on its inbuilt technical analysis module. The executed orders are closed within a day before the completion of the next day session. The inbuilt technical analysis module checks for the session range and compares it with the last 20 days price movement. If it finds any erratic price movement within the session, the orders are not execute
KT RSI Divergence Robot MT4
KEENBASE SOFTWARE SOLUTIONS
KT RSI Divergence robot is a 100% automated expert advisor that trades regular and hidden divergence built between the price and Relative Strength Index (RSI) oscillator. The divergence signals are fetched from our freely available RSI divergence indicator. Not every divergence ends up in a successful price reversal, that's why this ea combines the raw divergences signals with its inbuilt technical analysis module to exploit the price inefficiency that occurs after some selected divergence si
KT Ichimoku Trader MT5
KEENBASE SOFTWARE SOLUTIONS
1 (1)
KT Ichimoku Trader is a fully automated expert advisor that offers five popular trading strategies based on the Ichimoku indicator. Each strategy has it's own entry and exit method without any interference to other strategies. The Ichimoku system can be applied to all major currency pairs and metals. However, we found that it performs reasonably well mainly on two pairs.   MT4 Version is available here  https://www.mql5.com/en/market/product/35041 Features Trade up to 5 famous trading strate
KT Auto Fibo MT5
KEENBASE SOFTWARE SOLUTIONS
5 (1)
KT Auto Fibo draws Fibonacci retracement levels based on the ongoing trend direction. The Highs and Lows are automatically selected using the Maximum and Minimum points available on the chart. You can zoom in/out and scroll to adjust the Fibonacci levels accordingly. Modes Auto:  It draws the Fibonacci levels automatically based on the chart area. Manual:  It draws the Fibonacci levels only one time. After that, you can change the anchor points manually. Usage: Helps to predict the future p
KT Heiken Ashi Smoothed MT5
KEENBASE SOFTWARE SOLUTIONS
KT Heiken Ashi Smoothed is a smoothed version of the standard Heiken Ashi. Moreover, it also plots buy/sell arrows on a trend change. A buy arrow is plotted when it change to a bullish state from bearish state. A sell arrow is plotted when it change to a bearish state from bullish state. Mobile notifications, Email, Sound and Pop-up alerts included. What exactly is Heiken Ashi Smoothed? It filters out the false signals and noise in the standard Heiken Ashi. It applies the set of two moving a
KT Trend Magic
KEENBASE SOFTWARE SOLUTIONS
KT Trend Magic shows the trend depiction on chart using the combination of market momentum and volatility. A smoothing coefficient is used to smooth out the noise from the signal.It can be used to find out the new entries or confirm the trades produced by other EA/Indicators. Usage Drag n drop MTF scanner which scans for the new signals across multiple time-frames. Find new entries in the trend direction. Improve the accuracy of other indicators when used in conjunction. Can be used as a dyna
KT Stoch Divergence MT4
KEENBASE SOFTWARE SOLUTIONS
Divergence is one of the vital signals that depicts the upcoming price reversal in the market. KT Stoch Divergence shows the regular and hidden divergences build between the price and stochastic oscillator. Limitations of KT Stoch Divergence Using the Stochastic divergence as a standalone entry signal can be risky. Every divergence can't be interpreted as a strong reversal signal. For better results, try to combine it with price action and trend direction. Features Marks regular and hidde
KT CCI Divergence MT5
KEENBASE SOFTWARE SOLUTIONS
KT CCI Divergence shows the regular and hidden divergence created between the price and CCI oscillator. Divergence is one of the vital signals that depicts the upcoming price reversal in the market. Manually spotting the divergence between price and CCI can be a hectic and ambiguous task. Limitations of KT CCI Divergence   Using the CCI divergence as a standalone entry signal can be risky. Every divergence can't be interpreted as a strong reversal signal. For better results, try to combine it
ACB Trade Filter MT4
KEENBASE SOFTWARE SOLUTIONS
5 (2)
The ACB Trade Filter indicator provides a solution for filtering out the low probability trading setups in a trading strategy. The indicator uses a sophisticated filtration algorithm based on the market sentiment and trend. Applications Works great with our indicator " ACB Breakout Arrows ". Filter out low probability signals from any indicator. Avoid overtrading and minimize the losses. Trade in the direction of market sentiment and trend. Avoid the choppiness in the market. How to use Only
KT Momentum Arrows
KEENBASE SOFTWARE SOLUTIONS
KT Momentum Arrows Indicator is based on a momentary breakout which is calculated using the bands deviation and emerging volatility in a certain direction. A buy signal is generated when the price close above the upper band and a sell signal is generated when the price close below the lower band. A magnitude coefficient is used as the input which affects the band deviation and volatility at the same time. The coefficient value should be carefully selected and analyzed based on the instrument and
KT COG Advanced MT4
KEENBASE SOFTWARE SOLUTIONS
1 (1)
KT COG is an advanced implementation of the center of gravity indicator presented by John F. Ehlers in the May 2002 edition of Technical Analysis of Stocks & Commodities magazine. It's a leading indicator which can be used to identify the potential reversal points with the minimum lag. The COG oscillator catches the price swings quite effectively. MT5 version of the same indicator is available here KT COG Advanced MT5 Calculation of COG The COG indicator is consist of the two lines. The mai
KT Pin Bar
KEENBASE SOFTWARE SOLUTIONS
KT Pin Bar identifies the pin bar formation which is a type of price action pattern which depicts a sign of reversal or rejection of the trend. When combined with support and resistance, BRN and other significant levels, Pin Bar pattern proved to be a very strong sign of reversal. Basically, a pin bar is characterized by a small body relative to the bar length which is closed either in upper or lower 50% part of its length. They have very large wicks and small candle body. A pin bar candlest
KT Auto Fibo
KEENBASE SOFTWARE SOLUTIONS
KT Auto Fibo draws Fibonacci retracement levels based on the ongoing trend direction. The Highs and Lows are automatically selected using the Maximum and Minimum points available on the chart. You can zoom in/out and scroll to adjust the Fibonacci levels accordingly. Modes Auto:  It draws the Fibonacci levels automatically based on the chart area. Manual: It draws the Fibonacci levels only one time. After that, you can change the anchor points manually. Usage: Helps to predict the future pr
KT Psar Arrows
KEENBASE SOFTWARE SOLUTIONS
KT Psar Arrows plots the arrows on chart using the standard Parabolic SAR indicator. A bullish arrow is plotted when the candle's high touch the SAR. A bearish arrow is plotted when the candle's low touch the SAR. The signals are generated in the real-time without waiting for the bar close.  Features A beneficial tool for traders who want to experiment with the trading strategies that include the use of Parabolic Sar indicator.  Can be used to find turning points in the market. Use custom PSA
KT Ichimoku Trader
KEENBASE SOFTWARE SOLUTIONS
1 (1)
KT Ichimoku Trader is a fully automated expert advisor that offers five popular trading strategies based on the Ichimoku indicator. Each strategy has it's own entry and exit method without any interference to other strategies. The Ichimoku system can be applied to all major currency pairs and metals. However, we found that it performs reasonably well mainly on two pairs.   MT5 Version is available here  https://www.mql5.com/en/market/product/35043 Features Trade up to 5 famous trading strate
KT Volatility Oscillator
KEENBASE SOFTWARE SOLUTIONS
KT Volatility oscillator analyze the past and current market data with a mathematical formula to display the result in a form of an oscillator. The growing and deteriorating waves are equivalent to high and low volatility in the asset.  In a nutshell, volatility is simply a measurement of the price fluctuation of an asset over a certain period of time. Without volatility, there would not much movement in the market and traders would not be able to profit from the price movements. Use of Volati
KT COG Robot
KEENBASE SOFTWARE SOLUTIONS
KT COG Robot is a fully automated Expert Advisor based on the KT COG Indicator . The COG indicator was originally presented by John F. Ehlers in the May 2002 edition of Technical Analysis of Stocks & Commodities magazine. The EA fires a long trade when COG line cross above the signal line and a short trade is fired when the COG line cross below the signal line.  Adaptive Filtration Our adaptive filtration algorithm combines the original COG formula with the major trend direction and market ac
ACB Breakout Arrows EA
KEENBASE SOFTWARE SOLUTIONS
This is a 100% automated expert advisor based on our custom indicator named "ACB Breakout Arrows" . The entries are based on a breakout pattern that constantly occurs in a bi-directional manner. The intensity of entry signals can be manipulated using the external input called "Signal Sensitivity". MT5 Version is available here  https://www.mql5.com/en/market/product/35785 Trades Confirmation ACB Breakout Arrows EA provides an ability to filter the entries using our another custom indicator n
KT Asian Breakout
KEENBASE SOFTWARE SOLUTIONS
4 (1)
KT Asian Breakout carefully analyzes the range-bound market during the Asian session and then fires a long or short trade after doing some preassessment based on its inbuilt technical analysis module. The executed orders are closed within a day before the completion of the next day session. The inbuilt technical analysis module checks for the session range and compares it with the last 20 days price movement. If it finds any erratic price movement within the session, the orders are not execute
KT London Breakout
KEENBASE SOFTWARE SOLUTIONS
First thirty minutes are essential for a trading session. The early reaction of traders and market players sets a path for the rest of the day. KT London Breakout EA takes advantage of this phenomenon, and after analyzing the first thirty minutes of London session, it places two bidirectional pending orders. One of pending order is eventually canceled after realizing the market direction with certainty. It has been strictly tested and developed for EUR/JPY using 30-Min Time Frame. You can ex
Use of support and resistance in systematic trading is very subjective. Every trader has their own idea and way to plotting the support and resistance levels on the chart. KT Support and Resistance indicator take out this ambiguity out of the situation and automatically draws support and resistance levels following an algorithmic approach using a unique multi-timeframe analysis. When launched on the chart, It immediately scan the most significant extreme points across all the available timefr
MACD Divergence Seeker
KEENBASE SOFTWARE SOLUTIONS
KT MACD Divergence Seeker trades the regular and hidden divergence signals generated by our free indicator named KT MACD Divergence indicator. Trading the standalone divergences can be a risky affair that's why the KT MACD Divergence Seeker combines the standard divergence signals with an advanced analysis module to exploit the price inefficiencies on some FX pairs. What is the Divergence exactly? As a general conception if the price is making higher highs, then macd should also be making
KT Asian Breakout Indicator
KEENBASE SOFTWARE SOLUTIONS
KT Asian Breakout indicator scans and analyzes a critical part of the Asian session to generate bi-directional buy and sell signals with the direction of a price breakout. A buy signal occurs when the price breaks above the session high, and a sell signal occurs when the price breaks below the session low. MT5 Version is available here https://www.mql5.com/en/market/product/41704 Things to remember If the session box is vertically too wide, a new trade should be avoided as most of the price
MACD Divergence MT4
KEENBASE SOFTWARE SOLUTIONS
KT MACD Divergence shows the regular and hidden divergences build between the price and oscillator. If your trading strategy anticipates the trend reversal, you can include the MACD regular divergence to speculate the potential turning points. And if your trading strategy based on the trend continuation, MACD hidden divergence would be a good fit. Limitations of KT MACD Divergence Using the macd divergence as a standalone entry signal can be a risky affair. Every divergence can't be interpr
KT Bollinger Bands Trader MT4
KEENBASE SOFTWARE SOLUTIONS
KT Bollinger Bands Trader is a 100% automated expert advisor that's incorporated a mean reversion trading strategy using the Bollinger bands during the period of low volatility. Price often reacts at the upper or lower line of Bollinger bands, but a reversal not always occurs. However, there is more chance of price reversal during the time of low volatility. Entries A buy trade is activated when price correctly aligns below the bottom line of Bollinger bands. A sell trade is activated when pri
Filtro:
Nessuna recensione
Rispondi alla recensione