VR Grid Mt5
- Indicatori
- Vladimir Pastushak
- Versione: 24.40
- Aggiornato: 23 aprile 2024
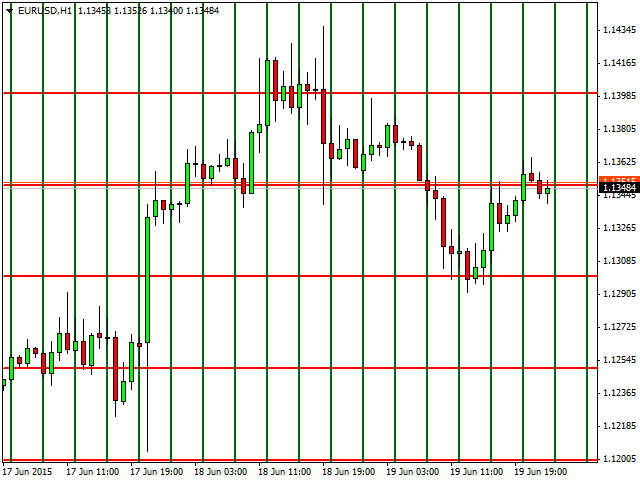
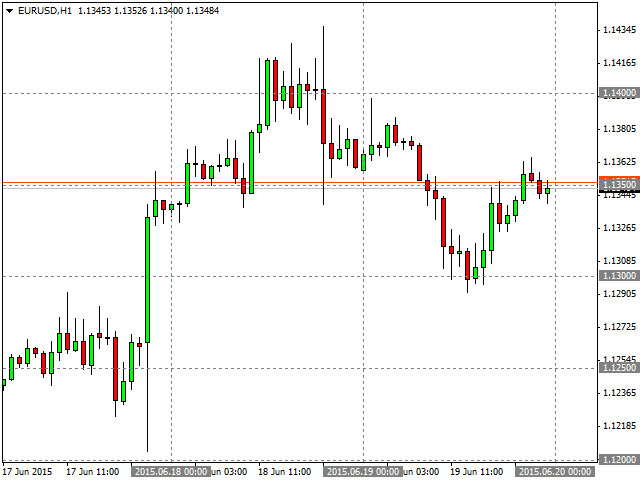
L'indicatore Griglia VR è progettato per creare una griglia grafica con impostazioni definite dall'utente. A differenza della griglia standard, VR Grid viene utilizzata per costruire livelli circolari. A seconda della scelta dell'utente, il passaggio tra i livelli rotondi può essere arbitrario. Inoltre, a differenza di altri indicatori e utilità, VR Grid mantiene la posizione della griglia anche quando cambia l'intervallo di tempo o si riavvia il terminale.
È possibile ottenere impostazioni, file di set, versioni demo, istruzioni e risoluzione dei problemi da [blog]
Puoi leggere o scrivere recensioni su [collegamento]
Versione per [MetaTrader 4]
I livelli verticali si basano su intervalli di tempo effettivi e ignorano periodi mancanti o inesistenti. Pertanto, il passaggio tra i livelli corrisponde strettamente al valore selezionato dall'utente.
Quando si utilizza l'indicatore VR Grid, un trader può modificare lo stile, il colore e lo spessore delle linee verticali e orizzontali a qualsiasi livello. Ciò ti consente di controllare i livelli rotondi di uno strumento finanziario.
I livelli arrotondati sono quei prezzi che terminano con due o più zeri (ad esempio: 1.23500, 5.65900, 1923.200). Si ritiene che tali livelli spesso agiscano come forti punti di supporto o resistenza.
- Horizontal line settings
- Horizontal line step
- Horizontal line color
- Horizontal line style
- Horizontal line Width
- Vertical line settings
- Vertical line period step
- Period for step calculation
- Vertical line color
- Vertical line style
- Vertical line Width
- Other settings
- Button size
- Prefix object


Нормально, давно нужен был!