• Panoramica
  • Recensioni
  • Commenti

Harmonic Patterns Osw MT5

MODELLI ARMONICI OSW MT5

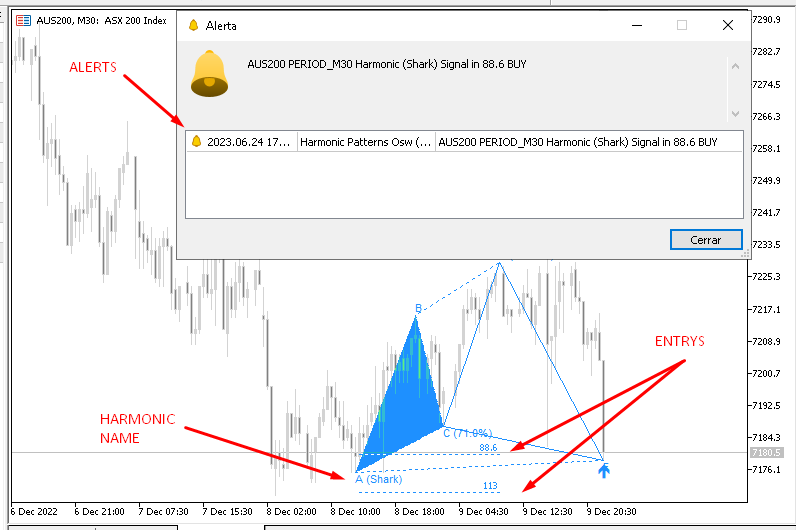
Questo indicatore ha il compito di rilevare gli schemi armonici in modo che tu possa operare su di essi, dandoti un segnale in modo che tu possa aggiungere un'analisi manuale se accetti o meno l'ordine.

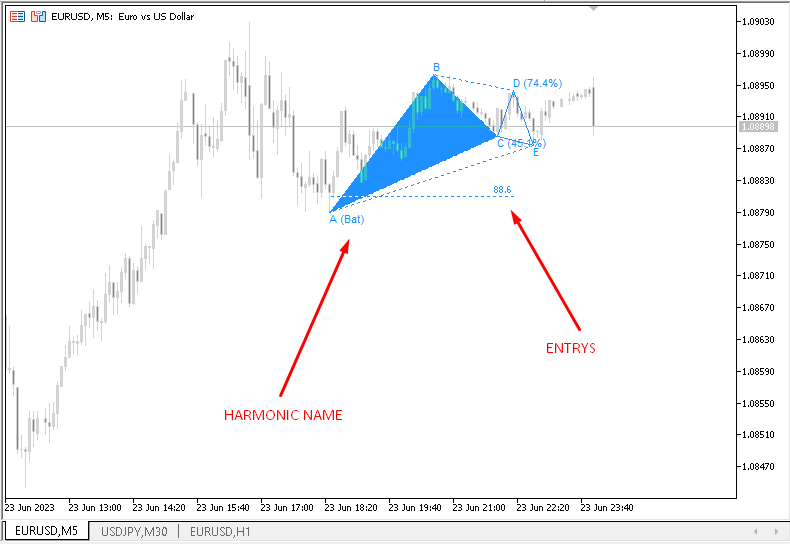
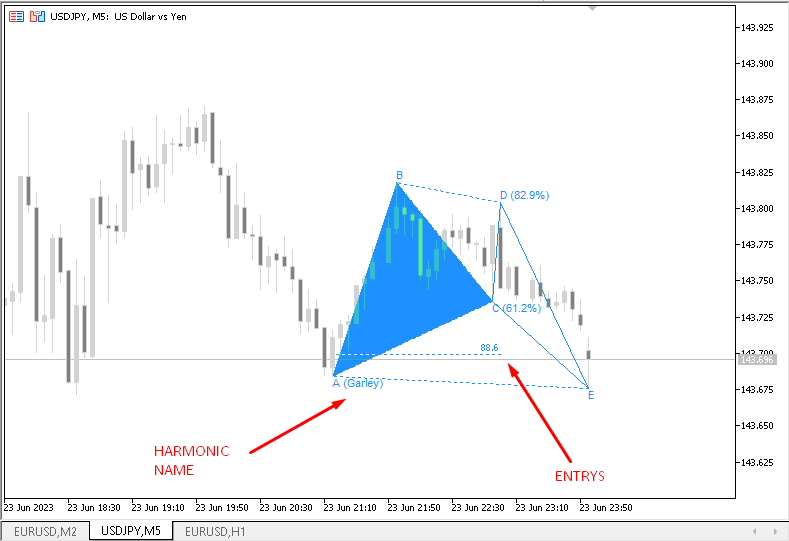
Tra i Pattern Armonici rilevati dall'indicatore vi sono:

>garley

> pipistrello

> Farfalla

> granchio

> Squalo

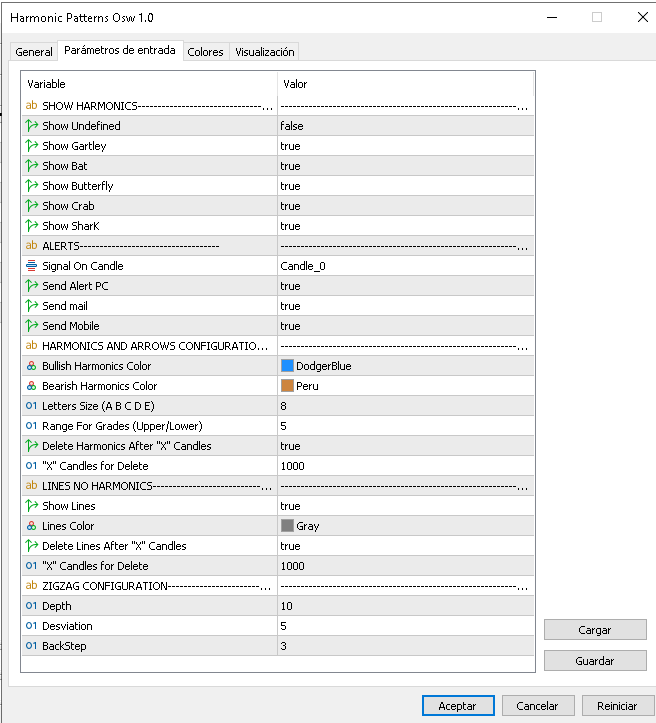
Tra le funzioni che puoi trovare ci sono:

> Genera avvisi per posta, cellulare e PC

>Cambiare i colori delle Armoniche, sia acquistando che vendendo.

>Determinare i "Gradi Consentiti", cioè se l'Armonica deve toccare 38.2, ed i "Gradi Consentiti" sono 5, permetterà al prezzo di essere compreso tra 33.2 e 43.2, questo perchè i prezzi non toccano esattamente 38.2.

>Cancellare le Armoniche dopo le 1000 candele configurabili, questo per evitare di caricare il grafico con vecchi oggetti grafici.

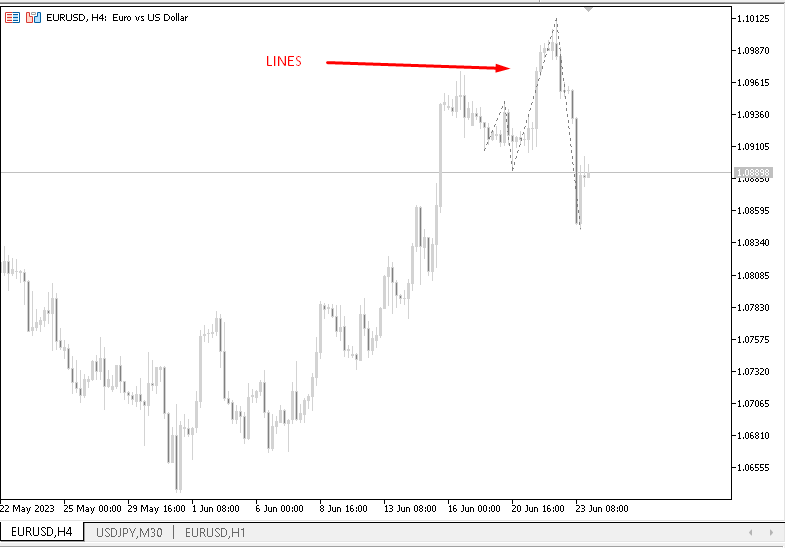
>Mostra le linee o gli impulsi e le battute d'arresto che vengono analizzate per sapere come l'indicatore sta leggendo i movimenti.

>Configurazione Zigzag, che permette di misurare i movimenti dei prezzi e di ricercare Pattern Armonici.
Prodotti consigliati
Matreshka
Dimitr Trifonov
5 (1)
Matreshka self-testing and self-optimizing indicator: 1. Is an interpretation of the Elliott Wave Analysis Theory. 2. Based on the principle of the indicator type ZigZag, and the waves are based on the principle of interpretation of the theory of DeMark. 3. Filters waves in length and height. 4. Draws up to six levels of ZigZag at the same time, tracking waves of different orders. 5. Marks Pulsed and Recoil Waves. 6. Draws arrows to open positions 7. Draws three channels. 8. Notes support and re
Introduction to X3 Chart Pattern Scanner X3 Cherart Pattern Scanner is the non-repainting and non-lagging indicator detecting X3 chart patterns including Harmonic pattern, Elliott Wave pattern, X3 patterns, and Japanese Candlestick patterns. Historical patterns match with signal patterns. Hence, you can readily develop the solid trading strategy in your chart. More importantly, this superb pattern scanner can detect the optimal pattern of its kind. In addition, you can switch on and off individu
Introduction to Harmonic Volatility Indicator Harmonic Volatility Indicator is the first technical analysis applying the Fibonacci analysis to the financial volatility. Harmonic volatility indicator is another level of price action trading tool, which combines robust Fibonacci ratios (0.618, 0.382, etc.) with volatility. Originally, Harmonic Volatility Indicator was developed to overcome the limitation and the weakness of Gann’s Angle, also known as Gann’s Fan. We have demonstrated that Harmonic
Introduction Harmonic Patterns are best used to predict potential turning point. Traditionally, Harmonic Pattern was identified manually connecting peaks and troughs points in the chart. Manual harmonic pattern detection is painfully tedious and not suitable for everyone. You are often exposed under subjective pattern identification with manual pattern detection. To avoid these limitations, Harmonic Pattern Plus was designed to automate your harmonic pattern detection process. The functionality
FibExtender
Syed Oarasul Islam
This Indicator draws Fibonacci Extension levels in two different ways. You can select whether to draw Fibonacci Extension levels based on your favourite ZigZag settings or you can let the indicator to draw Fibonacci Extension  level based on given number of Bars or Candles.  You can also set Mobile and Email notification for your favourite Extension  levels individually. With this indicator you will not have to feel lonely as the it can generate Voice alerts, which will keep you focused on your
Gartley Projections D
Oleksandr Medviediev
3 (2)
The indicator identifies the harmonic patterns (XABCD) according to developments of H.M.Gartley ( "Profits in the Stock Market" , 1935г). It projects D-point as a point in the perspective projection (specify ProjectionD_Mode = true in the settings). Does not redraw. When a bar of the working timeframe closes, if the identified pattern point has not moved during Patterns_Fractal_Bars bars, an arrow appears on the chart (in the direction of the expected price movement). From this moment on, the ar
ArcTracer
Syed Oarasul Islam
This Indicator draws Fibonacci Arc levels in two different ways. You can select whether to draw Fibonacci Arc levels based on your favourite ZigZag settings or you can let the indicator to draw Arc levels based on given number of bars or candles.  You can also set Mobile and Email notification for your favourite Arc levels individually. With this indicator you will not have to feel lonely as the it can generate Voice alerts, which will keep you focused on your trading and remove boredom.  Produc
Elliott Wave Trend was designed for the scientific wave counting. This tool focuses to get rid of the vagueness of the classic Elliott Wave Counting using the guideline from the template and pattern approach. In doing so, firstly Elliott Wave Trend offers the template for your wave counting. Secondly, it offers Wave Structural Score to assist to identify accurate wave formation. It offers both impulse wave Structural Score and corrective wave Structure Score. Structural Score is the rating to sh
This indicator finds wedges , which are continuation patterns identified by converging trendlines surrounding a price consolidation period. It signals trades using a donchian breakout alongside the formation breakout. [ Installation Guide | Update Guide | Troubleshooting | FAQ | All Products ] Easy to use Customizable colors and sizes It implements breakout signals It implements alerts of all kinds Optimal Usage To see wedges of all sizes, which can overlap, load the indicator several times on
The indicator for trading on the signals of the harmonic pattern AB=CD. It gives signals and shows the levels of entry into the market, as well as levels for placing stop orders, which allows the trader to make timely decisions on entering the market, as well as effectively manage positions and orders. It supports sending push notifications to a mobile device, e-mail, as well as alerts. This indicator has been ported from the version for MetaTrader 4. For more information, as well as a detailed
This indicator contains Pivot Levels of: Traditional Fibonacci Woodie Classic Demark Camarilla  Calculation periods can be set to auto / Daily / Weekly / Monthly / Yearly.  Number of Levels are editable.  Options to hide level labels and price labels.  Pivots Points are price levels chartists can use to determine intraday support and resistance levels. Pivot Points use the previous days Open, High, and Low to calculate a Pivot Point for the current day. Using this Pivot Point as the base, three
Auto Fib Retracements
Ross Adam Langlands Nelson
4.33 (6)
Automatic Fibonacci Retracement Line Indicator. This indicator takes the current trend and if possible draws Fibonacci retracement lines from the swing until the current price. The Fibonacci levels used are: 0%, 23.6%, 38.2%, 50%, 61.8%, 76.4%, 100%. This indicator works for all charts over all timeframes. The Fibonacci levels are also recorded in buffers for use by other trading bots. Any comments, concerns or additional feature requirements are welcome and will be addressed promptly. 
FREE
The 123 Pattern is one of the most popular, powerful and flexible chart patterns. The pattern is made up of three price points: a bottom, a peak or valley, and a Fibonacci retracement between 38.2% and 71.8%. A pattern is considered valid when the price breaks beyond the last peak or valley, moment at which the indicator plots an arrow, rises an alert, and the trade can be placed. [ Installation Guide | Update Guide | Troubleshooting | FAQ | All Products ] Clear trading signals Customizable c
M & W Pattern Pro is an advanced scanner for M and W patters , it uses extra filters to ensure scanned patterns are profitable. The indicator can be used with all symbols and time frames. The indicator is a non repaint indicator with accurate statistics calculations. To use , simply scan the most profitable pair using the statistics dashboard accuracy , then enter trades on signal arrow and exit at the TP and SL levels. STATISTICS : Accuracy 1 : This is the percentage of the times price hit
EchoIndicatorMT5
Phongkrit Phattanawijak
ECHO INDICATOR V2.2 Update A top-quality indicator works with trend and pattern.  The tool is a good assistant for the traders use various levels in trading. When price approaches a level, the indicator produces a sound alert and (or) notifies in a pop-up message, or via push notifications. A great decision making tool for opening orders. Can be used any timeframe and can be customized Easy to trade It implements alerts of all kinds It implements a multi-timeframe   Trade with Trend  + s
Peaks and Troughs MT5
Pavel Verveyko
5 (1)
The indicator detects important peaks and troughs (extremes) on the chart. These points can be used to plot support/resistance levels and trend lines, as well as any other graphical analysis. These points can serve as reference points for setting trading orders. The indicator does not redraw . Settings: Size_History  - the size of the calculated history. Num_Candles_Right  - number of candles to the right of the peak or trough. Num_Candles_Left  - number of candles to the left of the pea
This is the Full Version, to get the free version please contact me. The free version works on “GBPCHF” charts. All symbols and time frames scanner. Harmonic Pattern Harmonic patterns are used in technical analysis that traders use to find trend reversals. They are considered one of the most accurate technical analysis tools, as they allow traders to predict the future price movement direction and the potential trend targets. Also, unlike many other technical tools, the number of false signal
Introduction to Chart Pattern MT Chart Pattern MT is a chart pattern scanner to detect the triangle pattern, falling wedge pattern, rising wedge pattern, channel pattern and so on. Chart Pattern MT uses highly sophisticated chart pattern detection algorithm. However, we have designed it in the easy to use with intuitive user interface. Chart Pattern MT will show all the patterns in your chart in the most efficient format for your trading. You do not have to do tedious manual pattern detection an
FanTracer
Syed Oarasul Islam
This Indicator draws Fibonacci Fan levels in two different ways. You can select whether to draw Fibonacci Fan levels based on your favourite ZigZag settings or you can let the indicator to draw Fan levels based on given number of bars or candles.  You can also set Mobile and Email notification for your favourite Fan  levels individually. With this indicator you will not have to feel lonely as the it can generate Voice alerts, which will keep you focused on your trading and remove boredom.  Prod
Mean Reversion Supply Demand Indicator Mean Reversion Supply Demand is the indicator to detect the important supply demand zone in your chart. The concept of supply demand trading relies on the quantity mismatching between buying and selling volumes in the financial market. Typically, supply demand zone serves to predict the turning point. The wave pattern, for any supply demand zone to work as an successful trade, looks like the price must touch the base zone, move away and then return to zone
This indicator finds pennants , which are continuation patterns identified by converging trendlines surrounding a price consolidation period. Trades are signaled using a breakout period alongside the formation breakout.  [ Installation Guide | Update Guide | Troubleshooting | FAQ | All Products ] Easy to use Customizable colors and sizes It implements breakout signals It implements alerts of all kinds Optimal Usage To see pennants of all sizes, which can overlap, load the indicator several tim
The   ICT Unicorn Model   indicator highlights the presence of "unicorn" patterns on the user's chart which is derived from the lectures of   "The Inner Circle Trader" (ICT) . Detected patterns are followed by targets with a distance controlled by the user.   USAGE (image 2) At its core, the ICT Unicorn Model relies on two popular concepts, Fair Value Gaps and Breaker Blocks. This combination highlights a future area of support/resistance. A   Bullish Unicorn Pattern   consists ou
Introduction This indicator detects volume spread patterns for buy and sell opportunity. The patterns include demand and supply patterns. You might use each pattern for trading. However, these patterns are best used to detect the demand zone (=accumulation area) and supply zone (=distribution area). Demand pattern indicates generally potential buying opportunity. Supply pattern indicates generally potential selling opportunity. These are the underlying patterns rather than direct price action. T
FREE
This is a well-known ZigZag indicator. But it differs by the fact that its plot is based on values of the middle line which is set by a user. It can display Andrews’ Pitchfork and standard or Bobokus Fibo levels. NO REPAINTING. Parameters Period МА — middle line period. Default value is 34. Minimum value is 4. Maximum value is set at your discretion. Used to calculate price — type of price used for the midline calculations. The averaging method — type of smoothing for the middle line. Turning
Price Breakout pattern Scanner is the automatic scanner for traders and investors. It can detect following patterns automatically from your chart. Head and Shoulder - Common tradable pattern. Reverse Head and Shoulder - This pattern is the reverse formation of the Head and Shoulder. Double Top - When the price hits resistance level twice and decline toward the support level, the trader can anticipate sudden bearish breakout through the support level. Double Bottom - The double bottom pattern is
All Harmonics 26 demo
Alexey Isavnin
4.22 (9)
This is the demo version of "All Harmonics 26" indicator . "All Harmonics 26" searches for 26 types of harmonic patterns and outputs them in a convenient way. You can check out the documentation here . This demo version has the following limitations: The indicator searches only for one type of harmonic patterns out of 26:- Gartley. The indicator outputs new patterns with a lag of 10 bars.
FREE
Fibonacci and RSI Demo version MQL5
Carlos Daniel Vazquez Rosas
4 (1)
Fibonacci and RSI. Demo versión only works with GBPUSD. For full version, please, visit visit https://www.mql5.com/en/market/product/52101 The indicator is a combination of the Fibonacci and RSI indicators. Every time the price touches one of the fibonacci levels and the rsi condition is met, an audible alert and a text alert are generated. Parameters number_of_candles : It is the number of candles that will be calculated. If you put 100, the indicator will give you the maximum and min
FREE
"Hunttern harmonic pattern finder" base on the dynamic zigzag with the notification and prediction mode This version of the indicator identifies 11 harmonic patterns and predicts them in real-time before they are completely formed. It offers the ability to calculate the error rate of Zigzag patterns depending on a risk threshold. It moreover sends out a notification once the pattern is complete. The supported patterns: ABCD BAT ALT BAT BUTTERFLY GARTLEY CRAB DEEP CRAB CYPHER SHARK THREE
FREE
The new update makes this indicator a complete tool for studying, analyzing and operating probabilistic patterns. It includes: On-chart Multi-asset percentage monitor. Configurable martingales. Twenty-one pre-configured patterns, including Mhi patterns and C3. An advanced pattern editor to store up to 5 custom patterns. Backtest mode to test results with loss reports. Trend filter. Hit operational filter. Martingale Cycles option. Various types of strategies and alerts. Confluence between patter
Gli utenti di questo prodotto hanno anche acquistato
Atomic Analyst MT5
Issam Kassas
5 (13)
Innanzitutto, vale la pena sottolineare che questo indicatore di trading non è repaint, non è ridisegno e non presenta ritardi, il che lo rende ideale sia per il trading manuale che per quello automatico. Manuale utente: impostazioni, input e strategia. L'Analista Atomico è un indicatore di azione del prezzo PA che utilizza la forza e il momentum del prezzo per trovare un miglior vantaggio sul mercato. Dotato di filtri avanzati che aiutano a rimuovere rumori e segnali falsi, e aumentare il pote
Innanzitutto è importante sottolineare che questo sistema di trading è un indicatore Non-Repainting, Non-Redrawing e Non-Lagging, il che lo rende ideale sia per il trading manuale che per quello automatico. Corso online, manuale e download di preset. Il "Sistema di Trading Smart Trend MT5" è una soluzione completa pensata sia per i trader principianti che per quelli esperti. Combina oltre 10 indicatori premium e offre più di 7 robuste strategie di trading, rendendolo una scelta versatile per div
Quantum Trend Sniper
Bogdan Ion Puscasu
5 (39)
Presentazione       Quantum Trend Sniper Indicator   , l'innovativo indicatore MQL5 che sta trasformando il modo in cui identifichi e scambi le inversioni di tendenza! Sviluppato da un team di trader esperti con un'esperienza di trading di oltre 13 anni,       Indicatore Quantum Trend Sniper       è progettato per spingere il tuo viaggio di trading verso nuove vette con il suo modo innovativo di identificare le inversioni di tendenza con una precisione estremamente elevata. *** Acquista Quant
A key element in trading is zones or levels from which decisions to buy or sell a trading instrument are made. Despite attempts by major players to conceal their presence in the market, they inevitably leave traces. Our task was to learn how to identify these traces and interpret them correctly. Reversal First Impulse levels (RFI)   -  Version MT4                  INSTRUCTIONS                 RUS                 ENG                         R ecommended to use with an indicator   -  TREND PRO  
FX Volume MT5
Daniel Stein
4.94 (17)
Ricevi il tuo aggiornamento quotidiano sul mercato con dettagli e schermate tramite il nostro Morning Briefing qui su mql5 e su Telegram ! FX Volume è il PRIMO e UNICO indicatore di volume che fornisce una visione REALE del sentiment del mercato dal punto di vista del broker. Fornisce informazioni straordinarie su come gli operatori di mercato istituzionali, come i broker, sono posizionati sul mercato Forex, molto più velocemente dei rapporti COT. Vedere queste informazioni direttamente sul vo
Presentazione       Quantum Breakout PRO   , l'innovativo indicatore MQL5 che sta trasformando il modo in cui scambi le zone di breakout! Sviluppato da un team di trader esperti con un'esperienza di trading di oltre 13 anni,       Quantum Breakout PRO       è progettato per spingere il tuo viaggio di trading a nuovi livelli con la sua strategia innovativa e dinamica della zona di breakout. Quantum Breakout Indicator ti fornirà frecce di segnalazione sulle zone di breakout con 5 zone target
TPSproTREND PrO MT5
Roman Podpora
5 (7)
TPSpro TRENDPRO  - is a trend indicator that automatically analyzes the market and provides information about the trend and each of its changes, as well as giving signals for entering trades without redrawing! The indicator uses each candle, analyzing them separately. referring to different impulses - up or down impulse. Exact entry points into transactions for currencies, crypto, metals, stocks, indices!  -  Version MT4                  DETAILED DESCRIPTION        /       TRADING SETUPS       
Trend Screener Pro MT5
STE S.S.COMPANY
4.87 (62)
Indicatore di tendenza, soluzione unica rivoluzionaria per il trading di tendenze e il filtraggio con tutte le importanti funzionalità di tendenza integrate in un unico strumento! È un indicatore multi-timeframe e multi-valuta al 100% non ridipingibile che può essere utilizzato su tutti i simboli/strumenti: forex, materie prime, criptovalute, indici e azioni. Trend Screener è un indicatore di tendenza che segue un indicatore efficiente che fornisce segnali di tendenza a freccia con punti nel gra
RelicusRoad Pro MT5
Relicus LLC
4.82 (22)
Ora $ 147 (aumentando a $ 499 dopo alcuni aggiornamenti) - account illimitati (PC o MAC) Manuale utente di RelicusRoad + Video di formazione + Accesso al gruppo Discord privato + Stato VIP UN NUOVO MODO DI GUARDARE IL MERCATO RelicusRoad è l'indicatore di trading più potente al mondo per forex, futures, criptovalute, azioni e indici, fornendo ai trader tutte le informazioni e gli strumenti di cui hanno bisogno per rimanere redditizi. Forniamo analisi tecniche e piani di trading per aiutar
74% discount for the next 10 buyers (original price $605): 1 left Get a 50% bonus by buying (or even renting) any of our products. After buying (or renting), send a message for more information. 3 Indicators in 1 indicator Strategy based on price action Made specifically for the best forex currency pairs Can be used in the best time frame of the market at a very reasonable price This indicator is basically 3 different indicatos . But we have combined these 3 indicators in 1 indicator so th
FX Power MT5 NG
Daniel Stein
5 (5)
Ricevi il tuo aggiornamento quotidiano sul mercato con dettagli e schermate tramite il nostro Morning Briefing qui su mql5 e su Telegram ! FX Power MT5 NG è la nuova generazione del nostro popolare misuratore di forza delle valute, FX Power. Cosa offre questo misuratore di forza di nuova generazione? Tutto ciò che avete amato dell'FX Power originale IN PIÙ Analisi della forza di ORO/XAU Risultati di calcolo ancora più precisi Periodi di analisi configurabili individualmente Limite di calcolo pe
Top indicator for MT5   providing accurate signals to enter a trade without repainting! It can be applied to any financial assets:   forex, cryptocurrencies, metals, stocks, indices .  Watch  the video  (6:22) with an example of processing only one signal that paid off the indicator! MT4 version is here It will provide pretty accurate trading signals and tell you when it's best to open a trade and close it. Most traders improve their trading results during the first trading week with the help of
Gartley Hunter Multi
Siarhei Vashchylka
5 (7)
Gartley Hunter Multi - An indicator for searching for harmonic patterns simultaneously on dozens of trading instruments and on all classic timeframes: (m1, m5, m15, m30, H1, H4, D1, Wk, Mn). Manual (Be sure to read before purchasing) | Version for MT4 Advantages 1. Patterns: Gartley, Butterfly, Shark, Crab. Bat, Alternate Bat, Deep Crab, Cypher 2. Simultaneous search for patterns on dozens of trading instruments and on all classic timeframes 3. Search for patterns of all possible sizes. Fr
Professional Scalping Tool on Deriv Attention! The indicator will be sold in limited quantities!!! The previous 5 copies were sold for $250 The remaining 4 copies will be sold for $350 The next price is $500 Description: This trading indicator is designed for professional traders focused on scalping. Designed with the market in mind, it provides highly accurate spike trading signals. It works on the M1 timeframe and supports the following symbols: Boom 300 Index, Boom 500 Index, Boom 1000 I
Blahtech Supply Demand MT5
Blahtech Limited
4.57 (14)
Was: $299  Now: $99   Supply Demand uses previous price action to identify potential imbalances between buyers and sellers. The key is to identify the better odds zones, not just the untouched ones. Blahtech Supply Demand indicator delivers functionality previously unavailable on any trading platform. This 4-in-1 indicator not only highlights the higher probability zones using a multi-criteria strength engine, but also combines it with multi-timeframe trend analysis, previously confirmed swings
XQ Indicator MetaTrader 5
Marzena Maria Szmit
5 (1)
Step into the realm of Forex trading with confidence and precision using XQ, a cutting-edge Forex indicator designed to elevate your trading game to unprecedented heights. Whether you're a seasoned trader or just stepping into the world of currency exchange, XQ Forex Indicator empowers you with the insights and signals needed to make informed trading decisions. The signal conditions are a combination of three indicators, and XQ Forex Indicator only display  medium and long-term trends . The ind
Was: $249  Now: $99   Market Profile defines a number of day types that can help the trader to determine market behaviour. A key feature is the Value Area, representing the range of price action where 70% of trading took place. Understanding the Value Area can give traders valuable insight into market direction and establish the higher odds trade. It is an excellent addition to any system you may be using. Inspired by Jim Dalton’s book “Mind Over Markets”, this indicator is designed to suit the
Advanced Supply Demand MT5
Bernhard Schweigert
4.53 (15)
La migliore soluzione per qualsiasi principiante o trader esperto! Questo indicatore è uno strumento di trading unico, di alta qualità e conveniente perché abbiamo incorporato una serie di funzionalità proprietarie e una nuova formula. Con questo aggiornamento, sarai in grado di mostrare fusi orari doppi. Non solo potrai mostrare una TF più alta, ma anche entrambe, la TF del grafico, PIÙ la TF più alta: SHOWING NESTED ZONES. Tutti i trader di domanda di offerta lo adoreranno. :) Informazioni imp
Introducing the South African Sniper indicator created by a small group of traders with a few years trading trading the financial market profitably . This is a plug and play indicator that provides you with  BUY and SELL (SNIPER ENTRY) signals with TARGET and trail stops. The indicator Works with all MT5 trading instruments. The indicator uses previous  chart data as receipt to speculate on future market moves.
FxaccurateLS
Shiv Raj Kumawat
WHY IS OUR FXACCCURATE LS MT5 THE PROFITABLE ? PROTECT YOUR CAPITAL WITH RISK MANAGEMENT Gives entry, stop and target levels from time to time. It finds Trading opportunities by analyzing what the price is doing during established trends. POWERFUL INDICATOR FOR A RELIABLE STRATEGIES We have made these indicators with a lot of years of hard work. It is made at a very advanced level. Established trends provide dozens of trading opportunities, but most trend indicators completely ignore them!
Volume by Price MT5
Brian Collard
5 (3)
The Volume by Price Indicator for MetaTrader 5 features Volume Profile and Market Profile TPO (Time Price Opportunity). Get valuable insights out of currencies, equities and commodities data. Gain an edge trading financial markets. Volume and TPO histogram bar and line charts. Volume Footprint charts. TPO letter and block marker charts including split structures. Versatile segmentation and compositing methods. Static, dynamic and flexible ranges with relative and/or absolute visualizations. Lay
Wolfe Waves are naturally occurring trading patterns present in all financial markets and represent a fight towards an equilibrium price. These patterns can develop over short and long-term time frames and are one of the most reliable predictive reversal patterns in existence, normally preceding strong and long price movements. [ Installation Guide | Update Guide | Troubleshooting | FAQ | All Products ] Clear trading signals Amazingly easy to trade Customizable colors and sizes Implements perfo
Quantum Heiken Ashi PRO MT5
Bogdan Ion Puscasu
4.5 (8)
Ti presentiamo   Quantum Heiken Ashi PRO Progettate per fornire informazioni chiare sulle tendenze del mercato, le candele Heiken Ashi sono rinomate per la loro capacità di filtrare il rumore ed eliminare i falsi segnali. Dì addio alle confuse fluttuazioni dei prezzi e dai il benvenuto a una rappresentazione grafica più fluida e affidabile. Ciò che rende il Quantum Heiken Ashi PRO davvero unico è la sua formula innovativa, che trasforma i dati tradizionali delle candele in barre colorate di faci
MetaForecast M5
Vahidreza Heidar Gholami
5 (2)
MetaForecast predice e visualizza il futuro di qualsiasi mercato basandosi sull'armonia dei dati dei prezzi. Sebbene il mercato non sia sempre prevedibile, se esiste un modello nei prezzi, MetaForecast può prevedere il futuro con la massima precisione possibile. Rispetto ad altri prodotti simili, MetaForecast può generare risultati più accurati analizzando le tendenze di mercato. Parametri di input Past size (Dimensione passata) Specifica il numero di barre che MetaForecast utilizza per creare
Golden Gate Algo MT5
James David Lane
4 (6)
40% DI SCONTO PER NATALE! AUMENTO DEL PREZZO A $250 IL 1 GENNAIO! Presentiamo GoldenGate Entries: una soluzione di trading all'avanguardia! Scopri un approccio rivoluzionario al trading con GoldenGate Entries (GGE), un indicatore avanzato progettato per migliorare la tua esperienza di trading. GGE offre un set completo di funzionalità per fornire agli utenti precisione e fiducia nelle loro decisioni di trading. Coppie: Qualsiasi (FX - Materie prime - Azioni - Azioni - Cripto) TimeFrame
TrendMaestro5
Stefano Frisetti
nota: questo indicatore e' per METATRADER5, se vuoi la versione per  METATRADER4 questo e' il link:   https://www.mql5.com/it/market/product/108106 TRENDMAESTRO ver 2.4 TRENDMAESTRO   riconosce un nuovo TREND sul nascere, non sbaglia mai. La sicurezza di identificare un nuovo TREND non ha prezzo. DESCRIZIONE TRENDMAESTRO identifica un nuovo TREND sul nascere, questo indicatore prende in esame la volatilita' i volumi ed il momentum per identificare il momento in cui c'e' un'esplosione di uno
This is arguably the most complete harmonic price formation auto-recognition indicator you can find for the MetaTrader Platform. It detects 19 different patterns, takes fibonacci projections as seriously as you do, displays the Potential Reversal Zone (PRZ) and finds suitable stop-loss and take-profit levels. [ Installation Guide | Update Guide | Troubleshooting | FAQ | All Products ] It detects 19 different harmonic price formations It plots primary, derived and complementary Fibonacci p
The TimeCycleCaptor indicator is an innovative tool for accurately visualizing the market trend and generating buy and sell signals. The market trend plays a key role in making trading decisions, and our indicator provides a reliable tool for determining it. We have made traders' dream of non-lagging moving averages come true in our indicator. TimeCycleCaptor is capable of predicting future values ​​and is designed to both identify the underlying trend and identify short-term buy or sell si
Trend Forecaster
Alexey Minkov
5 (3)
The Trend Forecaster indicator utilizes a unique proprietary algorithm to determine entry points for a breakout trading strategy. The indicator identifies price clusters, analyzes price movement near levels, and provides a signal when the price breaks through a level. The Trend Forecaster indicator is suitable for all financial assets, including currencies (Forex), metals, stocks, indices, and cryptocurrencies. You can also adjust the indicator to work on any time frames, although it is recommen
TPA True Price Action indicator reveals the true price action of the market makers through 100% non-repainting signals strictly at the close of a candle! TPA shows entries and re-entries, every time the bulls are definitely stronger than the bears and vice versa. Not to confuse with red/green candles. The shift of power gets confirmed at the earliest stage and is ONE exit strategy of several. There are available now two free parts of the TPA User Guide for our customers. The first "The Basics"
Altri dall’autore
RSI Alarm Osw
William Oswaldo Mayorga Urduy
RSI ALARM (For Metatrader 5) This indicator works like a normal RSI with all its settings (Periodicity, colors, levels, etc), but additionally, alarms can be set at the upper and lower level (Example 70 and 30), with the possibility of adjusting these levels by moving the blue and red lines to establish the upper and lower levels. You can also turn on and off an additional function that creates an arrow on the chart when the expected upper or lower RSI is met.
GAPS Indicator MT5
William Oswaldo Mayorga Urduy
Indicatore GAPS Metatrader 5 Per alcune delle strategie utilizzate in indici, azioni e altri asset, il GAP di ogni candelabro viene solitamente misurato, ma se vogliamo farlo manualmente, questo può portarci a commettere errori di calcolo. Per questo motivo è stato creato "GAP Indicator", che mostra automaticamente il valore PIPS di ciascuno dei GAPS presentati tra ciascuna delle candele e genera un allarme quando compaiono, se l'opzione è attivata.
RSI Alarm Osw MT4
William Oswaldo Mayorga Urduy
RSI ALARM (For Metatrader 4) This indicator works like a normal RSI with all its settings (Periodicity, colors, levels, etc), but additionally, alarms can be set in the upper and lower level (Example 70 and 30), with the possibility of adjusting these levels by moving the upper and lower lines found on the indicator. You can also activate and deactivate an additional function that puts an arrow on the chart when the expected upper or lower RSI is met.
SORS Osw MT4
William Oswaldo Mayorga Urduy
THE SORS COMPLEXES (For Metatrader 4) This indicator is designed to draw the SORS lines on the graph, these are the modern way of calculating market points that it usually respects, they are comprised of supports and resistance, but unlike the classics, these are calculated from volatility endogenous and standard deviation, In the configuration you can change the color of each level linear and hide the ones that are not needed. A = Annual. M = Monthly. W = Weekly D = Daily.
Divergence Osw Metatrader 4
William Oswaldo Mayorga Urduy
DIVERGENCE OSW  (For Metatrader 4) This indicator works on divergences and has the following functions: Generate an alert when a divergence occurs. Create lines by calculating the Stoploss and Takeprofit according to projection waves of inverse waves. Create an arrow indicating the possible direction of the market. The signals sent by the indicator are given when the candle ends. The Trader must evaluate each divergence to take entries. Settings: Activation and deactivation of alerts. Alert inte
Trading Sesions MT4
William Oswaldo Mayorga Urduy
COMMERCIAL SESSIONS This indicator shows in the selected graph divided by tables each of the sessions ASIA, JAPAN, LONDON, NEW YORK: Allows you to configure: Session Color  ASIA, JAPON, LONDRES, NEW YORK Hide and show each session It works in the lowest timeframes on the market, among which H4, H1, M15, M5 and M1 are recommended. (Don't forget to check out our other indicators)
Automatic Support and Resistance Osw MT4 This Indicator graphs lines at the possible support and resistance points of the selected asset. it works in multiple temporalities. allows you to configure: Color of the lines. Width of the lines. Type of lines. When the indicator begins its operation, it analyzes the supports and resistances of higher levels for the temporality in which it is working.
Round Numbers Osw MT4
William Oswaldo Mayorga Urduy
ROUND NUMBERS (For Metatrader 4) This indicator allows you to add horizontal lines according to the round numbers that the asset contains. Unlike other indicators, this one calculates the closest levels dynamically and automatically as the price moves. works on currency pairs, indices, metals, stocks, etc. Round with 5 digits, 3 digits and integers of 10 100 or 1000. lines can be adjusted in parameters like: Hide the line or round number that you do not want to display. line col
SUPPORT LINES AND RESISTORS + COMMAND BLOCKS for METATRADER 4 A much more pleasant visual way to locate supports and resistance, unlike normal horizontal lines, these can be located from a specific point, without extending backwards, making the graph not look good, it also shows the name of the temporality in which it was created so that when you are operating, you can know to which temporality it belongs. You can also create order blocks in a comfortable and visual way, where you can also
Whatch and Candle Alarm Osw MT4
William Oswaldo Mayorga Urduy
Osw Watch for METATRADER 4 This is an indicator that shows the remaining time for the current candle to expire on a watch, this is always located next to the last candle following the price, the numbers are shown the same as in the images, and can be modified both in size and color. between your settings you can set: the size of the numbers showing the time. the color of the numbers showing the time. Also within the configuration you can activate and deactivate so that an alarm sounds
Alert Up Down MT4
William Oswaldo Mayorga Urduy
ALERT UP - DOWN FOR METATRADER 5 This indicator generates an alert when the price leaves the zone between the UP and DOWN lines. You can generate alerts of various types such as: > Sound > Message box > Message in the expert box > Mail (previously configured) > PUSH notifications (previously configured) The lines must be configured from the indicator properties and not from the lines properties, since if it is done from the lines properties, the finonacci may be affected.
Break Out Signal Osw
William Oswaldo Mayorga Urduy
BREAK OUT SEGNALE OSW (METATRADER 4) Vuoi lavorare rompendo alti e bassi? questo è l'indicatore perfetto per prendere segnali da questo tipo di voci. Non appena l'indicatore si avvia, non ti mostrerà alcun segnale, ma man mano che il prezzo avanza, leggerà il mercato fino a trovare lo schema perfetto per scoppiare. L'indicatore per leggere i massimi e i minimi ha una configurazione speciale per lo Zig Zag, che permette di prendere solo quelli più adatti. Come ogni indicatore, non dà v
Automatic OrderBlocks Osw MT4
William Oswaldo Mayorga Urduy
ORDERBLOCK AUTOMATICI OSW (METATRADER 5) Questo indicatore ha il compito di mostrare i Blocchi di ordini secondo alcune regole prestabilite, tra cui: >che c'è un impulso che rompe l'impulso precedente. >Quando viene trovato, è incaricato di trovare il modello di candele formato, calcolare nel modo più efficiente il massimo e il minimo del luogo, per creare il massimo e il minimo del Blocco ordini. >Dopo la creazione del blocco ordini, l'indicatore controlla costantemente se un candela
SORS Osw
William Oswaldo Mayorga Urduy
THE SORS COMPLEXES This indicator is designed to draw the SORS lines on the graph, these are the modern way of calculating market points that it usually respects, they are comprised of supports and resistance, but unlike the classics, these are calculated from volatility endogenous and standard deviation, In the configuration you can change the color of each level linear and hide the ones that are not needed. A = Annual. M = Monthly. W = Weekly D = Daily.
Automatic Support and Resistance Osw MT5 This Indicator graphs lines at the possible support and resistance points of the selected asset. it works in multiple temporalities. allows you to configure: Color of the lines. Width of the lines. Type of lines. When the indicator begins its operation, it analyzes the supports and resistances of higher levels for the temporality in which it is working.
Round Number Osw MT5
William Oswaldo Mayorga Urduy
ROUND NUMBERS (For Metatrader 5) This indicator allows you to add horizontal lines according to the round numbers that the asset contains. Unlike other indicators, this one calculates the closest levels dynamically and automatically as the price moves. works on currency pairs, indices, metals, stocks, etc. Round with 5 digits, 3 digits and integers of 10 100 or 1000. lines can be adjusted in parameters like: Hide the line or round number that you do not want to display. line col
SUPPORT LINES AND RESISTORS + COMMAND BLOCKS for METATRADER 5 A much more pleasant visual way to locate supports and resistance, unlike normal horizontal lines, these can be located from a specific point, without extending backwards, making the graph not look good, it also shows the name of the temporality in which it was created so that when you are operating, you can know to which temporality it belongs. You can also create order blocks in a comfortable and visual way, where you can also
Multi Temporalities Osw MT5
William Oswaldo Mayorga Urduy
MULTI-TIMES FOR METATRADER 5 This indicator, in a lower window, shows the current chart in different timeframes, this can help you better decipher the market, taking into account the higher timeframes. Among the settings that you can modify are: view of prices in charts view of the temporalities in the graphs enable each of the graphics in the different temporalities (M1, M5, M15, H1, H4, D1, W1, MN1).
Whatch and Candle Alarm Osw MT5
William Oswaldo Mayorga Urduy
Osw Watch for METATRADER 5 This is an indicator that shows the remaining time for the current candle to expire on a watch, this is always located next to the last candle following the price, the numbers are shown the same as in the images, and can be modified both in size and color. between your settings you can set: the size of the numbers showing the time. the color of the numbers showing the time. Also within the configuration you can activate and deactivate so that an alarm sounds
Alert Up Down MT5
William Oswaldo Mayorga Urduy
ALERT UP - DOWN FOR METATRADER 5 This indicator generates an alert when the price leaves the zone between the UP and DOWN lines. You can generate alerts of various types such as: > Sound > Message box > Message in the expert box > Mail (previously configured) > PUSH notifications (previously configured) The lines must be configured from the indicator properties and not from the lines properties, since if it is done from the lines properties, the finonacci may be affected.
Master Calendar Osw
William Oswaldo Mayorga Urduy
CALENDARIO OSW MASTER Questo indicatore è stato inizialmente creato per mio uso personale, ma l'ho migliorato poco a poco e ho implementato funzioni per aiutare il mio trading quotidiano e le funzioni continueranno ad essere implementate se saranno utili. DETTAGLI DEL CALENDARIO. >Calendario mobile e dettagliato delle notizie vicine alla data corrente, con dati quali: data, Paese, Valuta, Settore della notizia, Nome della notizia e Precedente, previsione e Dati attuali. >Il calendario s
Volumes Direction MT5
William Oswaldo Mayorga Urduy
DIREZIONE VOLUMI MT5 Normalmente l'indicatore del volume ha un cambio di colore predefinito quando il volume corrente è più alto del precedente, è importante ma non molto utile. Per questo motivo è stato creato questo indicatore che oltre al volume normale, quando la candela è rialzista o ribassista, le dipinge di un colore diverso, di default è blu per rialzista e rosso per ribassista, ma questi colori possono essere personalizzati al Il gusto del commerciante. Non dimenticare di con
Trade Panel Osw MT5
William Oswaldo Mayorga Urduy
COMMERCIO PANNELLO OSW METATRADE 5 Questo pannello ti aiuterà a piazzare ordini a mercato, permettendoti di visualizzare il costo di ogni operazione, secondo la valuta stabilita nel conto. MANUALE DELLE FUNZIONI: 1) Selezionare uno STOPLOSS, con i pulsanti o per iscritto (si può attivare o disattivare l'opzione per metterlo). 2) Seleziona un TAKEPROFIT, con i pulsanti o per iscritto (Puoi attivare o disattivare l'opzione per metterlo). 3) Selezionare un VOLUME, con i pulsanti o per is
Signal Indicator to Expert MT5
William Oswaldo Mayorga Urduy
Hai un indicatore che dia segnali e vuoi convertirlo in Expert? Con questo esperto puoi convertirlo senza dover riprogrammare o adattare il tuo indicatore, devi solo seguire i passaggi per configurarlo correttamente: 1) L'indicatore deve trovarsi nella cartella degli indicatori. 2) Devi selezionare accuratamente i buffer ACQUISTA e VENDI forniti dall'indicatore. 3) Seleziona se vuoi intraprendere tutte le operazioni o solo quelle di tipo ACQUISTA o VENDI. 4) Seleziona come vuoi che le
Local Copy Trading Osw
William Oswaldo Mayorga Urduy
COPY TRADING LOCALE OSW Questo è uno strumento eccellente se vuoi copiare le negoziazioni da un conto all'altro. Per configurare l'esperto, è necessario seguire i seguenti passaggi: 1) Verificare che nel terminale SLAVE sia abilitato il trading automatico. 2) Verificare che l'EA disponga delle autorizzazioni di trading nel terminale SLAVE. 3) Aggiungere l'Expert a un grafico MASTER e configurarlo come MASTER. 4) Aggiungi l'esperto a un grafico SLAVE e configuralo come SLAVE (1,2,3,4
Microlots Deriv
William Oswaldo Mayorga Urduy
MICROLOT DERIV Questo pannello sostituisce il tradizionale Pannello, con il quale è possibile inserire micro lotti quando il broker non ne consente il collocamento, solo a condizione che il broker offra lo step di Volume inferiore al Volume Minimo. Per esempio: se il Volume Minimo è 0.20 e il passo è 0.01, e vuoi mettere 0.02, normalmente non potrai farlo, ma questo strumento si occuperà di gestire l'invio dell'ordine in modo che l'ordine aperto rimanga al valore di 0,02. Suggerimenti p
Heat Map OSW
William Oswaldo Mayorga Urduy
OSW MAPPA TESTA Questo indicatore è ideale per conoscere lo stato attuale di tutte le combinazioni di valute e per conoscerne la variazione. La variazione è calcolata dallo spostamento percentuale del prezzo dal prezzo corrente a 24 ore fa, o quanto configurato nel menu. Per conoscere la variazione di una valuta, devi semplicemente guardare la valuta principale, ad esempio: nell'EUR devi guardare verticalmente per confrontare con altre valute e alla fine trovi la media di tutti questi v
ESS Enguifing Strategy Signals
William Oswaldo Mayorga Urduy
ESS ENGUIFING SEGNALI DI STRATEGIA Questo indicatore rileva candele di tipo busta a cui è applicato un filtro, questo filtro è composto da 3 strategie insieme, con le quali è possibile identificare la massima efficacia possibile all'interno dei parametri misurabili. I segnali sono indicati da frecce verso l'alto e verso il basso per ciascuna delle direzioni e puoi anche attivare o disattivare avvisi, e-mail e messaggi push sul cellulare. Vale la pena ricordare che nessun indicatore è effi
MultiTimeFrame Moving Average Osw
William Oswaldo Mayorga Urduy
MULTI TIME FRAME MEDIA MOBILE OSW (METATRADER 5) Questo indicatore ti permetterà di aggiungere medie mobili di tutti i tipi di configurazione, con la differenza che se sei in un timeframe puoi aggiungere quella di livello superiore, per fare un esempio, se sei in un timeframe di 5 minuti e vuoi vedere l'esponenziale della media mobile di 20 della temporalità di 15 minuti, 1 ora e 4 ore, solo configurando i parametri corretti nel menu dell'indicatore potrai vederli come mostrato nelle immagi
Points Candles Osw
William Oswaldo Mayorga Urduy
PUNTI CANDELE OSW (METATRADER 5) Con questo indicatore puoi conoscere la dimensione in punti di ciascuna delle candele che vengono gestite nel grafico, fornendoti informazioni sulla dimensione e la direzione di ognuna, l'indicatore punterà verso l'alto se è rialzista e verso il basso se è ribassista . Inoltre puoi anche nascondere o mostrare tutte le candele, solo quelle rialziste o solo quelle ribassiste, questo è per i broker che gestiscono asset che danno candele più forti in una direzio
Filtro:
Nessuna recensione
Rispondi alla recensione