 MetaTrader 5
 Experts
 Indicatori
 librerie
 Utilità
 Widget
 Regole
Guarda i video tutorial del Market su YouTube
Come acquistare un Robot di Trading o un indicatore
Esegui il tuo EA
hosting virtuale
hosting virtuale
Prova un indicatore/robot di trading prima di acquistarlo
Vuoi guadagnare nel Market?
Come presentare un prodotto per venderlo con successo
Expert Advisors e Indicatori per MetaTrader 4 - 146
 I robot di trading eseguono le operazioni di mercato automaticamente, mentre gli indicatori permettono di analizzare al meglio le quotazioni e prevedere il comportamento dei prezzi. Con queste applicazioni, sarai in grado di eseguire operazioni in MetaTrader 4 in modo più consapevole, cogliendo più opportunità.
Control Trading Intraday Zones shows the best candles-zones to trade intraday. Shows maximum of the day and minimum of the day zones, adaptable to each symbol, gives you a guide to know the best zones to make the best intraday trades. Indicator goes from -100 (lowest of the day) to 100 (highest of the day), when 0 is middle price of the day. For example, when price reaches high of the day the indicador will continue showing max levels even the price continue rising, because indicator limits to 1
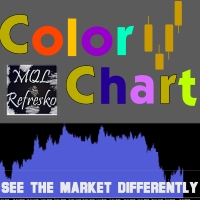
Visualize your charts differently in MetaTrader 5. The product is good for comparing the prices, since the indicator draws High, Close, HLC, etc. It is useful when applied with other indicators (like MACD). This simple indicator colors the entire space below the chart allowing you to see the market with greater clarity. You will see the actual price, trends, and the market behavior.
Indicator parameters: Applied_Price : From this option you can select the type of price you want to draw with th

The FastBoom EA finds the most probable points of price pullback/reverse and places an order. It places averaging orders if the price moves further against take profit.
Settings of the EA: Lots - initial lot; LotExponent - multiplier for following orders (Martingale). 1 - no multiplier. TakeProfit - take profit in points; Stochastic Settings
InpKPeriod - K Period of Stochastic InpDPeriod - D Period of Stochastic InpSlowing - Stochastic Slowing LevHigh - level for sell positions of Stochastic L

This strategy searches for trade opportunities based on what area the close price is, in comparison with Moving Average. In order to be triggered, a pattern between candles also must occur. The EA works well on trending markets. It has been initially developed for stock markets indices (SP500, NASDAQ, etc) on Daily chart entering long positions only. However, I refined the strategy in order to enter short positions as well. It does not use stop loss or take profit, so the losing trades outweigh
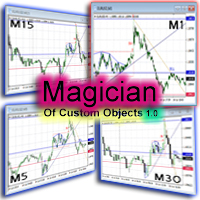
The ‘Magician of custom objects’ is a utility script tools for MetaTrader 4. After attaching the script to a chart, the custom objects in this chart are cloned to any other opened charts of the same symbol. Now, 11 custom object types are supported, including: Vertical line; Horizontal line; Trend line; Angle line; Gann line; Fibonacci line; Rectangle; Triangle; Arrow; Ellipse; Text. If you need other object types or have any question, write in the Comments section.
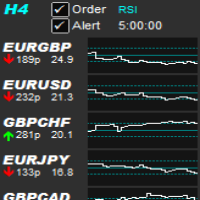
Allows symbols/currency pairs to be ordered based on a configured indicator, with the best performing symbols shown at the top. This helps you to select the symbol with better prospects from a given list of symbols. Can optionally alert when a symbol moves into the top two (configurable). Also shown is the number of pips that the symbol has moved in its current direction, allowing you to tell if you've 'missed the boat'. Further, a graph is shown, per symbol, of the indicator value over time all

This indicator allows you to see the strength of the trend on all timeframes. It can be used for all currency pairs. The indicator can be displayed in the form of a column (from left to right): status buy / sell / strong buy / strong sell, strength of the trend in percentage, pips last candle, body candle now, remaining time, and the timeframe of M1 to MN. Information contained below (from left to right): total trend percent, sell percent, buy percent.

This indicator builds so called "random walk" bands: on every bar it finds maximal or average distance between current price and multiple expanding parabolic curves starting at predefined number of bars in the past. If you like Bollinger bands or Envelopes you may find this indicator useful as well. As you may know, price movements are very similar to random walk time series (specifically, Gaussian random walk), yet they do effectively break the hypothesis of randomness. One of the features of t
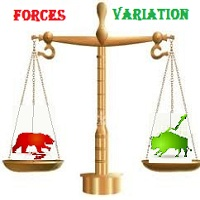
The most important thing in my system of forces, is the variation and changing of these forces. It is the key to the whole system, and from this point, my second indicator called FORCES-VARIATION appeares important. The indicator is represented in a separate window in the form of the green histogram and the red curve . The parameter NPIuPeriod represents the number of bars on which we calculate the variation of buyers forces. The parameter NPIdPeriod represents the number of bars on which we cal
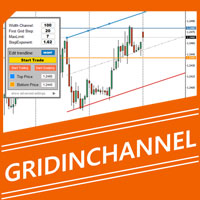
GridInChannel is a professional system of trading inside a channel using active visual control panel. The EA places a grid according to the specified parameters. It trades inside the channel which is manually plotted using a trend line. The main concept : while th price is inside the channel and the " start/stop trade " button is pressed, the EA opens an order grid in the direction of the specified channel.
Expert Advisor Features : Opening orders within the specified range . The range is set u

The EA catches the price when it moves against the trend in an effort to open an order in an opposite direction (direction of the main trend). Screenshots illustrate examples of entries and the strategy gist. The EA uses stop losses depending on values of ATR.
Settings: Lot_ - if Risk_ = 0, the EA will trade this lot; Risk_ - risk per one trade. Stop loss is taken into account; koeff_ATR - coefficient multiplied by the ATR value to calculate stop loss (the bigger the value, the bigger stop loss
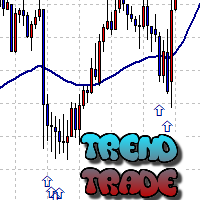
The Trend Trade indicator displays assumed turning points of the price on the chart in the direction of the trend after correction. It is based on data of the Prise Reversal oscillator with the period 6 and indicators which characterize strength and availability of the trend. When the value of Prise Reversal is in overbought or oversold area (area size is set by a user), and the current trend is confirmed, the Trend Trade indicator draws an arrow pointed to the further assumed price movement.
I
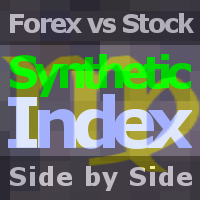
The indicator compares quotes of the current symbol and a synthetic quote calculated from two specified referential symbols. The indicator is useful for checking Forex symbol behavior via corresponding stock indices and detecting their convergence/divergence which can forecast future price movements. The main idea is that all stock indices are quoted in particular currencies and therefore demonstrate correlation with Forex pairs where these currencies are used. When market makers decide to "buy"

This is a professional multi currency tool. Its main purpose is semi-automatic Forex trading following Elder's Triple Screen strategy. Its wide functionality and ability to quickly change some essential parameters makes it an ideal market interpretation tool, which is indispensable in the common trade analysis. Its main advantage is almost unlimited number of simultaneously analyzed instruments. If the potential technical limits of your monitor resolution allow, multiple indicators can be used.

true Momentum - time-based Indicator it will inform about Momentum, a strong impulse in the appropriate direction it's based on a self-developed candle Pattern, in relation to the ATR (Average True Range)
Quick Start : the indicator is ready to use choose your personal times to trade try an indicator-preset or use an additional indicator, below the pro-settings
Filter Hours Weekdays Moving Averages Correlation Instruments - Moving Averages MACD RSI ADX PSAR Stochastic Bollinger Bands Keltner-

Advanced Bollinger Bands (BB) indicator. The standard Bands.mq4 indicator was complemented with a range of upper/lower band and signal of possible reverses.
Parameters: BandsPeriod - indicator period. BandsRange - period of determining a range. BandsDeviations - number of standard deviations. Averaging Fast Period - fast period of averaging. Averaging Slow Period - slow period of averaging.
Buffer indexes: 0 - Middle line, 1 - Upper line, 2 - Lower line, 3 - Upper range, 4 - Lower range, 5 -
This indicator creates more stable Aqua histogram, which crosses the zero line up and down indicating UP and DOWN trend for long and short positions. The indicator generates a pulse red signal, which crosses the zero line up and down more frequently than the histogram. You may use only the histogram for entering the market in the point where the histogram crosses the zero line. You may use only the red line for entering the market in the point where the red line crosses the zero line. You may us

This indicator signals about Stochastic crossing in the trend direction which is determined by the position of the price relative to the Ichimoku cloud.
Features: Flexible settings: filtering signals by bullish/bearish bars ( parameter "BUY - the bullish bar only; SELL - the bear bar only" ); setting levels of Stochastic crossing ( parameters "BUY-signal if Stochastic below this level" and "BUY-signal if Stochastic below this level" ) ability to use the Ichimoku cloud of higher timeframes ( par
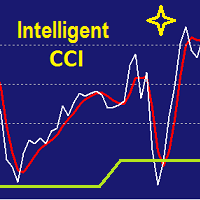
It is CCI indicator with very smooth and noiseless movement that calculates four levels of buy, sell, overbought and oversold dynamically. Professional traders know well that level of 100, 200 or -100 and -200 are not always right and need fine adjustments. This indicator calculates those levels dynamically by using mathematics and statistic methods in addition to shows divergence between indicator and price. Like original CCI, for best result you have better to set proper value for CCI period b

The indicator MilkyWay is calculating and draws a blue or red ribbon as a trend and as a filter. In case the price is moving inside the ribbon you should not enter the market. In case you see a blue trend and the current price is above the blue ribbon than this is a good time to go Long. In case you see a red trend and the current price is below the red ribbon than this is a good time to go Short. Only 1 input parameter: nBars = 500; - number of Bars where the ribbon will appears.

Introduction to Smart Renko The main characteristics of Renko Charting concern price movement. To give you some idea on its working principle, Renko chart is constructed by placing a brick over or below when the price make the movement beyond a predefined range, called brick height. Therefore, naturally one can see clear price movement with less noise than other charting type. Renko charting can provide much clearer trend direction and it helps to identify important support and resistance level
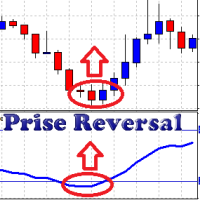
This oscillator takes into account the data from a number of standard indicators. Using this data, it forms its own (more accurate) signals. Prise Reversal helps to identify reversal points during the flat and the price extremums during the trend. At these points, you can enter a counter-trend with a short take profit. Besides, they indicate the time intervals when you cannot open a trend-following deal. After a few days of using the indicator, it will become an integral part of your trading sys

The indicator automatically sets trendlines on the really important points directly on the chart. Timeframe, color and style of the lines can be adjusted. Notification of a breakout above or below the line via a smartphone is possible.
Inputs Timeframe - Choose timeframe TrendlineColor - Choose line color TrendlineStyle - Line styles (solid, dash, dot, dash dot, dash dot dot) Alerts - True = alert SendNotifications - True = Notification via a smartphone

The idea for indicator is using multi-SuperTrend line to define market trend and Multi Moving Average line to find good entry point. The signal doesn't repaint, wait until the bar closed to make sure the signal is confirmed. Lowest RoyalBlue line is used for Buy stoploss. Highest Magenta line is used for Sell stoploss. Indicator supports alert when signal is coming (sends email, push notifications, sound alert). High Timeframe is better for using.
Indicator parameters:
CountBars = 500 — How man

This is a great indicator to find an exit point. We never know when the market is going to change its trend. Many indicators give you a good entry point, but not good to use opposite signal as an exit point, because the signal always comes too late. This indicator will protect your profit as soon as possible when a signal to exit is found! Don't use this signal to enter, it may not be good for making an entry. The signal doesn't repaint, wait until a bar closes to make sure it is confirmed. Indi

The indicator has been developed as a trading system component. It has proven to be an efficient technical tool when following a trend. The indicator shows the most suitable market entry points. It can be especially useful to those who add to positions after corrections in the trend direction. When a signal appears, the indicator generates an alert.
The settings contain the depth of the indicator display history and ability to disable alerts. The signal is generated upon closing of the current

Smart YTG has been developed for trading GBPUSD on the H1 chart. This is a trend following system and works well during trending price behavior using STOP orders. It detects trend by analyzing the Price Channel indicator which is built straight into the Expert Advisor, therefore you do not need to additionally install any indicator. On the flat areas where the market is undecided, and further movement of the market is being determined, a breakeven function is activated, and if there are open pos

The Nash Equilibrium MT4 draws the channel as a Trend and as Envelopes or Bands. You may use these white lines as levels for overbought and oversold conditions. Inside Bands, this indicator draws dot white line as a median line between the two bands and Aqua or Orange line and you may use this change of colors as moment to enter the market. Parameters nPeriod = 13 - number of Bars for indicator's calculation. nBars = 500 - number of Bars where the indicator is to be shown. Attention : This indic

This indicator is customized for binary option trading like M1 timeframe or turbo option trading. The way a binary option works is from the traders perspective is that you choose whether or not a certain underlying asset (a stock, commodity, currency etc.) is going to go up or down in a certain amount of time. You essentially bet money on this prediction. You are shown how much money up front you will earn if your prediction is correct. If your prediction is wrong, you lose your bet and the mone
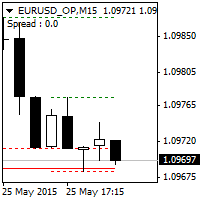
This indicator automatically draws Support and Resistance lines based on High and Low Candle at every timeframe. Support and resistance have a recurring nature as a trader goes through the process of building a strategy. Because of its importance, it is often reasonable for a trader to build object patterns for incorporating these prices into a strategy. When strong support and resistance levels are found, this can enable traders to effectively plot their approach, manage trades, and adjust risk
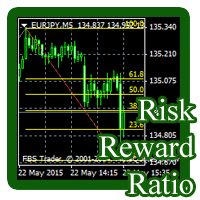
This indicator draws Fibonacci level automatically from higher high to lower low or from lower low to higher high. With adjustable Fibonacci range and has an alert function.
How to use Fibonacci Risk Reward Ration (R3) into trading strategy Forex traders use Fibonacci-R3 to pinpoint where to place orders for market entry, for taking profits and for stop-loss orders. Fibonacci levels are commonly used in forex trading to identify and trade off of support and resistance levels. Fibonacci retracem

Pyramid MA - Characteristics of the EA: uses Moving Averages (MA) indicator. Changes order grid when a trend reverses. Exponent of order volume increase by the main trading grid against averaging positions. Works on pending BUYSTOP and SELLSTOP orders. Uses a system of averaging losses which controls a balance of open trades and moves it to breakeven. Sound alert about open and completed trades. You can easily create your own trading strategy on the basis of PYRAMID MA.
Expert Advisor settings:

ROBO GRID FX is a grid Expert Advisor. It is developed for intraday trading in the active market and on fast currency pairs. This is a grid EA with a closed-loop averaging system. The closed-loop averaging system represents a stable strategy of moving to breakeven in case of the deposit drawdown on fast and aggressive currency pairs. The EA places a grid of pending orders in both directions and locks it on the breakthrough of a quote fluctuation in the channel of 40-60 points in case of an unrpo
The product combines a manual trade panel with the ability to perform actions automatically in a highly configurable way. Actions include capturing indicator values and then based on those values raising alerts, open/close or partially close trades, scale-in, setting up pending orders, adjusting stop loss, take profit and more. On-chart controls can be configured, such as tick boxes and buttons, so can be fully interactive. The EA also handles money management, news events, hidden stop loss, tak
The Trend Magic Alarm shows the direction of a trend and indicates when it changes with a sound, popup window, push or email notice. Blue dots in the chart indicate an uptrend, red dots indicate a downtrend. Levels of former highs + lows give orientation in a chart. Trend Magic Alarm can draw these levels as lines in the chart, see inputs.
Input Parameters Counter : number of bars used for calculation PowerSet : shows how near to the bars the trigger dots are placed DotSize : size of the shown
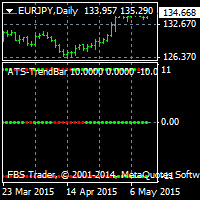
This indicator searches for the strongest trend and works on any timeframe. D1 timeframe is recomended. The product features three lines showing fast, medium and slow bars. If red bars appear at each of the three lines simultaneously, there is a strong bearish trend.
If green bars appear at each of the three lines simultaneously, there is a strong bullish trend. The indicator does not repaint and can be combined with other indicators. It is also suitable for binary option trading.
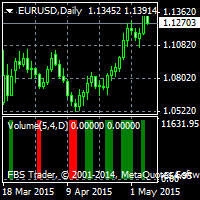
Alpha Trend Spotter (ATS) Volume Break Out This is an indicator that combines Volume breakout/breakdown and Moving Average Breakout/breakdown. It is able to predict further price changes. It is not repainted, not recalculated. All lines are shown at the open of a new candlestick, never winking or vanishing in the current candle. These lines are appeared at the beginning of the current candle. Suitable for M5 to D1 Timeframe. How to Use: If Green line appears, that shows the "oversold" area, so t
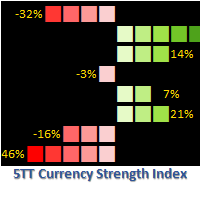
Want to know if to go long or short on any currency pair? 5TT Currency Strength Index is the answer! 5TT Currency Strength Index is a unique indicator for determining the short-term strength of any currency. Each currency strength is determined by an index of the currency with the strength of 7 other major currencies. The indicator is constantly monitoring price action across 28 currency pairs and 56 combinations; taking the following into consideration Price volatility. Short-term price range.

The indicator generates early signals basing on ADX reading data combined with elements of price patterns. Works on all symbols and timeframes. The indicator does not redraw its signals. You see the same things on history and in real time. For better visual perception signals are displayed as arrows (in order not to overload the chart).
Features Easy to use. Filter configuration only requires selection of sensitivity in the " Sensitivity of the indicator " input.
Signals can be filtered using
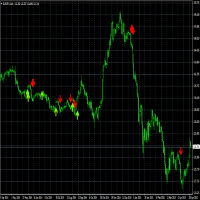
Supplement for Alpha Trend Spotter (ATS) Indicator: https://www.mql5.com/en/market/product/8590 This indicator acts by price action. Use it when ATS shows clear Bullish or Bearish Trend for finding the strongest trend each day. Suitable for timeframes M5, H1, H4 and D1. Suitable for Binary Option 5 minutes signal. How to Use: RED Arrow means Sell
GREEN Arrow means Buy
The Expert Advisor is based on simple mathematics. The EA places two opposite-directed orders. Wherever the price goes, one order will always have a positive result, the second one will have negative. If we average it, then on the return movement of the price (only a few spreads) the averaged orders are closed and there is only profitable order left! The EA trades through its profit. Of course, the averaging positions also add profit due to MinProfit , especially if you use rebate programs to re

StarDust searches for divergences in the values of several indicators considering them as signs of flat and enters the market if a relatively steady trend is detected. The Expert Advisor trades "basic" symbols with a low spread. The best results are achieved on М15. The EA automatically adjusts to 4 and 5-digit quote flows.
Settings Comment_to_orders – comment to a placed order. The field can be left blank if no comment is required. MM – enable money management with automatic setting of a worki
The Average Directional Index (ADX), Minus Directional Indicator (-DI) and Plus Directional Indicator (+DI) represent a group of directional movement indicators that form a trading system. This indicator shows ADX data from 9 currency pairs by your choice for all 9 Time Frames. Input parameters From Symb1 to Symb9 - you may change any of this Symbol to any legal currency pair existed on your platform. MainLine = false; - if TRUE then the ADX measures trend strength without regard to trend direct
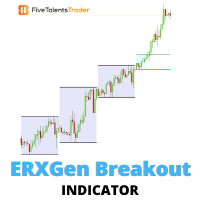
Without volatility, trading the financial market is close to impossible. Profit is made ONLY when the price is moving. The ERXGen (Early Riser Next Generation) system is a short-term trading technique built around the phenomenon that there are certain times during a trading day when the price volatility has the tendency to be high. In essence, ERXGen is based on the very popular London Open Breakout strategy, although with bespoke tried and tested rules that increase consistency and profitabilit

Trend Stop Introduction Trend Stop is a simple yet powerful trend-following and stop-placement tool for MetaTrader 4.
It calculates the highest high or lowest low of the last N periods and plots a dynamic line that reacts instantly to trend changes. The result is a clean, reliable trend filter and a practical guide for placing optimal stop levels — without unnecessary noise or lag. Whether you’re a trend trader, swing trader, or scalper, Trend Stop helps you stay on the right side of the marke

"Nice Forex Pro" is particularly effective for the EUR/USD currency pair, which is one of the most popular and liquid pairs in the Forex market. The EA can be optimized for this pair due to several reasons: Why "Nice Forex Pro" is Best for EUR/USD : High Liquidity : The EUR/USD pair is the most traded currency pair in the world, which means it offers high liquidity. This results in tighter spreads and less slippage, making it ideal for automated trading systems like Nice Forex Pro , which rely

This indicator shows bands (flexible corridor) for a current price movement and the change of trend. The indicator can be used on any time frames and currency pairs. The following input parameters can be easily changed for your needs: nPeriod = 13; - number of bars which the indicator will use for calculation Deviation = 1.618; - coefficient for bands distance from the middle line MaShift = 0; - shift from current bar

Un indicatore visivo dell'andamento e della forza delle valute sotto forma di istogramma e tabella sul grafico principale, un grafico dei cambiamenti nelle tendenze valutarie e un blocco di analisi su una finestra aggiuntiva del grafico. Analizza 28 coppie di valute formate da 8 valute principali (EUR, USD, GBP, JPY, AUD, CAD, CHF, NZD).
Caratteristiche dell'indicatore Determina la direzione e la forza dell'andamento di valute e simboli e costruisce su questa base istogrammi multicolori, tabell

This indicator shows an Up trend ( Green square ) if a parabolic SAR value is below the current price, and Down trend ( Red square ) if a parabolic SAR value is above the current price from all Time Frame for each currency pairs. Input parameters from Symb1 to Symb9 — You may change any of these Symbols to any legal currency pair existed on your platform. step=0.0; — Represents the acceleration factor for PSAR indicator. maximum=0.2; — Maximum value for the acceleration factor for PSAR indicator
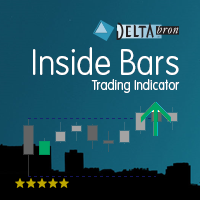
The Inside Bars indicator shows Inside Bars, the Breakout Zone and Breakouts thereof. Inside Bars are an important price action pattern. The price action of an Inside Bar is completely covered by the price action of the previous bar. Inside Bars are most often used on higher timeframes. Settings Inside Bars default settings are good enough most of the time. Feel free to fine tune them to your needs. ATR factor to skip large candles - very large candles should be filtered as they often cover othe
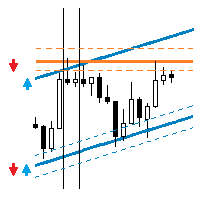
This EA trades support/resistance levels which were placed by a trader (Trend Line from toolbar). The direction of a trade is set graphically by arrows: ↑ - buy; ↓ - sell; - buy or sell in case of crossing support/resistance level. The level is off if inconsistent directions were set, like: ↑↓, ↑, or ↓. If the price is lower than a level it is a resistance level. And opposite is true for support level. There are a few methods available for levels defining, for testing with visualization as

Olimpia Dragged Trends! This dashboard indicator is a visual tool which recognizes dragged trends of 28 pairs in a easy-to-read histogram. You will see a group of squares indicating the sum and average values of trends of the last "...." minutes for each square from L to A in a dragged way. "Dragged Way" means that regardless the hour of the day or opened or closed candle it always shows the present and the pastinformation. You can configure a sequence of numbers with values between 1 minute to
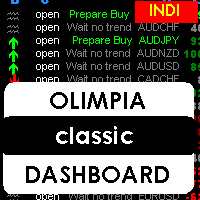
This indicator is a multipairs dashboard which recognizes the best pair setup to open orders with 8 families of currencies. Families of currencies include: AUD, USD, EUR, GBP, CAD, NZD, CHF, JPY; 28 pairs in total. The precise moment to open an order is shown at Column A on the dashboard, you can also setup alerts, e-mails and notification to mobile devices. You can filter alerts by spread value of pairs.
What is the dashboard showing? RED values mean short trends, GREEN values mean long trends
This indicator shows an Up trend (Green square) if a fast MA is above a slow MA and Down trend (Red square) if a fast MA is below a slow MA from all Time Frames for each currency pair. Input parameters: From Symb1 to Symb9. - You may change any of this Symbol to any legal currency pair existed on your platform. Period_Fast = 5; Method_Fast = MODE_EMA; Price_Fast = PRICE_CLOSE; Period_Slow = 21; Method_Slow = MODE_SMA; Price_Slow = PRICE_TYPICAL; Attention: Before using this indicator you have t
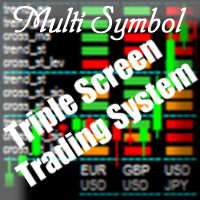
Purpose The indicator is intended for manual multi-currency trading based on the Triple Screen Strategy. It works with any symbols located in the Market Watch window of the MT4: currencies, metals, indexes, etc. The number of instruments can be limited by capacity of the МТ4's parameters. But if desired, you can create several windows with various set of instruments and parameters.
Operation Principle The indicator uses the modified Triple Screen Strategy for determining trend direction in the
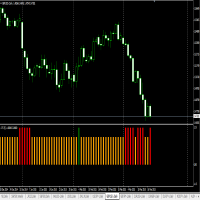
This is an indicator for finding the strongest trend each day, suitable for intraday trading or a swing trading. See the live performance at : https://www.mql5.com/en/signals/93383
How to Use: RED BAR means Bearish Trend for the next candle GREEN BAR means Bullish Trend for the next candle ORANGE BAR means Sideways Trend for the next candle
Example:
If we are using D1 timeframe, see the last BAR, if the bar is RED BAR, open short/sell for today. If we are using H1 timeframe, see the last BAR,

The indicator is designed for visual determining market directions. It allows to determine the distance from a price and helps in drawing correct conclusions. Perfectly defines flat zones, horizontal intraday trends and trend movements, and an additional setting allows to use the indicator on any instrument. Does not redraw its readings. You get professional trading indicator for a reasonable price.
Settings: Period_FF = 7 - indicator period Sensitivity_FF = 5 - sensitivity in % Wish you all su

Provides the simplicity of binary options but addresses the shortcomings of regular binary options, namely: Poor risk reward ratio, fixed duration trades, poor broker choice, poor indicators/alerts, no hidden (stealth) stop loss/take profit, etc.
Features 1 to 1 risk reward ratio, calculated automatically (configurable) Manual (with alert) or automatic trade entry (on alert conditions) Lot size calculation (money management) - based on % of account to risk or fixed amount Compact interactive on
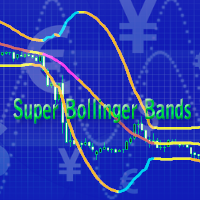
This is a forward-looking indicator for trading on all instruments. An advanced version of Bollinger Bands indicator created by outstanding analyst John Bollinger. One of the main differences of Super Bollinger Bands indicator from its predecessor consists in displaying upper and lower bands behavior on the middle line with some specific colors. Thus, the indicator gives a trader some visual information about trend development at the moment, and not in the past, as majority of other indicators d

The Breakout Indicator That Has Been Proven & Tested! Breakout Analyzer uses an advanced algorithm based on high probability price patterns. Each trade is analyzed on the statistics panel to help you evaluate the best breakout setups.
Bonus Strategy 1
Breakout Analyzer with Volume Critical Watch Video: (Click Here)
Bonus Strategy 2
Breakout Analyzer with Strength Meter
Watch Video: (Click Here)
Features Universal compatibility to different trading systems Analyzes statistics of breakout sign
Advanced ADX indicator that allows operating on many timeframes simultaneously! Unique indicator with the ability to display ADX charts not only on the current timeframe, but also on higher ones. The example attached shows how it is possible to see 3 ADX chart on M5, M15 and M30 timeframes respectively. This functionality allows to significantly improve the accuracy of determining the trend. The Timeframe Delta parameter specifies how much the indicator’s timeframe should be different from the t
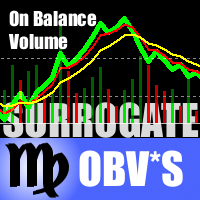
This is a special edition of the On-Balance Volume indicator based on pseudo-real volumes emulated from tick volumes. It calculates a near to real estimation of trade volumes distribution for Forex instruments (where only tick volumes are available) and then applies conventional OBV formula to them. Volumes are calculated by the same algorithm that's used in the indicator TrueVolumeSurrogate . The indicator itself is not required but can be used for reference.
Parameters MAfast - fast moving av
Pipfinite creates unique, high quality and affordable trading tools. Our tools may or may not work for you, so we strongly suggest to try the Demo Version for MT4 first. Please test the indicator prior to purchasing to determine if it works for you. We want your good reviews, so hurry up and test it for free...we hope you will find it useful.
Combo Energy Beam with Swing Control Strategy: Confirm swing pullback signals Watch Video: (Click Here) Energy Beam with Trend Laser Strategy: Confirm Tre

Description Shows whether market is trending or not, to what extent, which direction, and if the trend is increasing. The indicator is very useful for trend following strategies. The indicator can also alert when the market transitions from being flat to trending, which can serve as a great entry point. The alert is controllable directly from the chart, with an on-chart tick box to enable the alert. Also includes bonus indicators of current spread and ask/bid prices in large text, color coded as
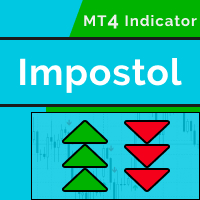
New indicator Impostol is based on the relative strength index (RSI) and trend indicator ADX. With it, you can identify a trend for your trade. Its signals are easy ti interpret, because it shows the recommended entries using up and down arrows. The indicator has a minimum of settings and is easy to use.
Impostol Expert for MetaTrader 4 — HERE
Main features Uses arrows to show market entry points. The indicator is not redrawing. Recommended timeframe is H1 and higher (lower timeframes can sh
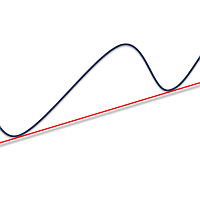
Simply drop the indicator to the graph and support and resistance levels will be shown automatically! The indicator for automatic drawing of support and resistance levels based on THREE points. Identified points are marked on the chart Indicator shows break through price for both bullish and bearish trends (if found) You can specify on how many bars the indicator shall look in order to identify supporting points. In addition, you can select on which time frame the indicator will work. That means

Dedicated to grid trading fans. For a long period I was trading using Manual Trader by Ramil Minniakmetov. I liked this program but soon I came up with an idea to improve the program by making the grid vivid and adding something mine. 1) I taught the program to take swaps and commission into account. 2) If the market allows, the program trails a gain by moving Profit. 3) The program spends a part of the gain partially killing the lower order and moving to a smaller lot, preventing it from going
Volume Gives Depth To Price Action! Volume Critical can accurately locate the cheapest areas to place trades. Enter reversals as early as possible to get the best Risk Reward setups!
Features Aggressive algorithm that anticipates reversals Volume Classifications Gray Histograms - Normal Volume, average market activity Orange Histogram - Trending Volume, increased market activity Pink Histograms - Overbought Volume, we can wait for further confirmation to sell Blue Histograms - Oversold Conditio
Did You Have A Profitable Trade But Suddenly Reversed? Exiting a trade is equally important as entering! Exit Scope helps maximize your current trade profit and avoid turning winning trades to losers.
Attention Exit Signals are NOT to be used in entering a trade! Exit means closing your trades to avoid correction/reversal which can wipe out existing profit or haunt break-even orders. Please watch presentation (Click Here)
Features Generates instant exit signals based on price action, volatili

Overbought describes a period of time where there has been a significant and consistent upward move in price over a period of time without much pullback. Oversold describes a period of time where there has been a significant and consistent downward move in price over a period of time without much pullback. This indicator will show the Overbought conditions (Green Bars) and Oversold conditions (Red Bars). The value of Green/Red Bars represents a power of the price movement. Input parameters numBa
Il MetaTrader Market è un negozio online unico di robot di trading e indicatori tecnici.
Leggi il promemoria utente di MQL5.community per saperne di più sui servizi unici che offriamo ai trader: copia dei segnali di trading, applicazioni personalizzate sviluppate da freelance, pagamenti automatici tramite il Sistema di Pagamento e il MQL5 Cloud Network.

Ti stai perdendo delle opportunità di trading:
- App di trading gratuite
- Oltre 8.000 segnali per il copy trading
- Notizie economiche per esplorare i mercati finanziari
Registrazione
Accedi
Accetti la politica del sito e le condizioni d’uso
Se non hai un account, registrati