Guarda i video tutorial del Market su YouTube
Come acquistare un Robot di Trading o un indicatore
Esegui il tuo EA
hosting virtuale
hosting virtuale
Prova un indicatore/robot di trading prima di acquistarlo
Vuoi guadagnare nel Market?
Come presentare un prodotto per venderlo con successo
Nuovi indicatori tecnici per MetaTrader 4 - 124

Multicurrency and multitimeframe modification of the Commodity Channel Index (CCI) indicator. You can specify any desired currencies and timeframes in the parameters. Also, the panel can send notifications when crossing overbought and oversold levels. By clicking on a cell with a period, this symbol and period will be opened. This is MTF Scanner. The key to hide the dashboard from the chart is "D" by default.
Parameters CCI Period — averaging period.
CCI Applied price — price type.
Clear the
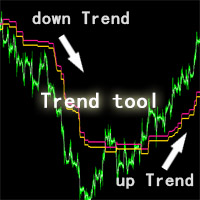
This ZhiBiQuShi tool is suitable for all varieties and is suitable for more than 5 minutes. It is a good tool for judging trends!
The price is a downward trend below the two lines, and the price is an upward trend above the two lines.
DESCRIPTION OF SETTINGS till_breakeven_rate : Determines how closely the channel will follow the price till the trade breaks even. RECOMMEND 1 space1 : Determines the width of the channel from the beginning of a trade till profi
FREE
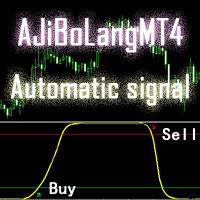
This AJiBoLang indicator is suitable for all cycles of the signal, very suitable for short-term signals
Just look at the arrows on the chart and make a single order. The green arrow is the Buy single and the red arrow is the Sell single.
After making the Buy order, if the yellow line goes up to the upper level and travels a certain distance, then you can sell the Buy order.
After making the Sell single, if the yellow line goes to the lower level and travels a certain distance, then the Sell o

This is a unique MACD indicator that is more accurate and easy to use than traditional MACD. It is suitable for any chart cycle and is suitable for any market variety.
The red column is the (Buy) band signal, and the blue column is the (Sell) band signal.
The yellow and green lines are trend lines, and the two lines never cross.
Buy: In the blue column, look at the green line up through the middle 0 axis.
Sell: In the red column, look at the yellow line down the middle 0 axis.
The MACD's de

Indicator for determining adjustments and price reversals It gives signals for inputs and shows the general direction of the price movement. Allows you to conduct trend and counter trend trading It works on all timeframes, on any currency pairs, metals and cryptocurrency Can be used when working with binary options Distinctive features Does not redraw; Thanks to simple settings, you can quickly adapt to any trading instrument; It works on all timeframes and on all symbols; Suitable for trading c
*Non-Repainting Indicator Message Me Immediately After Purchase For VIP Installation Help and Free Strategy Bruce's Price Predictor is an indicator that shows precise price reversals. A great arsenal to add to any chart. Bruce's Price Predictor points price reversals with high degree of accuracy and it is great for scalping on the 1min time frame, Or swing trading on the 1hr time frame. Buy and sell arrows are shown on the chart as for entry signals. They do not repaint but confirmation ent

Mystic Arrow - уникальный авторский индикатор, отображающий сигналы в направлении основной тенденции, и против нее. Благодаря разнообразию настроек и фильтров индикатор можно настроить под свой стиль торговли. Mystic Arrow подходит для любого таймфрейма, валютной пары. Сигналы индикатора не пропадают ни при каких условиях. Отличительной особенностью является возможность настроить сигналы индикатора отдельно для тенденции и против нее. Имеет в качестве отключаемого фильтра показания ценового кан
The RSI S-RoC indicator differs from the standard RSI in that it takes into account the price rate of change when calculating values. When the price moves in a trend, the indicator produces good entry signals oncethe price touches its levels. The level values can be configured in the indicator settings. They can also be modified and adjusted directly in the indicator window. You can also set on a chart signal lines. Once they are crossed, the indicator will produce a sound alert or play a user
FREE

This indcator shows the trend with the color histogram. It is simple and easy to use. Usage: If the histogram changes from the aqua to the fuchsia, which means the trend is up. If the histogram changes from the fuchsia to the aqua,which means the trend is down. Inputs: MaPeriods: the periods of moving average. f1: the multiplier of inner bands f2: the multiplier of outer bands Popup Window Alert Email Alert Mobile Push Alert Alerts When the trend changes from the long trend to the short trend or
Advanced Trend Finder follow trend. Color change trend changed.
Works in EURUSD/GBPUSD/XAUUSD/USOIL/US500/USDJPY/USDCAD/JP225/USDTRY/USDMXN and all pairs
Best timeframes 5M/15M/1H/4H/DAILY
Signal on close of a bar.
DOES NOT repaint. DOES NOT repaint. DOES NOT repaint. DOES NOT repaint.
DOES NOT recalculate. DOES NOT recalculate. DOES NOT recalculate. DOES NOT recalculate Settings SoundOn : true/false EmailOn : true/false PushNotificationOn : true/false
ver 1.1 update notes:
Added Alert Arr

The diamond top and bottom are reversal patterns. It represents a rally to a new high with a drop to a support level followed by a rally to make a new high and a quick decline, breaking the support level to make a higher low. The bounce from the higher low is then followed by a rally, but making a lower high instead. Once this behavior is identified, prices then break the trend line connecting the first and second lows and start to decline further. You can find MT5 version hier
Indicator shows
The Trend Line PRO indicator is an independent trading strategy. It shows the trend change, the entry point to the transaction, as well as automatically calculates three levels of Take Profit and Stop Loss protection.
Trend Line PRO is perfect for all Meta Trader symbols: currencies, metals, cryptocurrencies, stocks and indices. The indicator is used in trading on real accounts, which confirms the reliability of the strategy. Robots using Trend Line PRO and real Signals can be found here:

This Indicator Paints levels which are very ' Adamant ' and strong in nature. These levels act as strong Price rejection levels for a life time and never repaint.
Disclaimer : If you are looking for a Fancy, colorful and eye catchy indicator please stay away.
No trader can become a good trader without considering levels where the price can hold, bounce or break. These levels help traders to enter markets at a cheaper price. They can be Support resistance, demand supply, pivot point, Fibonacci

The ZhiBiJuJi indicator analysis system uses a powerful internal loop to call its own external indicators, and then calls the analysis before and after the cycle. The data calculation of this indicator analysis system is very complicated (calling before and after the cycle), so the hysteresis of the signal is reduced, and the accuracy of the advance prediction is achieved. This indicator can be used in all cycles on MT4, and is most suitable for 15 minutes, 30 minutes, 1 hour, 4 hours. Buy:

The indicator helps to identify possible rollbacks and reversals. Shows the direction of the price movement and is painted in the appropriate color. Allows you to conduct trend and counter trend trading It works on all timeframes, on any currency pairs, metals and cryptocurrency Can be used when working with binary options Distinctive features Does not redraw; Simple and clear settings; It works on all timeframes and on all symbols; Suitable for trading currencies, metals, options and cryptocurr
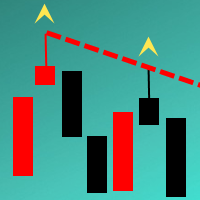
The Indicator automatically draws trend lines on the specified timeframe ( Trend lines period parameter). The lines are drawn based on the last two known fractals of the specified period. A peculiarity of this Indicator is that the lines are drawn with accuracy up to 15 minutes. It allows analyzing the chart on smaller timeframes without loosing the precision of drawing the lines in relation to the extrema of the prices. It is suitable for an intraday and medium term trading. The minimum timefr

Taurus All4
Taurus All4 is a high-performance indicator, it will tell you the strength of the trend, and you will be able to observe the strength of the candle. Our indicator has more than 4 trend confirmations.
It is very simple and easy to use.
Confirmation Modes Candle Trend Confirmations: When the candle switches to light green the trend is high. When the candle switches to light red the trend is reverting down. When the candle changes to dark red the trend is low. Trendline Trend Confirm
Технический индикатор Forex ForexMarshalsTrend - это уникальный, эксклюзивный и прорывной финансовый инструмент, основанный на сложном математическом алгоритме колебаний стоимости конвертации цены, который способен прогнозировать дальнейшие изменения цены. Индикатор относится к группе трендовых индикаторов. Он предоставляет возможность принимать правильные решения о своевременном входе или выходе из рынка и в своих настройках указывает, следует ли открывать длинную или короткую позицию для получ

With this indicator you'll have a general reading of the market's range using Gann's calculating modes. Gann's swing is used to have a quick reading to the market latest movements at first glance. The foundation of this swing calculation is in the count of candles in relation to the break-up and break-down of the price. When the price breaks-up the last maximum, the swing will get traced if a certain number of candles is exceeded from the last minimum. It can be used a "pure Gann" or not: If set

UniversalIndicator is a universal indicator. A great helper for beginners and professional traders. The indicator algorithm uses probabilistic and statistical methods for analyzing the price of a trading instrument. The indicator is set in the usual way. Advantages of the indicator works on any time period works with any trading tool has a high probability of a positive forecast does not redraw Indicator Parameters LengthForecast = 30 - the number of predicted bars
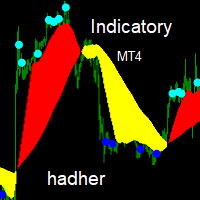
Indicatory is an indicator uses price action and averaging movement to trigger it's signals buy signal when the blue sun completely sunset's under the yellow clouds Sell signals when the aqua sun completely rise's over the red clouds you could call the indicator to any EA code for auto trading ,optimizing,sell signal index buffer number is (2) buy signals index buffer number is (3)... try to avoid weak signals which occur at the end of clouds ,strong signals occur's when there is a wid

The indicator is designed for opening trades for a long period. he is set up to get as many points from each trade as possible. he uses the scalping method... you can trade on any currency pairs indicator is already you can trade at any time of the day but the preferred time of trading during the European American session. currency pairs eur / jpy, eur / usd currency pairs with high volatility then the results are much better.

Over Arrow - уникальный авторский индикатор, имеющий возможность отображения сигналов в направлении основной тенденции, или против нее. Over Arrow подходит для любого таймфрейма, валютной пары, но лучше всего использовать его на средних временных периодах, таких как М30, Н1, Н4. Сигналы индикатора не пропадают ни при каких условиях. Отличительной особенностью является наличие фильтра тенденции, при активации которого, сигналы будут появляться только в направлении основного движения.
Параметры

Keltner Channel is a well known indicator that not in MT4's indicators default lineup (You can get this from your broker somehow). This indicator helps you to define trend and sometimes overbought/oversold prices during flat trend. Input Description: EMAperiod: Moving Average period used for indicator. Must be higher than 1. ATRperiod: Average True Range period used for indicator. Must be higher than 1. multiplier: Multiplier used for determine channel's wide. Must be higher than 0 but may not b
FREE

BuySell Volume is an indicator that approximates Buy and Sell volumes based on price movement. Input Description: applied_model: Choose the applied model. In low reversal mode, price is considered receive low bearish pressure during bullish candle's creation (high bearish pressure on high reversal model. In other words, Bullish Marubozu candles has really high Buy Volumes in low reversal model than in high reversal one.
Output Description: Buy and Sell Volume: Determines how many Buy and Sell vo
FREE

This indicator will let you have at disposal Gann's Eighth, with few clicks!! Gann's Eighth were used by this great Trader to obtain the maximum fluctuation price and the possible inversion points of it. Gann have always given importance to the number 8 in his studies, an it is the reason why we find the retracement points as 0.25(10/8=1.25). Other than the number 8, also the numer 3 had is own importance in Gann, number founded in the eighth division, infact we have three eighth describing the
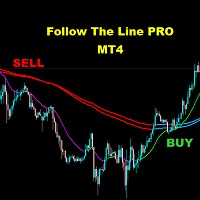
FOLLOW THE LINE (PRO VERSION) This powerful indicator is the full and complete version of my free indicator called "Follow The Line". IT IS BASED ON the popular maxim that: "THE TREND IS YOUR FRIEND" It gives alarms and alerts of all kinds. IT DOES NOT REPAINT and can be used for all currency pairs and timeframes.
AVOID FALSE SIGNALS:
BUY ONLY when price closes above the green line and the green line is above the blue channel.
SELL ONLY when price closes below the pink line and the pink line i

This is a simple and useful indicator for gold. Timeframe is 15M.
It simply shows the meanginful potential turning check point for gold.
You can combine your method with this signal. You can use it as a part of your decision signal to become a more powful strategy for yourself to get more great decision.
The indicator will not be repianted. Just simple and useful. Guys, just try it.

The Wolfalizer Indicator combines the functionality of the Engulfing Stochastic along with the ConsecutiveRSI and adds alerts along with more detailed output to the journal. This Indicator will alert you when RSI or Stochastics cross into oversold or overbought. You can set the oversold and overbought levels for RSI and Stochastics separately. You can pick if you want an engulfing candle to appear on the cross or set a number of consecutive candles you would like to see. Interesting Inputs i

È progettato per essere utilizzato da chiunque, anche il principiante assoluto nel trading può usarlo. NON ridipinge MAI. Le indicazioni sono date da vicino a vicino. Progettato per essere utilizzato da solo, non sono necessari altri indicatori. Ti dà la tendenza e il potenziale Take Profit all'inizio della giornata. Un grafico specifico mostra il potenziale profitto in base ai dati storici.
Come funziona Breakout Pro Scalper Solution utilizza una strategia di breakout combinata con azione su

Based on MACD indicator waves with standard parameters Applies Fibonacci levels to the last two MACD waves, positive and negative respectively, if at the moment the MACD indicator runs out of negative Wave - the color is green, if at the moment the MACD indicator runs out of positive Wave - the color is red. The Wave termination criterion is two ticks with a different MACD sign. Applies trend lines on the last four MACD Waves. Works well with the expert Figures MACD https://www.mql5.com/ru/mar
Increase trade accuracy with the time-tested cup and handle patterns
The Cup and Handle pattern is a technical price formation that resembles a cup and handle, where the cup is in the shape of a "U" and the handle has a slight downward drift. The right-hand side of the pattern -the handle- is smaller than the left-hand side -cup-, and retraces no more than 50% from the top. It can be both a continuation and a reversal pattern. [ Installation Guide | Update Guide | Troubleshooting | FAQ | All Pr
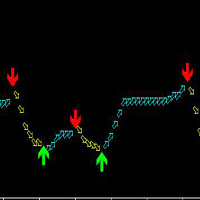
This indicator is suitable for any variety on MT4 and any cycle, but the most suitable cycle is 30 minutes and 4 hours. It is simple to use, the arrows will never change, no drift, no backfire.
The principle of this index is based on ATR and custom MA, combined with mixed computing, developed, high accuracy.
Buy: Look at the green up arrow;
Sell: Look at the red down arrow.
The arrow appears and orders immediately!
It is suggested that the two cycles should be looked at together, which is t

This indicator was tested on the basis of real statistics for all market indicators according to indicators for 3 months of trading. trade forecasts for usd / jpy on the m30 time frame were received on our statistics! if you have any questions, please contact us in private messages or in discussions under this indicator and we will figure it out and help
any questions will arise personal messages or in discussions under this indicator As soon as the blue points appear, we open a deal to increa

Arrow indicator showing market trends The histogram shows the direction of movement, and the arrows indicate favorable points for opening positions. Can be used on any currency pairs, metals and cryptocurrency Suitable for working with binary options
Distinctive features Defines a change in trend; Works on all timeframes and on all symbols; Suitable for trading currencies, metals, options and cryptocurrency (Bitcoin, Litecoin, Ethereum, etc.) Suitable for manual trading and for developing advis

I present an indicator for professionals. ProfitMACD is very similar to classic MACD in appearance and its functions . However, ProfitMACD is based on completely new algorithms (for example, it has only one averaging period) and is more robust, especially on small timeframes, since it filters random price walks. The classic MACD indicator (Moving Average Convergence / Divergence) is a very good indicator following the trend, based on the ratio between two moving averages, namely the EM

RSI indicator with signal lines, at the intersection of which a corresponding notification will be issued, which can be in the form of a normal alert, or in the form of a user sound file.
The indicator also has the function of sending push-notifications and email notifications at the intersection of these levels.
The values of the levels can be set independently in the indicator settings, and, if desired, they can be changed and configured directly in the indicator window. To check the oper

RSI indicator with signal lines, at the intersection of which a corresponding notification will be issued, which can be in the form of a normal alert, or in the form of a user sound file.
The indicator also has the function of sending push-notifications and email notifications at the intersection of these levels.
The values of the levels can be set independently in the indicator settings, and, if desired, they can be changed and configured directly in the indicator window. This product is a
FREE

ComplexPulse - pulse indicator or signal. Sensitive and responsive to price movements. The indicator shows the interdependence of various currency pairs, namely: USD, EUR, GBP, CHF, JPY.
Currencies are measured in relative units, so in each unit of time the sum of all currencies will be equal to zero. Hence, one of the main elements of cluster indicators is the zero line, or the balance line (zero line). If a currency is below the balance line, then it is said that the currency is oversold rela
This ALL IN ONE indicator detects Inside Bar Narrow Range 4 and Inside Bar Narrow Range 7 two powerful patterns on 17 CFD on all timeframes. "Inside Bar Narrow Range 4" is an inside bar with the narrowest range out of the last 4 bars so "Inside Bar Narrow Range 7" an inside bar with the narrowest range out of the last 7 bars.
Hence, IBNR4 and better IBNR7 are an objective criterion for identifying decreased range and volatility. Once we find an IBNR4 or an IBNR7 pattern, we aim to trade the

This product is optimally used for scalping. It is a trend following system, it understands that the trend is your friend. It takes advantage of the buying/selling after the pullback in continuation of the current trend wave. It works by analyzing dynamic support and resistance, and is based on the Ichimoku Indicator variables which is know to be the most consistent & holistic indicator out there. Settings can also be adjusted to suite the market conditions. -> can be adjusted for longer term

This indicator determines minimum volumes needed during a candle formed so that it would be higher than current volume's average. Although you can place MAs on your volume indicator, this indicator has non-repaint characteristic so you may not to worry about sudden volume increase. This indiator also draw volume indicator for its own. Input Description: period: Period used for indicator. Must be higher than 1. Output Description: VolumeXover: This indicator's main feature. During the time the vo
FREE

Индикатор вычисляет наиболее вероятные уровни возврата цены. Может быть использован для установки уровня тейк профит. Рекомендуемый таймфрейм - любой, при соответствующей настройке. Настройки.
Period - количество свечей для анализа. Accuracy - точность расчёта уровня в пунктах. Width - размер ценовой метки. Отработка уровней как правило не занимает много времени, уровни достаточно точны при касании и процент возврата цены к ним достаточно высок. Но следует учитывать риск продаж на локальных мин
FREE

This indicator maps price crossover with Simple Moving Average (SMA) for each candle. Works like a SMA but has non-repaint characteristic. How to Use: As stated before, this indicator works like a SMA. Use this to determine trend. When price is above this line then the uptrend is expected (downtrend if price below the line). 2 of these indicator (with different periods) can also generate buy/sell signal like 2 SMAs. When the lower period SMA crosses higher period SMA from below, then buy signal
FREE

A pretty common candlestick Price Action is a 1-2-3 pattern. The appearance of this formation predicts a turn of the market with a high degree of probability. In most cases, pattern trading brings even a small but stable profit with low risks. Trading based on a 1-2-3 pattern can be carried out absolutely on all time frames, on charts of any currency instruments, as well as on the futures market. The structure of the model is not complicated, but this does not prevent us from finding good points

This is the binary options signal you all have been looking for. This in a modified version of the Garuda Scalper, that has been modified for Binary Options traders. Signals are very unique! Why this is so effective for binary options is because it is a trend following system, it understands that the trend is your friend. It takes advantage of the buying/selling after the pullback in continuation of the current trend wave. Because signals are generated after the pullback, you can place shor

L'Oscillatore di Volatilità KT analizza i dati di mercato passati e presenti utilizzando una formula matematica per mostrare il risultato sotto forma di oscillatore. Le onde crescenti e decrescenti corrispondono rispettivamente a un'elevata e a una bassa volatilità dell'asset. In poche parole, la volatilità è semplicemente una misura delle fluttuazioni di prezzo di un asset in un certo periodo di tempo. Senza volatilità, ci sarebbero pochi movimenti di mercato e i trader non potrebbero trarre p

I recommend you to read the product's blog (manual) from start to end so that it is clear from the beginning what the indicactor offers. This multi time frame and multi symbol trend indicator sends an alert when a strong trend or trend reversal has been identified. It can do so by selecting to build up the dashboard using Moving average (single or double ( both MA:s aligned and price above/below both ) ), RSI, Bollinger bands, ADX, Composite index, Parabolic SAR, Awesome (AO), MACD (signal l

Arrow indicator, for determining price reversals Arrow appears on the closed bar Allows you to enter the transaction at the very beginning of the turn Can be used on any currency pairs, metals and cryptocurrency Suitable for working with binary options
Distinctive features Determines the price correction; Advanced settings for fine tuning; It works on all timeframes and on all symbols; Suitable for trading currencies, metals, options and cryptocurrency (Bitcoin, Litecoin, Ethereum, etc.) Suitab
The newest indicator for binary options. The indicator looks for large market turns and gives out qualitative signals for 2 candles ahead. The indicator also works on Forex, but was developed initially under binary options.
After the appearance of the arrow, you receive a notification by e-mail, PUSH notification to the phone or an allert at the terminal.
Signals appear at the beginning of the new bar. Timeframe 1 hour. Expiration period 2 candles.
More than 75% of signals are closed in posi
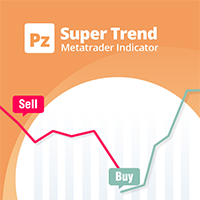
A top-quality implementation of the famous Super Trend indicator, which needs no introduction. It is completely loyal to the original algorithm, and implements many other useful features such as a multi-timeframe dashboard. [ Installation Guide | Update Guide | Troubleshooting | FAQ | All Products ] Easy to trade It implements alerts of all kinds It implements a multi-timeframe dashboard It is non-repainting and non-backpainting Input Parameters
ATR Period - This is the average true range perio
FREE

Create your Dashboard with few clicks! With the Custom Dashboard Wizard you'll be able to create your dashboard also without any programming knowledge. This indicator/panel will give you the possibility to add/remove the values of the Metatrader4 standard indicators in any time frame you like, with any value you like and in any market you like, just be careful about writing the market name exactly as it's written on the list of your Market Watch. The main panel will be composed of three columns

Ещё один простой информационный индикатор, показывающий самые важные торговые сессии валютного рынка. О понятии торговых сессий.
Всем известно, что торговая сессия – это промежуток времени, в течение которого банки и другие
участники рынка ведут активную торговлю, при этом активизируются в определённые часы рабочего дня.
Валютный рынок, рынки акций и сырьевые рынки работают круглосуточно с понедельника по пятницу, кроме праздничных дней.
Когда в одной стране ещё спят, в другой рабочий ден

Descption: The Volume Profile displays detailed informations of historical trading activities at certain price levels (Market Profile). So you can locate the areas with the best prices in the market and get an advantage about other market participants.
Features: Customizable Volume Profile / Market Profile Shows the "fair" Value Area with 70% of all Volume
Shows critical low volume zones
Shows VPOC, VAL and VAH Points Works on all timeframes Also available for MT5 ( https://www.mql5.com/en/mark
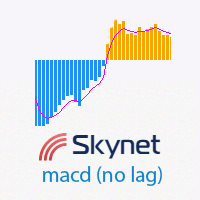
This indicator displays a histogram of the crossover of two analogs of the moving average, in appearance it is the same as the classic MACD indicator, but with almost no delay. The first value of the indicator after going through zero is calculated using the difference between the upper and lower Bollinger bands.
Advantages there is practically no delay with an increase in the averaging periods, since analogs of the average are used, where there is no such negative effect as delay. much less ze

Trade on the levels - the classic in the work of the trader. The ReversLevel indicator is one of the easiest but not less effective tools. From these levels you can build turning points, levels are constructed as statistical significance at a given time. You can use them as a ready-made trading strategy or as an additional filter in your trading system. In the settings you can set the offset for building levels.

The SuperRSI indicator is an advanced index of internal strength. The indicator shows not the relative strength of the trading instruments being compared, but the internal strength of a single instrument, therefore, it is the “Internal Strength Index”. This is an advanced form of the SuperRSI indicator. It converts the signal so that low-frequency components are delayed much more than high-frequency components. In general, the data of the last bar have more weight than previous data, like an exp

Volume indicators are used mainly in the stock market. Forex volumes are peculiar (teak). Why Forex can not track normal volumes? The fact is that this is an over-the-counter market. Consequently, to calculate the volume of purchases and sales by one instrument, practically, is not real. Many Forex traders at all abandon the volume indicators in their work. But for those who want to use them, there are some interesting tools, and one of them is VolumeVA . Volume Volume Volume indicator reflects

Indicator RangeChannel (RC) or, band channel indicator. The use of the indicator allows the trader to react in time for the price to go beyond the limits of the channel established for it. This corridor is built on the basis of the analysis of several candles, starting from the last one, as a result of which the extremes of the investigated interval are determined. They create the lines of the channel.
A sell signal occurs when the price touches the lower border and, conversely, the contact wit
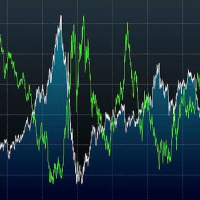
CorrelationUSD is a basic indicator, which is located on the chart. This tool allows you to monitor the relationship between assets, it reliably determines the patterns of quotation changes of one relative other asset. What is the indicator? All basic assets are interconnected, first of all, by a full complex of essential fundamental factors. For example, most currency pairs have a strong influence on measurements of each other’s quotes. Trends of this kind create macroeconomic news.

boss ! Trading opportunities can be used in any underlying asset, but experts in conducting tests prefer the currency pair USD / JPY.
The most favorable time for work is the European, American session.
When the blue arrow appears, a red option under the candle is acquired UP.
When the red arrow appears, the option DOWN is acquired. It is recommended to avoid trading during strong news releases
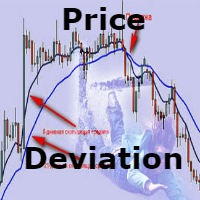
A very simple and intuitive indicator that shows the deviations from the moving average in percent. The default is a 50-day moving average. Just throw on the chart and the indicator build in a separate window under the graph.
This can be very convenient if your strategy implies a certain deviation in percentage of the moving average. It is not very convenient to calculate it manually. The method of averaging, the period of the moving average and at what prices to build all this is selected in t
FREE

Индикатор динамического уровня сопротивления и поддержки Moving Average. Визуально показывает момент прикосновение цены Bid ,
одной или трёх скользящих средних с заданными во входных параметрах свойствами. Создан для наглядности сигналов и оповещения состоявшегося пересечения (прикосновения) цены Bid и Moving Average. Скользящая средняя — это просто усредненное значение цены за выбранный период времени, он же таймфрейм (ТФ).
Именно поэтому скользящие используются на самых разнообразных ТФ,

This scanner is monitoring the entire market for trade opportunities for all symbols and for all time frames. You don't have to look to all the charts, for all symbols and for all time frames. This scanner will alert you on your computer, or on your mobile, when a trade opportunity has been found. You never have to miss a trade opportunity! This indicator is designed to scan all pairs and symbols, for all time frames, to find a cross of the MACD main and signal line. MACD Definition
The

Magneto Power MA - трендовый осциллятор. Основан на классическом индикаторе moving average, но при этом имеет нестандартный способ интерпретации. Здесь нет никаких фокусов с пересечениями мувингов, только гибридная работа MA и волатильности инструмента. При этом при должной настройке может составить конкуренцию дорогим и сложным аналогам. По гистограмме индикатора легко определить текущую тенденцию, а так же исчерпало себя движение цены или ещё нет. Настройки индикатора аналогичны классическому
FREE
Этот инструмент поможет собрать сигнальную индикатор без программирования, для Форекс или Бинарных опционов , на основе Ваших условий . И самое главное, создаст отдельный файл-исходник этого сигнального индикатора(.mql4). В условия для сигнала можно включить такие стандартные индикаторы, как: RSI, CCI, BolingerBands и др. Также Вы можете использовать до 3-х сторонних индикаторов-стрелок (с буферами), фильтр по направлению свечи, соотношение тела свечи к теням, фильтр по часу и минуте времени

Strategy Builder
L'indicatore Strategy Builder consente di creare strategie classiche e individuali senza caricare il grafico con un gran numero di indicatori e senza tracciare molti indicatori diversi per identificare il vero segnale. Strategy Builder visualizza segnali sotto forma di frecce su 30 indicatori standard, 23 indicatori che mostrano divergenza classica e nascosta, ricevendo segnali da livelli di Fibonacci, orizzontali, linee di tendenza e rettangoli. Con l'aiuto di questo indicato
Dawn In Trading indicator is a new ray of light in trading! This indicator has been tested on a real chart in real trading; All statistics about this indicator from real trading on the market! From the screenshots you can see the profitability of quality and the number of signals of this tool, you can also check it in the tester! As soon as a blue arrow appears, open a deal to increase, when a red arrow appears, open a deal to fall!
Signals appear when you open a new candle and do not redraw, t
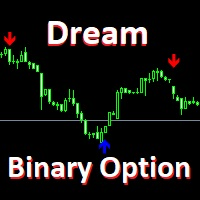
It is possible to trade on any basic asset, but the experts holding testing give preference to currency pair USD/JPY, EUR/USD. Optimum time for work is considered European, the American session.
with the standard settings which are already perfected to an ideal
At emergence of a blue arrow under a candle the option UP is acquired.
At emergence of a red arrow the option DOWN is acquired.
It should be noted one feature of the indicator: the signal is formed on the current bar, but it is worth

The indicator reads the current spread and displays it on the chart. The maximum value, the minimum value, the value at the time of opening the bar and the maximum value divided by 10 are displayed separately.
The indicator does not remember these values so the data will be lost if there is a change in the timeframe.
The indicator is useful for analyzing market volatility, comparing the spread between brokers and different types of accounts. By default: Red line - maximum spread; Green bar -
FREE
Il MetaTrader Market è un sito semplice e pratico dove gli sviluppatori possono vendere le loro applicazioni di trading.
Ti aiuteremo a pubblicare il tuo prodotto e ti spiegheremo come prepararne la descrizione per il Market. Tutte le applicazioni sul Market sono protette da crittografia e possono essere eseguite solo sul computer dell'acquirente. La copia illegale è impossibile.
Ti stai perdendo delle opportunità di trading:
- App di trading gratuite
- Oltre 8.000 segnali per il copy trading
- Notizie economiche per esplorare i mercati finanziari
Registrazione
Accedi
Se non hai un account, registrati
Consenti l'uso dei cookie per accedere al sito MQL5.com.
Abilita le impostazioni necessarie nel browser, altrimenti non sarà possibile accedere.