Retrouvez-nous sur Facebook ! Rejoignez notre page de fans
Utiliser les nouvelles fonctionnalités de MetaTrader 5
Historique du développement de MQL5.community
Les robots de trading et les indicateurs techniques les plus populaires, les signaux d'actualité, les programmes MQL5 prêts à l'emploi qui arrivent régulièrement dans la CodeBase et les thèmes les plus discutés dans le forum.
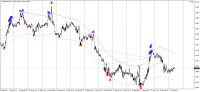
G channelG channel is a channel indicator with 3 lines- a middle line representing a central tendency and 2 Upper and Lower boundaries calculated based on the past values of same indicator. Its based on the paper "Recursive Bands - A New Indicator For Technical Analysis" by Alex Grover and is a code conversion from TradingView.
The channel breakout of Upper or Lower boundaries represent a new trend or trend continuation while narrowing of bands represents ranging or low volatility conditions. The channel can prove to be a good indicator of a trend direction and also a guide for trailing of stop loss.
It has only 2 variables.
Channel period - default set to 100.
Price type.
Candle Time End and SpreadThe indicator displays the current spread and the time till closing the bar (candlestick) at the same time.
Volume Profile + Range v6.0Volume Profile + Range v6.0 (former TPO). Distribution of deals by price levels at a given time interval. Displayed as a histogram.
SymbolInfo example script Enhancement with margin and leverage dataSymbolInfo example script lacks margin and leverage data wich are nowhere to be found explicitely in Metatrader, the trader must search thoroughly into the broker site in order to find them. The aim of this script is to provide a remedy to it from a standard tool.
Shved Supply and Demand - Multi Timeframe VersionThis is MQL5 version of Shved Supply and Demand indicator written by Shved and upgraded by eevviill7 from this link. Subsequently Mr. Behzad Movaghar added other functionalities to this link. This version of the Indicator contains the Code with an option to select the time frame of the Indicator other than that of the chart. For example if the chart is in 5M and the user want to see the support and Resistance levels of a particular chart pair at 15 M, is possible with this.