LineClose Alerts
- Indicateurs
- Version: 1.0
- Activations: 5

LineClose Alerts
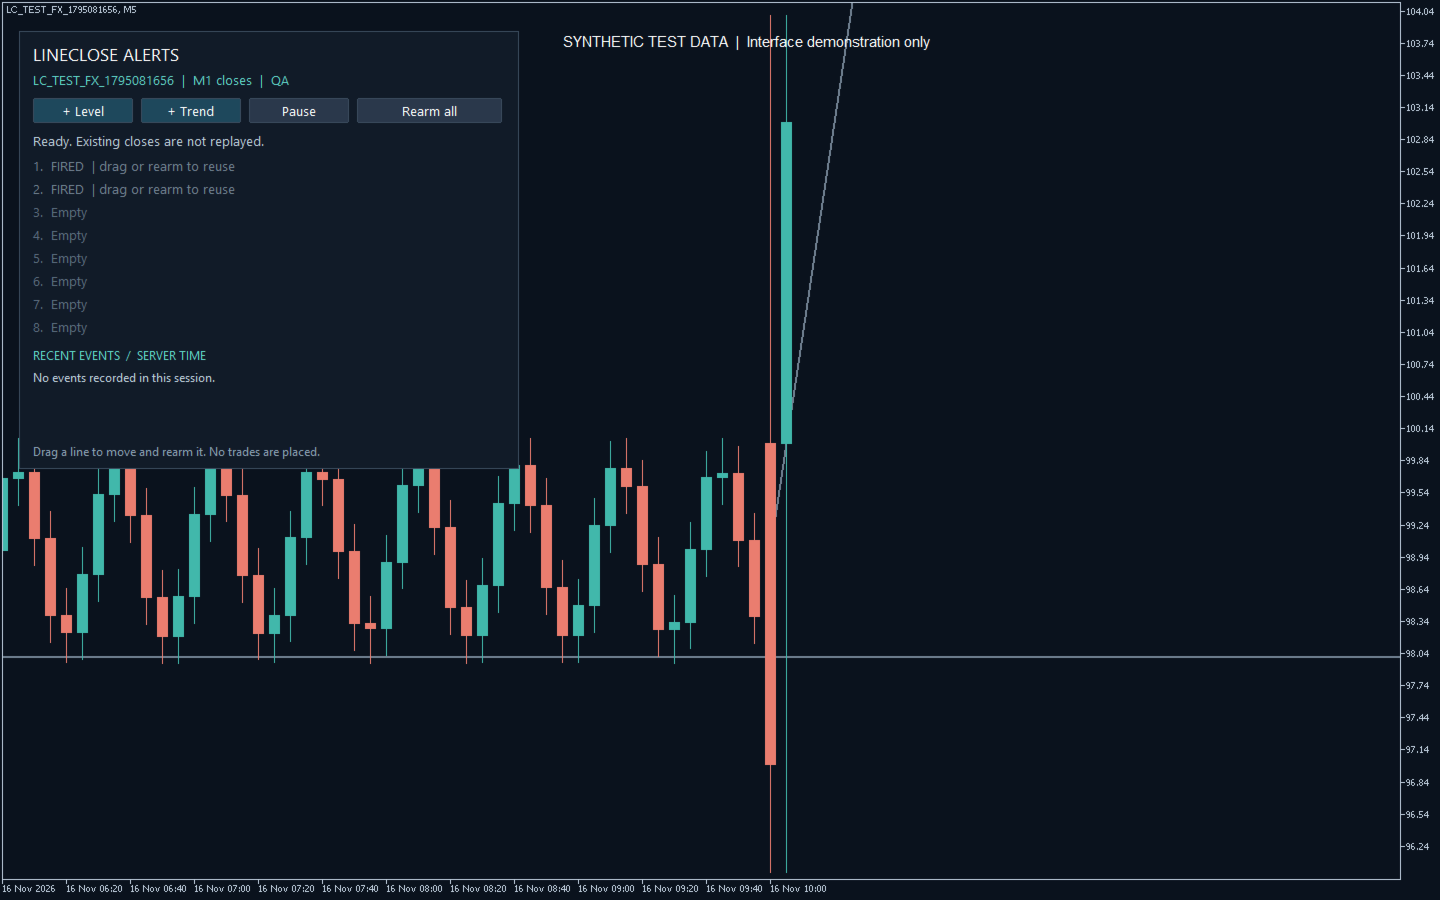
Watch your own price levels and trendlines without waiting in front of the chart. LineClose Alerts is a MetaTrader 5 indicator that records a crossing only after a candle closes on your selected alert timeframe.
Create a horizontal level or sloping trendline from the chart panel, drag it into place, and see whether it is armed or has already fired. The indicator does not place or manage trades.
What it does
- Monitor up to eight lines per instance, with a shared, explicit alert timeframe.
- Create horizontal levels and editable trendlines with two panel buttons.
- Choose crossings above, below, or in either direction. Set an optional confirmation distance in symbol points.
- Use one-shot alerts: a fired line stays inactive until you move it or select Rearm all.
- Pause monitoring, then resume from future candle closes.
- Keep the alert timeframe fixed while changing the displayed chart timeframe.
- Retain line geometry, fired state, and pause state when restarting the same terminal and chart.
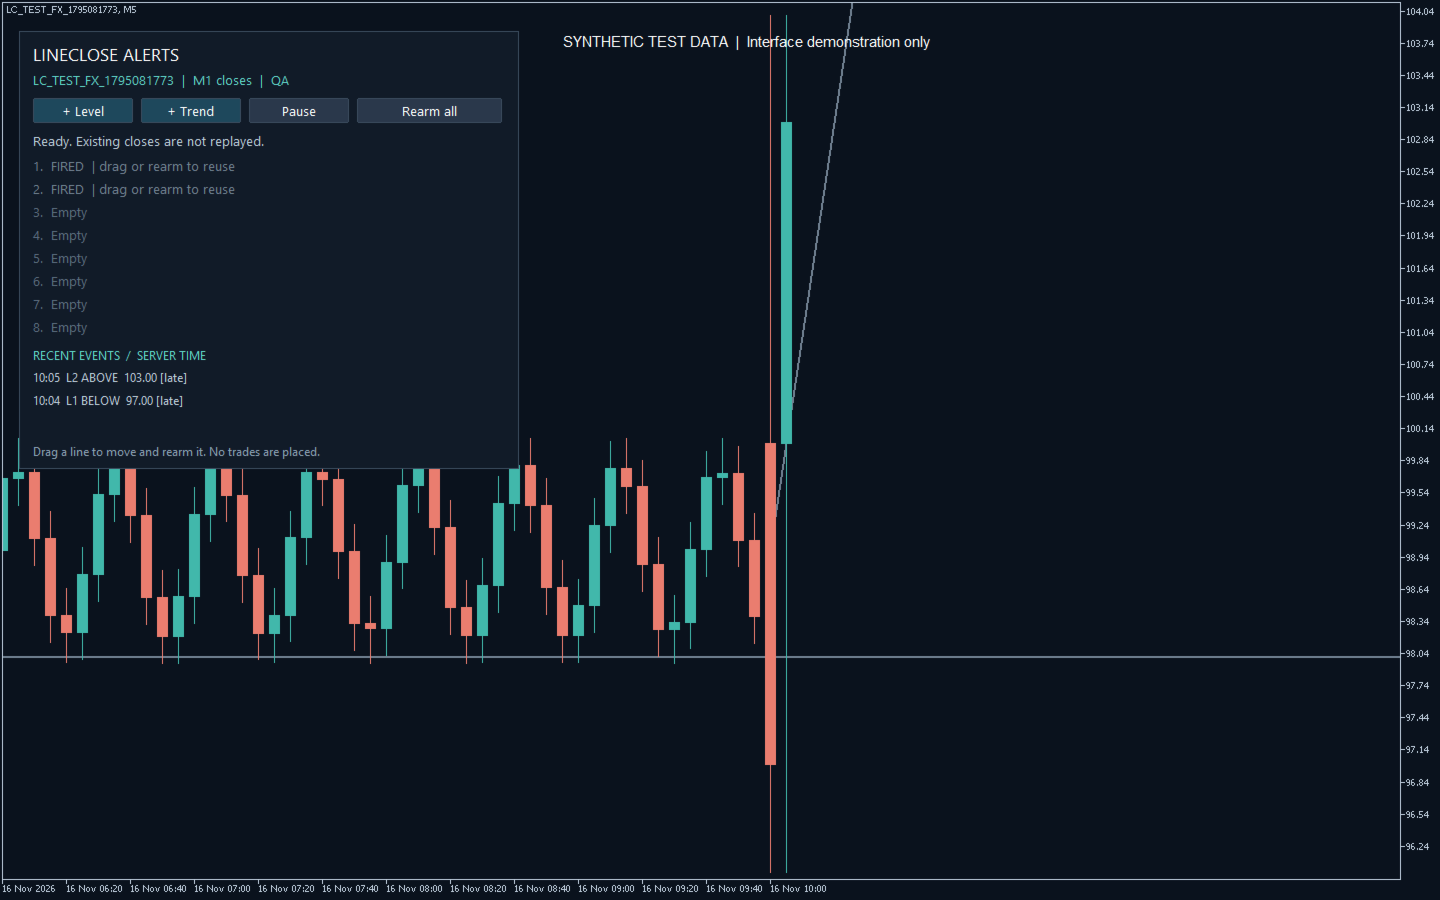
- See the three latest events from the current indicator session. Keep an optional local CSV record for longer-term review.
- Choose terminal popup, WAV sound, mobile push, and email notifications. Several crossings on one candle are combined into one push message.
How a crossing is defined
For an upward crossing, the previous completed candle must close at or below the line plus the confirmation distance, and the next completed candle must close strictly above that boundary. The downward rule is the reverse. Equality alone does not trigger an event. For a trendline, each candle is compared with the line value at that candle's close time. The line's left and right ray settings are respected.
The forming candle is never used as a confirmed close. A new candle must appear in the terminal's data before the preceding close can be checked. There is no automatic selection of profitable levels and no trading-performance claim.
Quick start
- Attach the indicator to a standard MT5 desktop chart with loaded history. Select an explicit AlertTimeframe; the default is H1.
- Click + Level or + Trend. Drag the selected line or its handles to the position you want to monitor. Creating lines requires at least twelve bars on the alert timeframe.
- Check the panel's symbol, timeframe, and ARMED state. The chosen alert timeframe applies to all lines in that instance.
- After an alert, move the line or press Rearm all to use it again. Use Pause when temporarily suspending alerts.
Settings and event record
MarginPoints is measured in the symbol's points, not pips. InstanceId uses 1–12 letters, numbers, or underscores. Use a distinct ID for each instance on the same chart; adjust PanelX and PanelY to avoid overlapping panels. FontSize accepts 8–14. ArmedColor and FiredColor control line and status colors.
Push and email require working configuration in the terminal's Notifications and Email settings. SoundFile must name an available WAV file in the terminal's Sounds folder. Delivery depends on terminal configuration, connectivity, and the receiving service; notification errors are written to the terminal log.
With WriteCSV enabled, event files are stored under File > Open Data Folder > MQL5 > Files > LineClose. They include symbol, alert timeframe, candle opening time, crossing direction, closing price, line value, and notification-request status. Times use the broker's server timezone. A recorded request does not prove delivery.
Operating limits
- The desktop terminal and chart must remain running and receive price data. The indicator itself does not run inside the MT5 mobile application.
- Existing historical crossings are not replayed on attachment, restart, or resume. If several bars are missed, only the newest completed pair is considered.
- Closes detected more than MaxNotificationDelaySeconds late are recorded without sending notifications. The default allowance is 120 seconds.
- At least three alert-timeframe bars are required for monitoring. MT5 must first initialize the underlying chart; a completely empty chart can prevent indicator initialization.
- Only lines created by this indicator are managed. Changing the chart symbol clears its old-symbol lines. Removing the indicator or applying another template removes its own lines and panel. Unrelated chart objects are left alone.
- Session events on the panel reset when the indicator reloads; the local CSV remains available. State persistence applies to the same terminal and chart, not to newly created charts or copied templates.
- Interactive chart controls are intended for normal desktop charts. Strategy Tester demos may not reproduce all manual interactions or send external notifications.
Illustrations use clearly labeled synthetic data to demonstrate the interface. They are not trading results or evidence of profitability.