Elsna Lines Mt4
- Indicateurs
- Version: 1.20

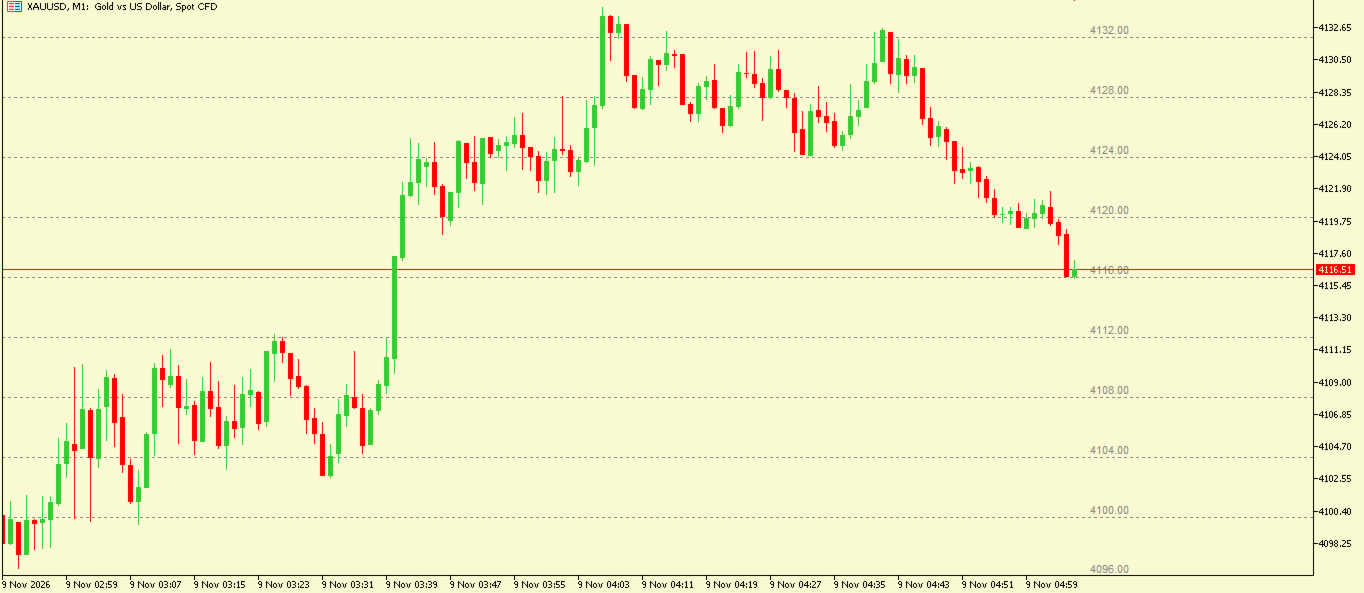
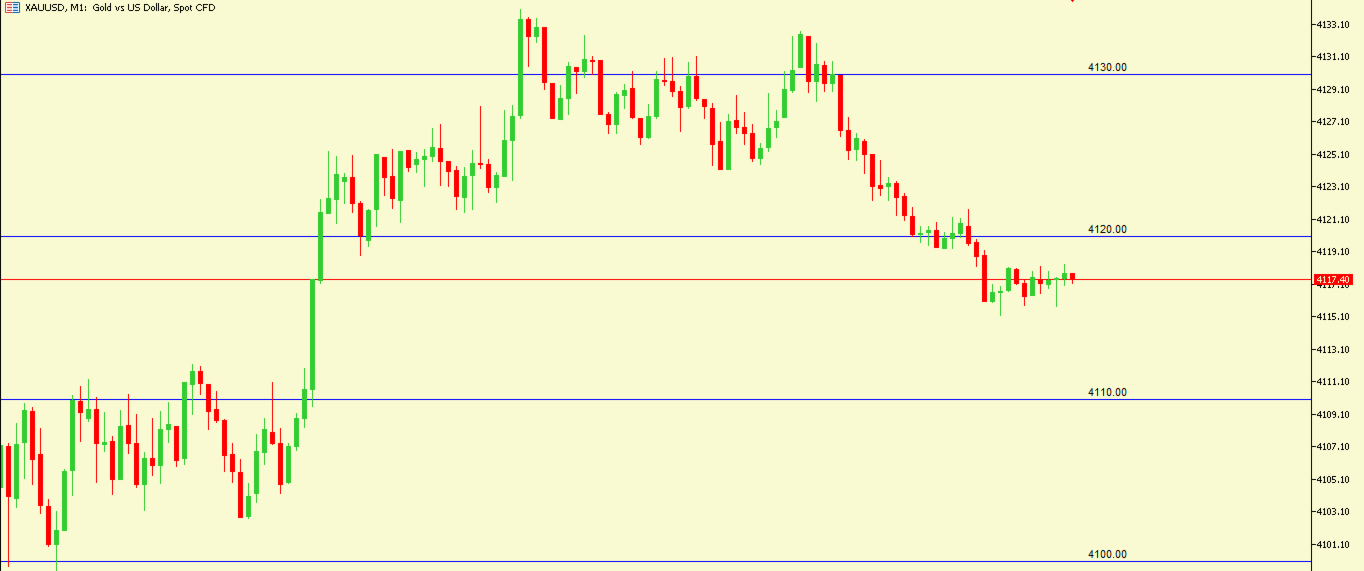
Elsna Horizontal Lines is a chart indicator. It draws a grid of evenly spaced horizontal price levels across your chart, so you can see fixed-distance levels at a glance. It’s useful for grid trading, spotting support and resistance zones, and measuring price moves in pips.
How it works
- You set the distance between lines in pips, and the indicator draws a line at every step across the visible price range.
- The pip size adjusts automatically for 3- and 5-digit brokers.
- The grid begins at a starting price you choose. If you leave it at 0, it starts automatically from just below the visible chart.
- It draws an extra screen’s worth of lines above and below what you can see, so scrolling a little doesn’t leave gaps.
- Once drawn, the grid stays put. It only redraws if you change the pips or starting price, scroll far enough to leave the drawn area, delete a line by hand, or (for trend lines) the projection runs out.
Settings
- StartPrice: the reference price for the first line (0 = automatic).
- GridStepPips: the distance between lines in pips (default 20).
- GridColor: the colour of the lines.
- LineType: full-width horizontal lines, or trend-line segments that run from the oldest bar to a set number of bars into the future.
- GridStyle: a named dropdown with Solid, Dash, Dot, Dash-Dot and Dash-Dot-Dot (default Dot).
- GridWidth: the line thickness. It only shows when the style is Solid.
- ProjectionBars: how far ahead trend-line segments extend.
- ShowPriceOnLine: true or false. When true, each line gets a small price label next to the latest bar.
- LabelFontSize and LabelColor: the size and colour of those price labels.
Behaviour
- The lines are not selectable, so you can’t drag them by accident, and they sit behind the candles.
- All grid lines and labels are removed when you take the indicator off the chart.