Rayner Teo
- Indicateurs
- Version: 7.10
- Activations: 5

Rayner Teo Ultimate Total — The Complete Pullback Trading System
Rayner Teo Ultimate Total is not just an indicator; it is a comprehensive mechanical trading system based on the popular price action and pullback trading methodology. This indicator removes emotions and chart "noise" by combining the three most critical components of professional trading: trend direction, area of value, and Price Action triggers.
Authorship & Concept (Disclaimer) The trading logic and rules embedded in this indicator are based on the public educational materials of the renowned trader Rayner Teo. I do not claim ownership of the core trading strategy itself. This product is a professional technical implementation of his system into a convenient "All-in-One" tool. By purchasing this indicator, you are paying for a ready-to-use tool that automates all the routine analysis: you no longer need to manually draw D1/H4 levels, calculate Stacked Moving Averages, or watch the charts 24/5 for engulfing patterns. The indicator does all the heavy lifting and sends you a ready-to-trade Alert.
How the System's Trading Logic Works (4 Steps to a Trade) The indicator generates a signal (an arrow) only when 4 strict conditions are met simultaneously:
1. Perfect Trend (Strict Trend Filter) The algorithm requires a classic alignment of Moving Averages (Stacked MAs).
-
For Buy setups: The fast 20 EMA must be above the 50 EMA, and the 50 EMA must be strictly above the long-term 200 EMA. The trend must be clearly established.
2. Area of Value Professionals do not buy at the absolute highs. The indicator waits for the crowd to run out of steam and for the price to make a Pullback into the "Area of Value" — the dynamic space between the 20 EMA and 50 EMA.
3. Confluence Zones & Levels This is the core advantage of the system! The indicator automatically plots historical support and resistance levels from higher timeframes (D1 and H4).
-
Smart Filter: The algorithm strictly prohibits buying right into a strong resistance level. A Buy signal will only appear if the pullback occurred at a support level (or a broken resistance acting as a new support).
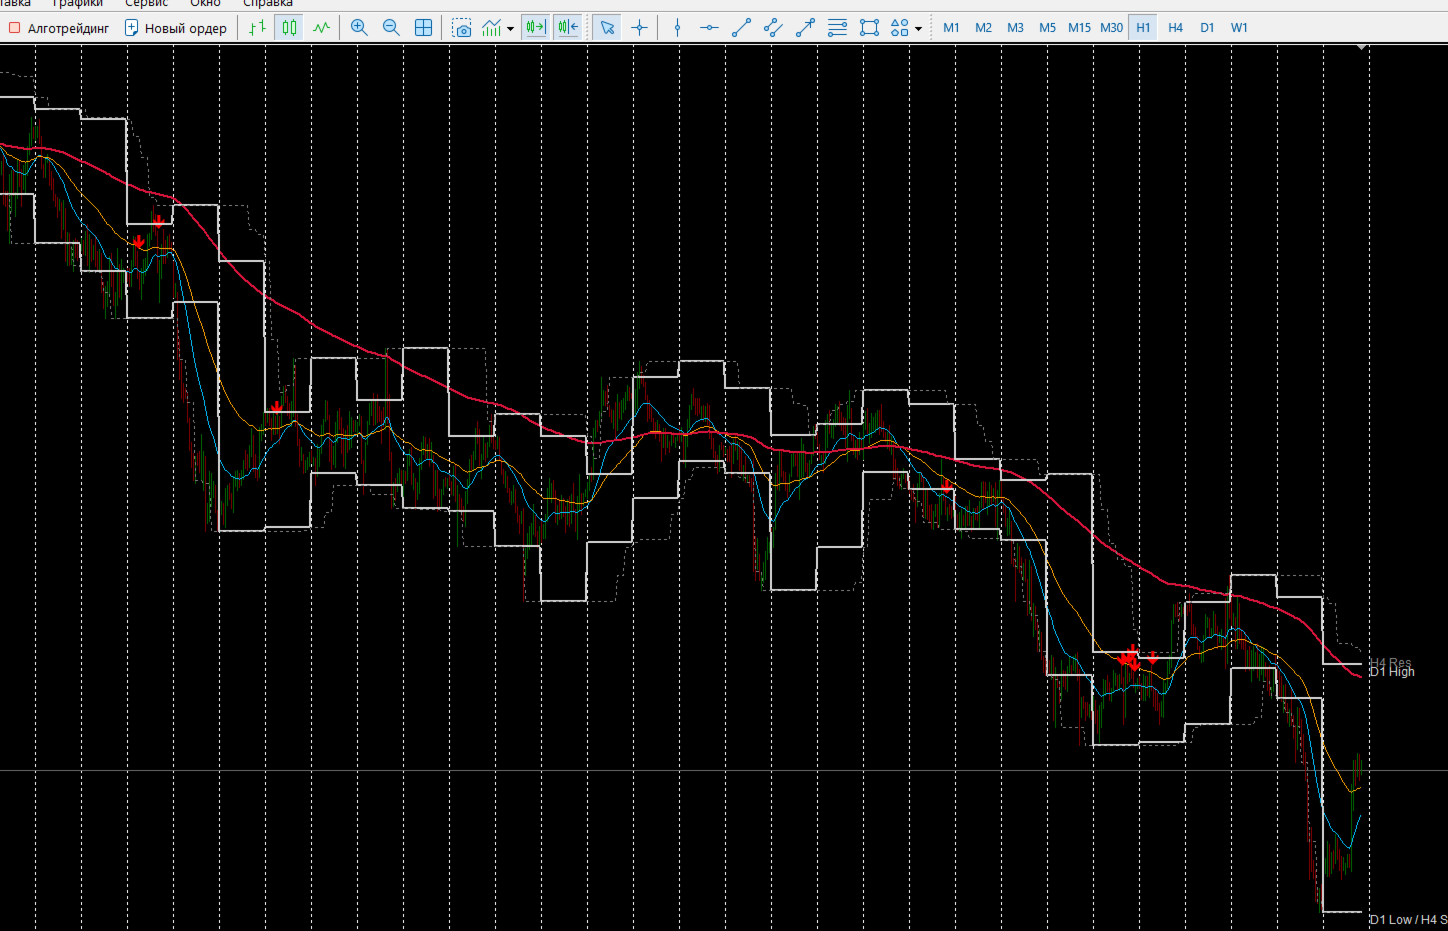
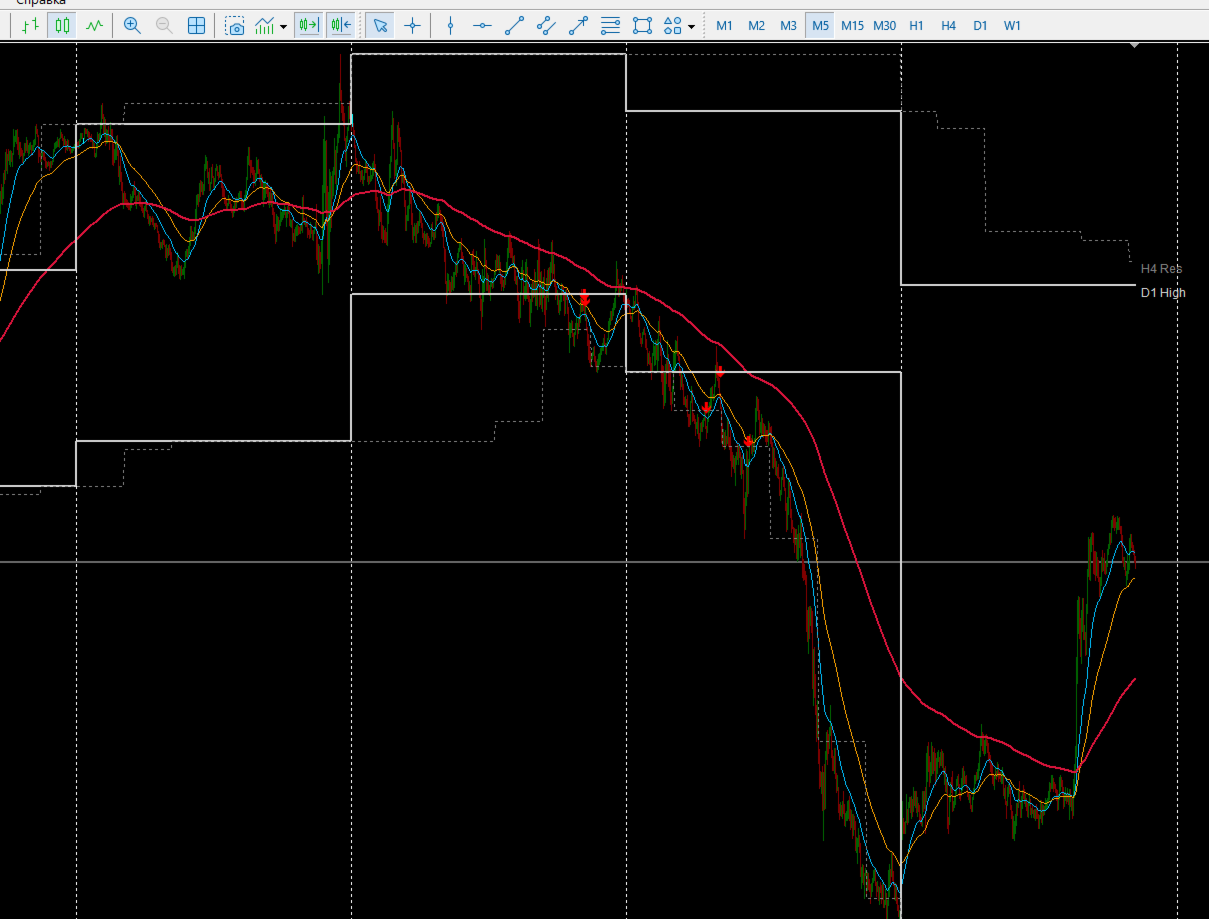
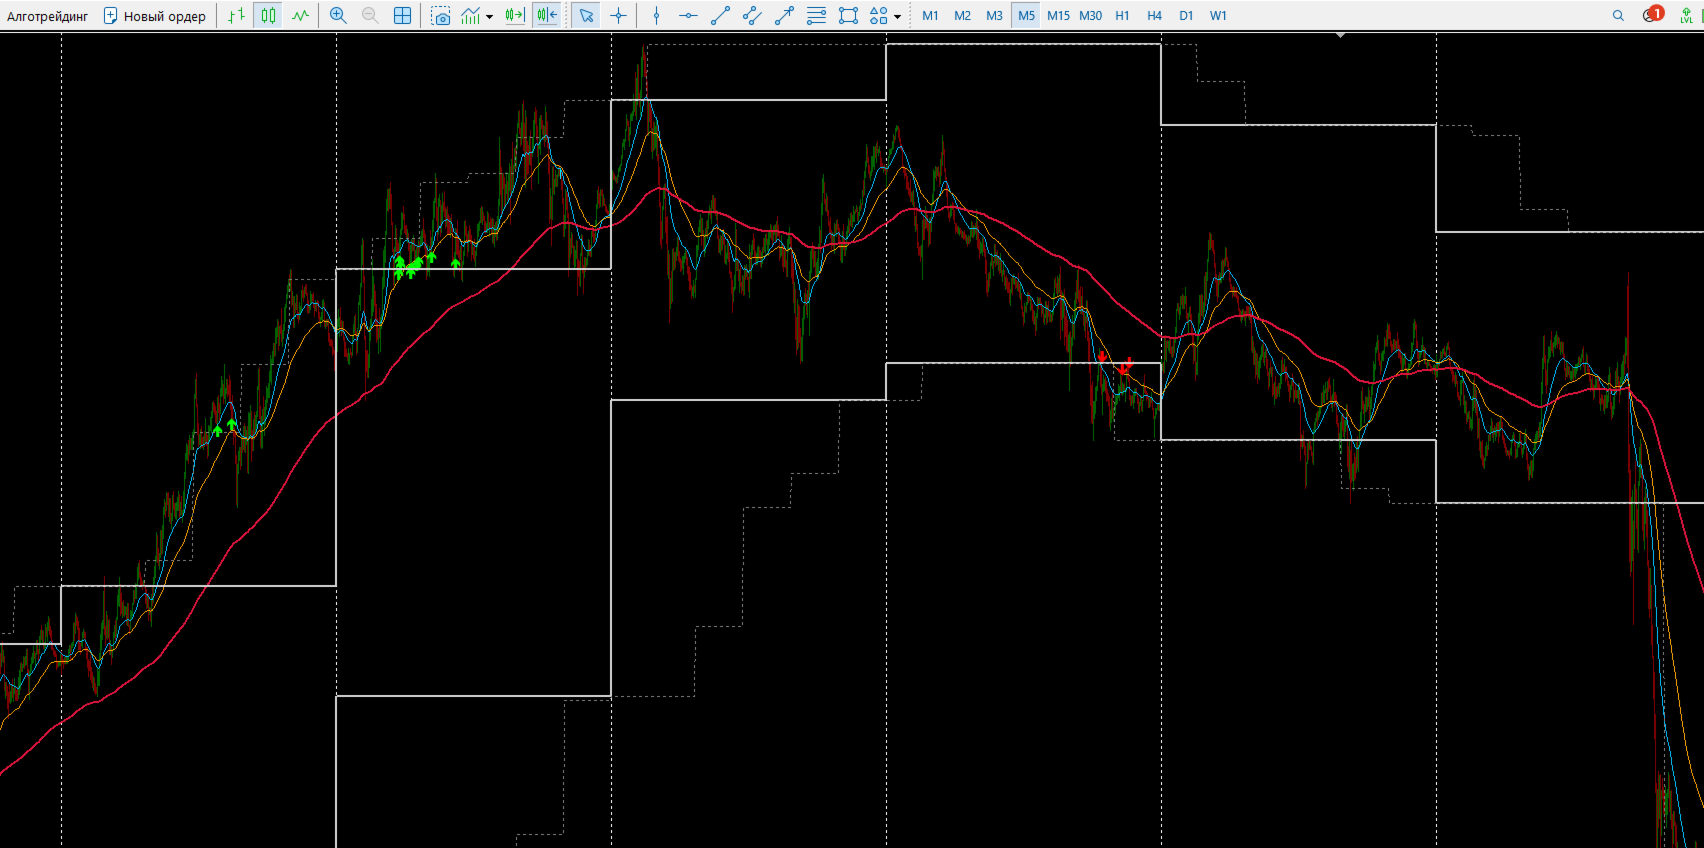
4. Entry Trigger (Price Action) When the price is trending, drops into the Area of Value, and rests on D1/H4 support, the indicator waits for final confirmation. Price Action patterns act as the trigger — specifically Pin Bars and Engulfing candles. As soon as the reversal candle closes, you receive an arrow on the chart, a pop-up Alert, and a Push notification to your smartphone.
Key Advantages of the Algorithm
-
100% Strict Non-Repaint: D1 and H4 levels are plotted using a true step-by-step historical algorithm. The indicator never looks into the future. Signals in the Strategy Tester will match live market performance 100%!
-
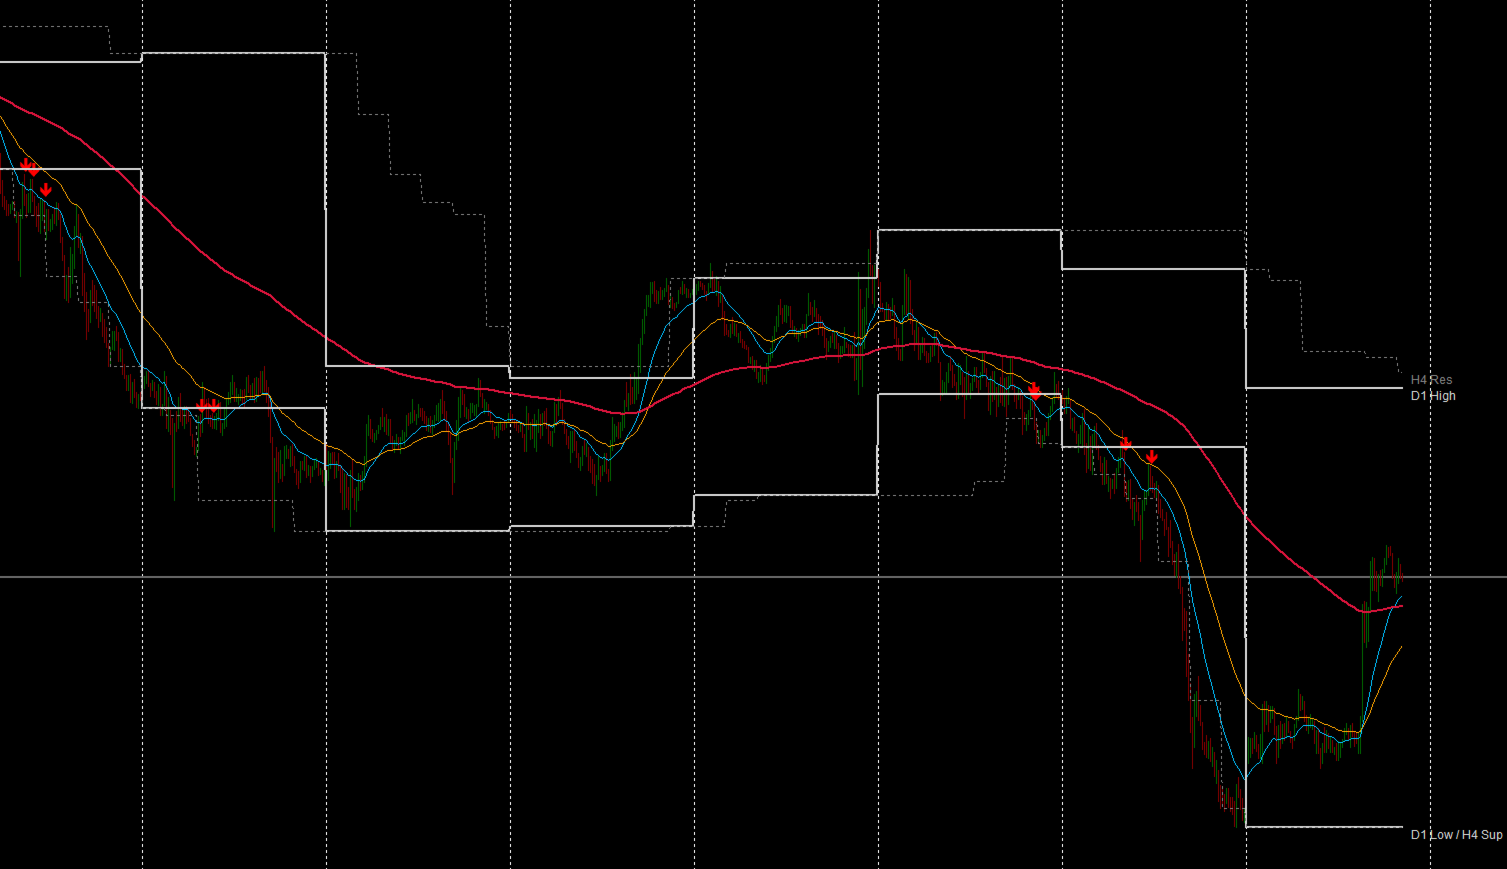
Dynamic Text Labels (UI/UX): Each higher timeframe line is automatically labeled with dynamic text that follows the current price (e.g., D1 Low / H4 Sup ), keeping your charts clean and readable.
-
False Breakout Protection: Signals are generated and locked strictly on candle close (Close Price). They will not blink or vanish.
-
Volume Filter (Optional): The ability to require higher-than-average tick volume specifically on the reversal signal candle for added confirmation.
Trading Rules (Instructions)
-
Buy (Long Position): Wait for a green UP arrow. This means the trend is up, the price has pulled back to the 20/50 EMA, touched H4/D1 support, and formed a bullish setup. Place your Stop Loss below the local swing low.
-
Sell (Short Position): Wait for a red DOWN arrow. The trend is down, the price has rallied to the 20/50 EMA, touched H4/D1 resistance, and formed a bearish pattern. Place your Stop Loss above the local swing high.