TickVolumeHistogram
- Indicateurs
- Version: 1.0

-
TickVolumeHistogram
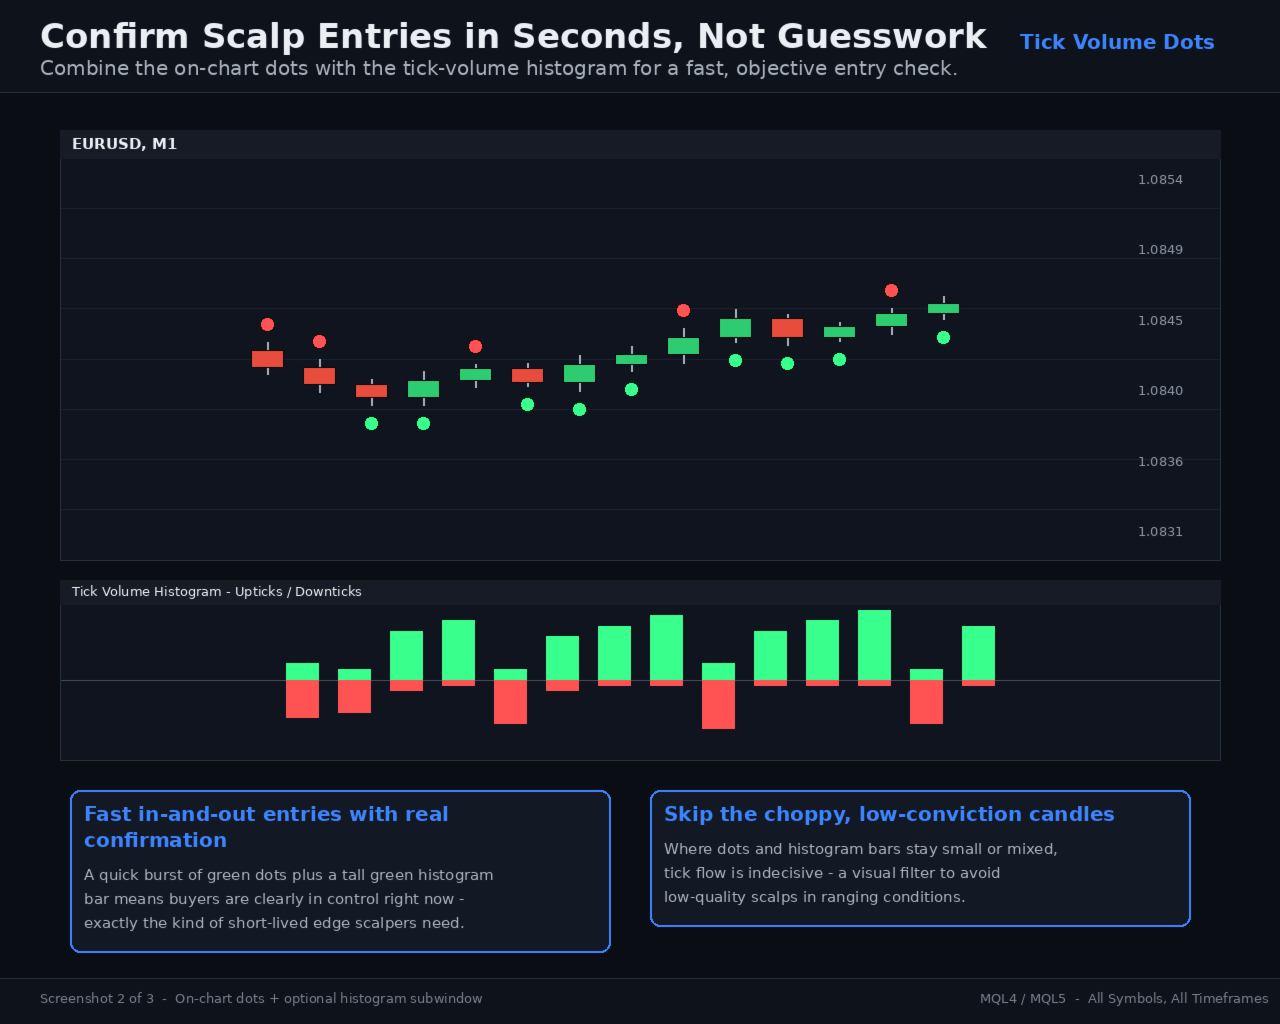
"Read Real Order Flow, Not Just Candle Color" — shows a run of red dots quietly warning of a reversal before the candles confirm it, then the flip to green dots at the exact turn. - "Confirm Scalp Entries in Seconds" — pairs the on-chart dots with the histogram subwindow, showing how a burst of green dots + a tall green bar = high-conviction entry, versus choppy mixed signals to skip.
- "Catch Exhaustion Before It Traps Your Trade" — a red dot printing on a green candle flags sellers quietly winning the tick fight even while price still closes up — an early exhaustion warning.
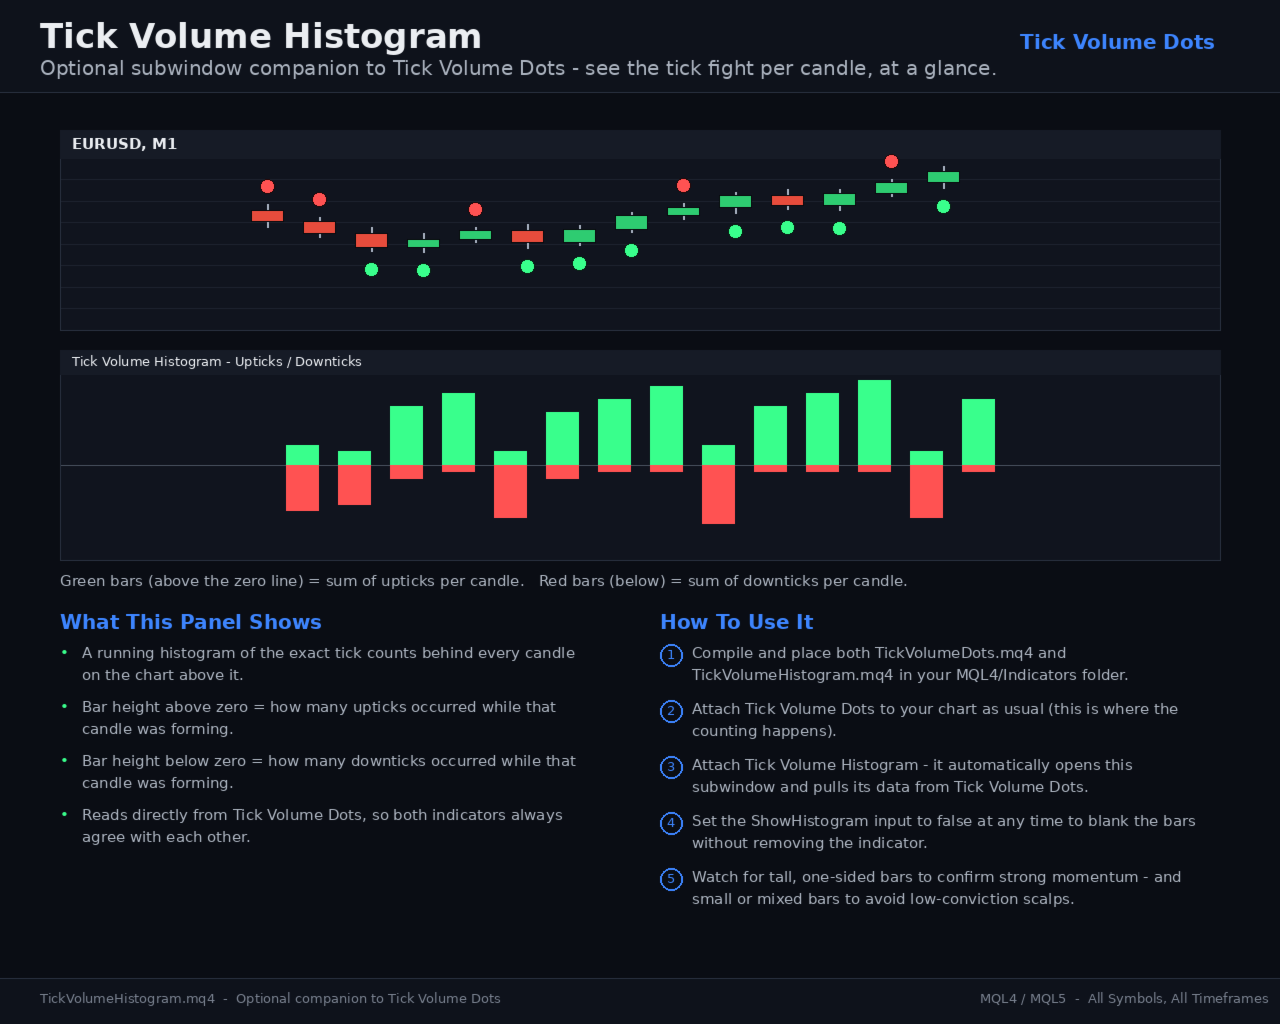
- A small context chart on top (candles + dots) so the histogram makes visual sense
- The histogram itself, labeled green = uptick sum, red = downtick sum
- "What This Panel Shows" — a 4-point description
- Add TICK VOLUM DOTES FOR ACCURACY.
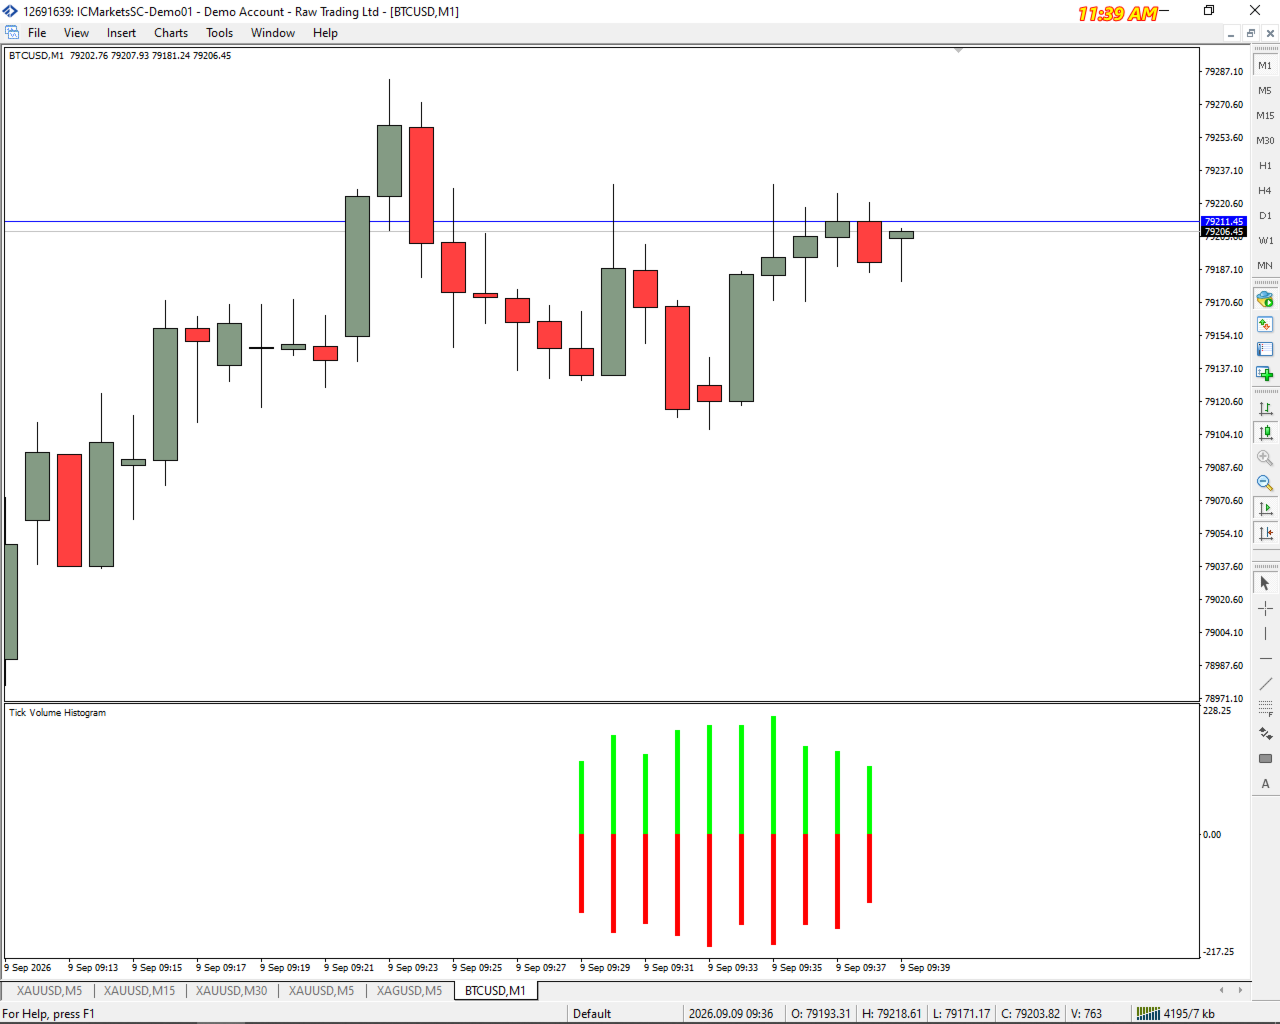
- subwindow histogram (Show/Hide) displays the summed upticks (green) and downticks (red) per candle, similar to a classic tick-volume panel.
- Lightweight, non-repainting on closed candles, works on any symbol and timeframe