Final Cert

Easy-to-Read and Easy-to-Use Entry Indicator — How to Interpret It

Brazilian Market-Win

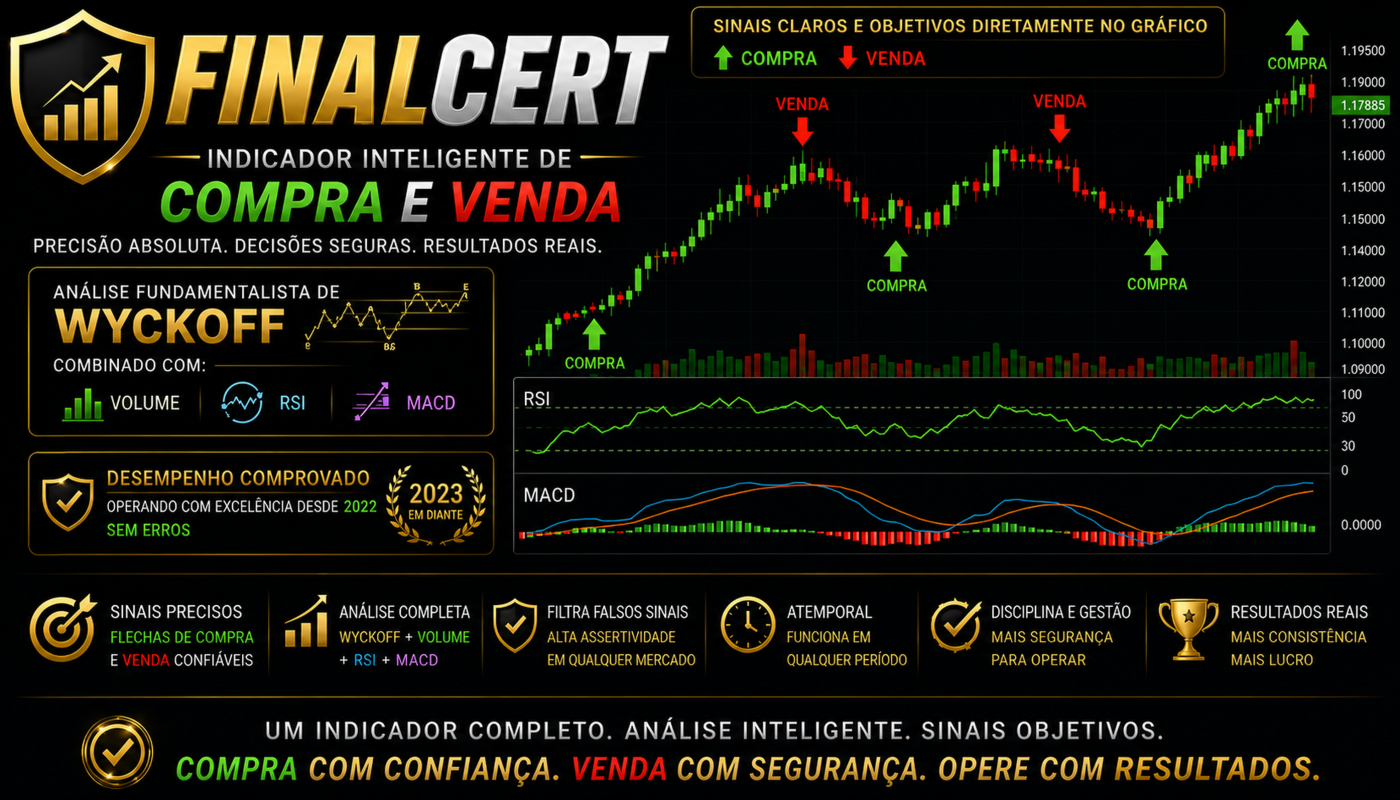
This indicator identifies Wyckoff-based reversal entry points. Instead of triggering on every breakout, it waits for the classic trap and only signals after confirmation. For this reason, it is selective and generates relatively few signals.

What it looks for:

Buy (Spring): The price breaks below a previous low but closes back above that level and above the previous close, confirming that the downside breakout has failed. The green arrow appears when this is also accompanied by exhaustion—declining volume compared with the previous signal—low RSI and momentum divergence.

Sell (Upthrust/UTAD): The price breaks above a previous high but closes back below it, confirming that the upside breakout has failed. The red arrow appears using the same logic in reverse: declining volume, high RSI and momentum divergence.

Filters that make it selective:

  • Volume quality (relative VDI): Signals are validated only when volume is within the continuation range or shows a genuine spike.
  • Minimum spacing between signals and daily reset: Prevents repeated signals during the same price movement.
  • Trading-time window (until 4:00 p.m.): Avoids signals near the end of the trading session.

How to use it:

The arrow indicates the location and direction of a higher-conviction entry. Confirm the signal using the broader market context—market structure, VWAP and trend—and manage the exit according to your own targets.

This is a selective, confirmation-based entry trigger—not a complete automated trading system.

Best performance on 5-minute charts.

Plus de l'auteur
Institucional Trade
Marcelo Alejandro Arrojo
How to Use the Indicator (Best performance: 5 minutes) It displays two signals on the chart: BUY , in green: price pierced the low of the last 4 candles and closed back above it. This is a false breakdown that trapped the sellers → possible bullish reversal. SELL , in red: price pierced the high of the last 4 candles and closed back below it. This is a false breakout that trapped the buyers → possible bearish reversal. A signal only appears when three conditions line up: the Wyckoff pattern (a f
EstocasticoPreciso
Marcelo Alejandro Arrojo
Indicad The ESTOCASTICOPRECISO indicator — how to interpret it: It is a binary momentum signal derived from a low-latency price filter. Instead of a graduated scale, it assumes one of two states: it stays at the top while the upward movement has strength and at the bottom while the downward movement dominates. The 0.8 and 0.2 lines serve merely as visual references; in practice, the line remains at the top or bottom, crossing the middle quickly only when momentum shifts. How to read it: – At the
Predictor 2
Marcelo Alejandro Arrojo
Para Mercado Brasilero-Periodo de 1 minito(M1)-Win Como utilizar(Somente utilizar em Periodo de 1 Minuto ) Primeiro tempo, como um copiloto que primeiro observa e só então se manifesta. Primeiro tempo — define o viés. Quando a pressão compradora ou vendedora e o volume se alinham, o indicador sinaliza OK VERDE (viés de compra) ou OK VERMELHO (viés de venda) e desenha uma área de controle ao redor do preço. Isso ainda NÃO é uma entrada: é o aviso de que algo está se formando, e em qual direção. S
Poupa Loss
Marcelo Alejandro Arrojo
Indicador SaveMoney — como interpretar Tradutor do Wyckoff atemporal: lê a condição do mercado em barras coloridas e funciona em diferentes períodos (1m, 5m, 15m). Atua no WIN, USA500, NIKKEI e outros índices; em ativos de pouco volume, rende melhor acima de 1m. Use em painel separado, abaixo do gráfico de preços. Os limites superior e inferior já vêm calibrados (faixa de continuidade entre 0,6 e 1) e podem ser ajustados via input. Sem posição aberta: – Verde (entre os limites): continuidade. Am
Compra Trend
Marcelo Alejandro Arrojo
Como Utilizar(Para Mercado Brasilero-Periodo de 15 Minutos -Win): Tendência Compradora foi desenvolvido para ajudar o trader a identificar momentos em que uma tendência de alta possui maior probabilidade de continuar.O indicador trabalha no gráfico de 15 minutos e analisa diversos fatores ao mesmo tempo, como tendência principal, comportamento do preço, volume financeiro e regiões importantes do mercado. Quando todos os critérios são atendidos, a mensagem "Tendência Altista" aparece no gráfico i
Venda Trend
Marcelo Alejandro Arrojo
Tendência Vendedora(Para Mercado Brasilero em M15-WIN)  foi desenvolvido para ajudar traders a identificar momentos em que uma tendência de baixa possui maior probabilidade de continuar. O indicador trabalha analisando diversos fatores importantes do mercado, como tendência principal, estrutura dos preços, volume financeiro e comportamento institucional. Quando todos os critérios são confirmados, a mensagem "Tendência Venda" aparece no gráfico indicando uma possível oportunidade de venda. Como i
Score Master
Marcelo Alejandro Arrojo
Indicador Z-Score(Para Mercado Brasilero M5 -WIN) — Com marcação de pontos de COMPRA e VENDA. Mede, em desvios-padrão, o quanto o preço de fechamento se afastou da sua média de referência (Hull MA). Fórmula: Z = (Fechamento - Média Hull) / Desvio-padrão. Um Z de +2 significa dois desvios acima da média; -2, dois abaixo. Leitura rápida: a linha zero é o equilíbrio (preço sobre sua média). Verde (Z>0) indica preço acima da média; vermelho (Z<0), abaixo. Quanto mais longe do zero, mais esticado. O
Filtrer:
Aucun avis
Répondre à l'avis