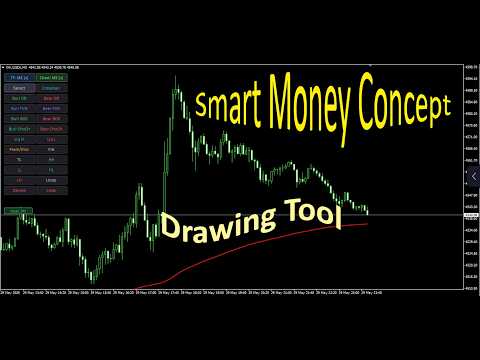
Drawing tool for SMC white background
- Utilitaires
- Version: 1.9
- Activations: 5

SMC Drawing Tool is a professional technical analysis indicator for MetaTrader 5, designed to enhance the Smart Money Concepts (SMC) trading methodology. It deeply integrates a comprehensive suite of drawing tools with an intelligent labeling system and includes advanced features such as multi-timeframe display and chart synchronization. This tool is dedicated to streamlining a trader's markup process, enabling the quick and precise identification of key market structures and liquidity zones.
Product Features
Core Drawing and Labeling System
The indicator provides a set of core drawing tools, including the Trendline for plotting trends and the Rectangle , which is ideal for marking Order Blocks (OB) and Fair Value Gaps (FVG). It also integrates Fibonacci Retracement to aid in identifying potential reversal zones.
To complement the drawings, the tool features a smart labeling system. You can easily mark critical market structure points like Change of Character (CHoCH), Break of Structure (BOS), and Liquidity (Liq). Significant Swing Highs/Lows by marking HH, HL, LL, and LH.
Advanced Analytical Capabilities
To enhance analytical efficiency, the indicator is equipped with several advanced capabilities. The Price Snap feature ) allows drawing objects to automatically align with key candle prices (High and Low). The Multi-Timeframe Display ensures that analytical objects from higher timeframe charts are automatically rendered on all lower timeframes, maintaining analytical consistency. Chart Synchronization provides real-time syncing of all objects across multiple charts of the same trading symbol. Finally, the Timeframe Linkage function can bind higher and lower timeframe charts for seamless analytical switching.
Customization and Usability
We prioritize user experience and personalization. Users can directly drawing allowing you to create a workflow that best suits your needs. The indicator also offers complete style configuration options, including colors, line widths, and font sizes for all drawing objects. You can even modify the chart's appearance directly through the indicator parameters.