Multiple Timeframe VWAP indicator

Tâche terminée

Temps d'exécution 5 jours
Commentaires de l'employé
He know what he exactly wants and gives you comfort during job to lead a very good result. You love to code for him. thanks him
Commentaires du client
Awesome developer who will evaluate the logic of your program, point out any potential glance, and even be very patient to solve your code bug issues. A high-quality developer who I recommended.

Spécifications

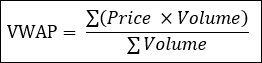
I would like to create a volume weight average price (VWAP) indicator for multiple timeframe. My standard is the VWAP is calculated either starting with daily, weekly, monthly, quarterly or yearly basic. Below is the general formula for the VWAP. Formula from the past developer on the VWAP can be share as well.


To simplify my requirement, I will put it into bullets points 

  1. The VWAP indicators will reset based on daily basic ( Default - can set to make changes). When new days reached, the VWAP will begin from 0 again.
  2. I need an inputs that can allow me the period of resetting, just use period timeframe, where i can choose for it to reset on daily, weekly, monthly, quarterly or yearly basic.
    1. To ease the change after the putting into the chart, create 5 button where i can easily navigate between desire VWAP period on the chart. Put the button at the bottom left of the chart with the follow shortcut name. ( Font size 10 - Customisable)
    2. D = Daily (reset every day)
    3. W = Weekly  (reset every week)
    4. M = Monthly  (reset every month)
    5. Q = Quarterly (reset every quarter - 1-3, 4-6, 7-9, 10-12)
    6. Y = Yearly (reset every year)
  3. Follow the math equation above to calculate the center or VWAP lines (Formula will given)
    1. When VVWAP is decreasing = Red Colour
    2. When VVWAP is increasing = Lime Colour
    3. vwap_style = STYLE_SOLID
    4. vwap_width = 2
    5. Volume calculation is based on Tick volume
    6. Input: Price data based on current price mode (Close, Median, Typical etc. - Standard price mode)
  4. The standard deviation, SD bands (upside and downside) is measured using the  standard deviation of the price to the VWAP (1.0, 2.0)
    1. Past developer code will be share
    2. By default I only need 1.0 and 2.0 SD. But give it 2 more float input so i can key in whenever i need it. Meaning, there will be 4 level of SD
      1. 0.5 - No show
      2. 1.0 - Show
      3. 1.5 - No show
      4. 2.0 - Show
      5. I can choose whenever want to show the 0.5 or 1.5 or not. Also, I can make change of the number maybe 0.5 -> 0.75 (so make it into setting that i can change later)
    3. Allow me to change the style of the SD style, and this is the default
      1. band_color = clrWhite
      2. band_style = STYLE_DASHDOT
      3. band_width = 1
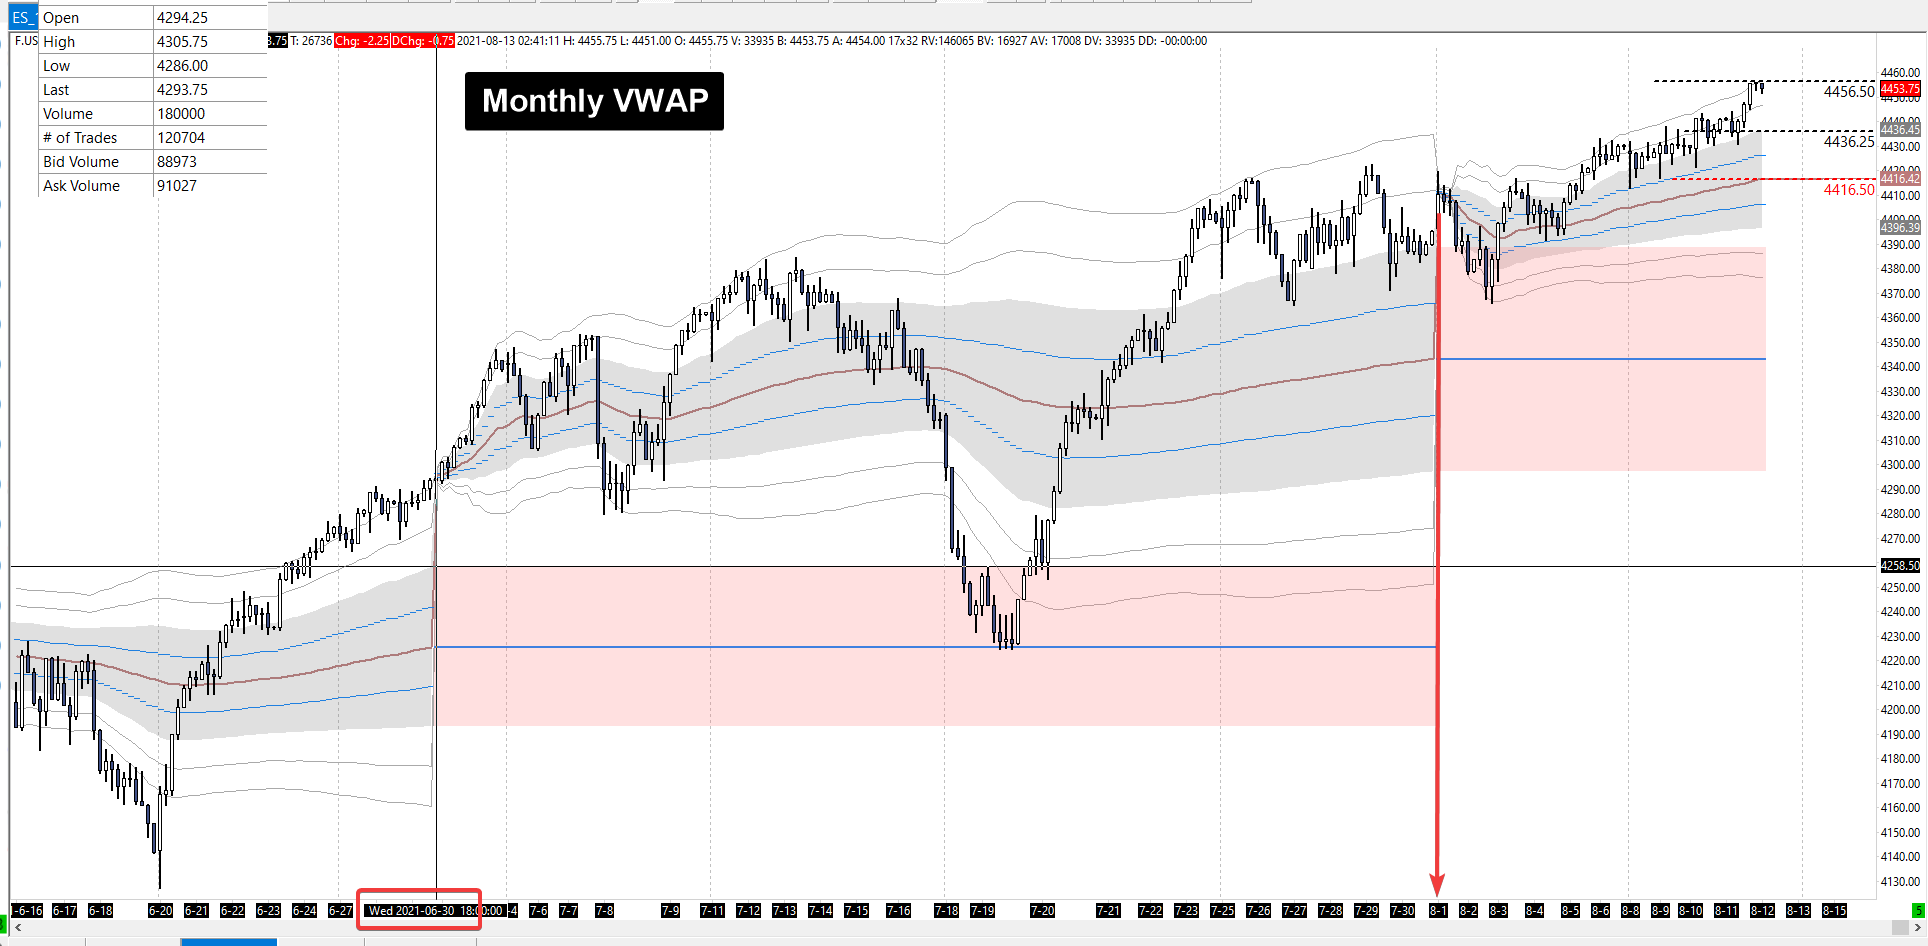
  5. A rectangle box will plot from previous VWAP1.0 SD and all the way to the future next VWAP reset period. Below are the design (all the settings below make available in the input section)
    1. style=STYLE_SOLID
    2. width=1
    3. fill=true
    4. selection=false
    5. Colour will different from each VWAP timeframe
      1. D = clrNavy
      2. W = clrDarkGoldenrod
      3. M = clrMaroon
      4. Q = clrIndigo
      5. Y = clrMidnightBlue
    6. A horizontal Solid trend line will plot from the previous VWAP value. The style just follow back the existing VWAP colour.
  6. Input: Period count - For the case where the calculation of VWAP on entire chart will be time consuming, by default let it only count on past 30 daysof VWAP. The '30' (count in day) is the inputs I can define later
    1. Suppose at least 1 VWAP period should plot out
  7. If the data is insufficient for higher period (such as Quarter or Yearly) display the message at TOP RIGHT prompt user to go M1 chart and down load the data until XX date.
    1. Note the highlighted is the input
    2. M1 = data source using now
    3. XX date = if is yearly then need to download the data all the way back to 01.01.2021
    4. I will be very appreciate if the developer knows the way to automatically download the data for the user.
  8. When changing VWAP timeframe option, previous VWAP object should be clear.
  9. When new candle generated the VWAP calculations MUST UPDATE CORRECTLY


Expected Outcome:
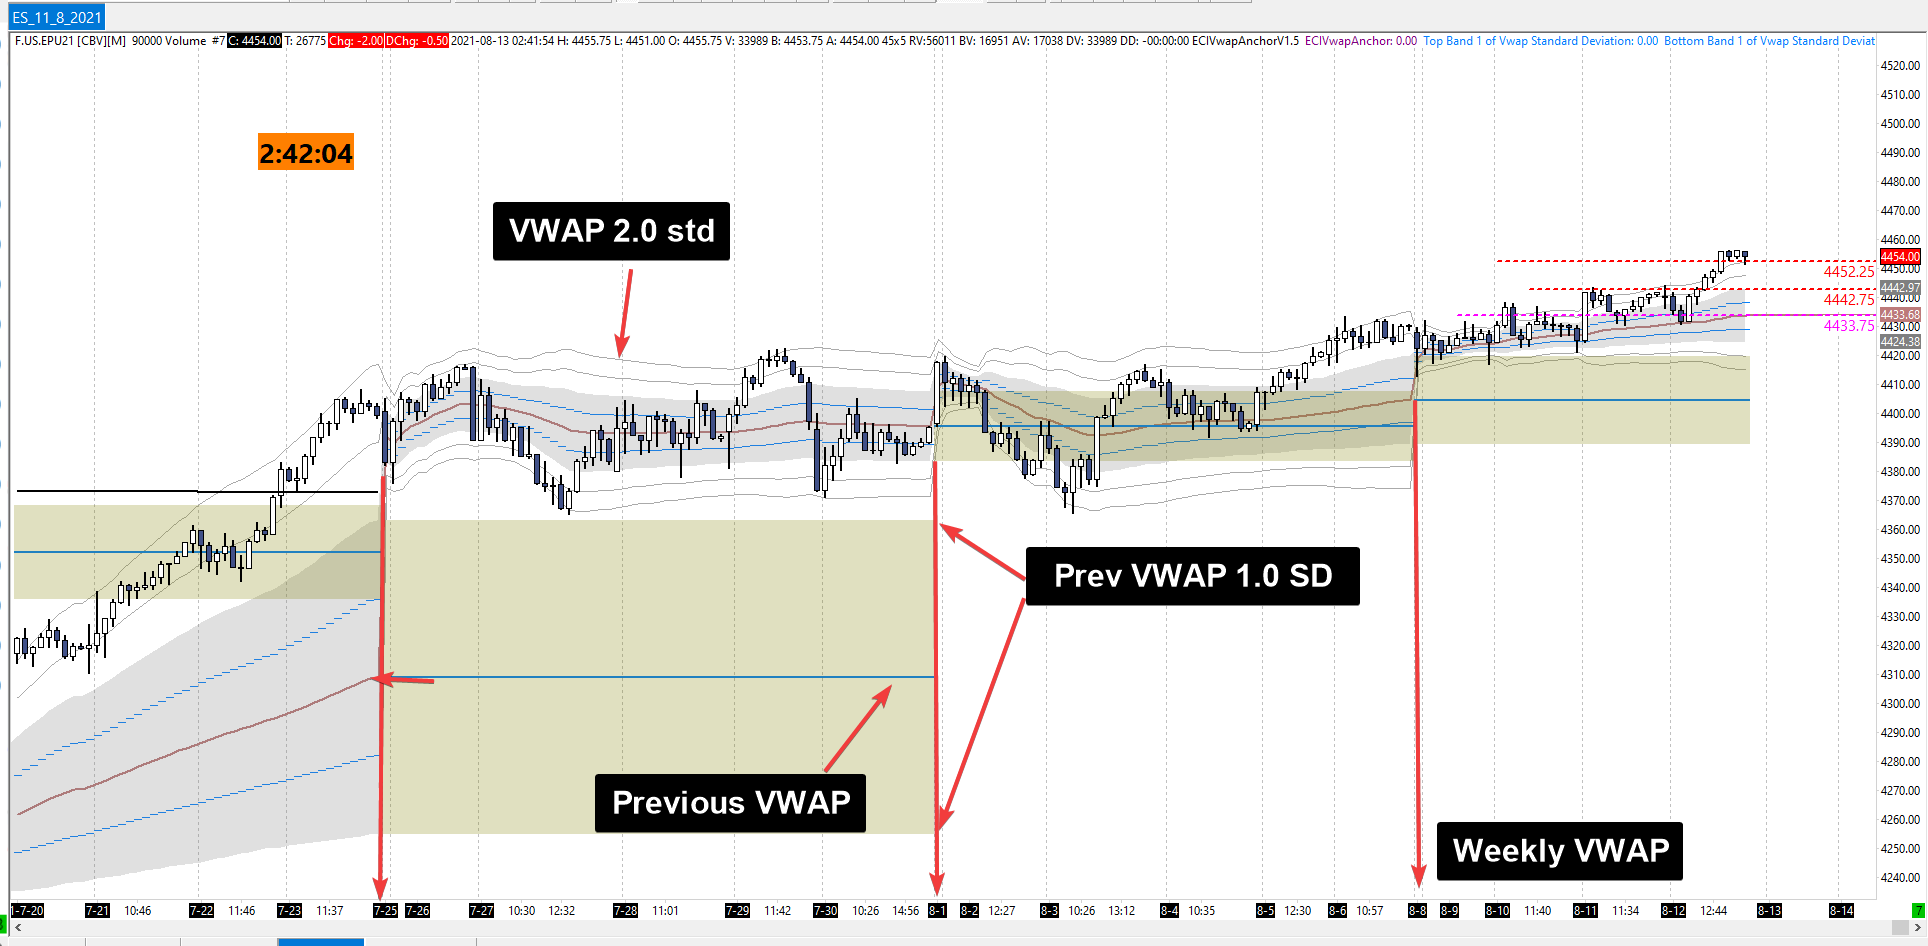


Note: The graphic display i know may be a little bit different but similar result is needed.


Question:

  1. Is it possible to have multiple timeframe VWAP display all together?
  2. Is there any thing that is unclear?

Send me an answer so that I know you did read through and understand the requirement


I do not accept indicator code that is generated.


Highly welcome developer that is communicative and experience in MQL indicator. Please communicate with me on your experience so I know if you are suitable in working with this project or not.

Source code is needed by the end of the project.


Répondu

1
Développeur 1
Évaluation
(115)
Projets
129
18%
Arbitrage
11
27% / 55%
En retard
4
3%
Gratuit
2
Développeur 2
Évaluation
(132)
Projets
178
39%
Arbitrage
4
25% / 50%
En retard
14
8%
Gratuit
3
Développeur 3
Évaluation
(70)
Projets
91
25%
Arbitrage
26
19% / 54%
En retard
25
27%
Gratuit
4
Développeur 4
Évaluation
(21)
Projets
24
17%
Arbitrage
15
20% / 40%
En retard
6
25%
Gratuit
5
Développeur 5
Évaluation
(589)
Projets
1070
50%
Arbitrage
39
28% / 41%
En retard
49
5%
Gratuit
Publié : 1 article, 8 codes
6
Développeur 6
Évaluation
(71)
Projets
97
43%
Arbitrage
2
50% / 0%
En retard
2
2%
Gratuit
7
Développeur 7
Évaluation
(45)
Projets
91
13%
Arbitrage
34
26% / 59%
En retard
37
41%
Gratuit
8
Développeur 8
Évaluation
(574)
Projets
945
47%
Arbitrage
309
58% / 27%
En retard
125
13%
Gratuit
9
Développeur 9
Évaluation
(69)
Projets
146
34%
Arbitrage
13
8% / 62%
En retard
26
18%
Gratuit
Publié : 6 codes
Commandes similaires
Fibonacci Técnicas... Estudos Fibonacci de expansão e retração. Estudos técnicos... Linhas de tendencia, resistência, suporte. Probabilidades... Analises técnicas com indicadores e contextos fundamentalistas Estatística... Analises técnicas com indicadores e contextos fundamentalistas Análise técnica... 6 Operações diárias... Scalpe trader, day trader, swing trader Consultor de técnicas Fibonacci... explicação de
Scalping bort 30+ USD
GOLD SCALPING BOT STRATEGY Symbol: XAUUSD (Gold vs USD) Broker: Exness Account: Standard Starting Balance: $20 1. TIMEFRAME - Trend analysis: M15. - Entry timeframe: M5. - Trade only when the market has a clear direction. 2. INDICATORS - EMA 50 - EMA 200 - RSI 14 - Support and Resistance 3. BUY RULES The bot must open a BUY trade only when all these conditions are met: 1. EMA 50 is above EMA 200 on M15. 2. Price is
Request for an Existing Automated Trading System (Expert Advisor) I am looking to acquire an existing, fully functional Expert Advisor (EA) that trades Forex CFDs, with the option of trading other CFDs if the strategy supports them safely. Performance objectives Target average net monthly return: 1.5%. A consistent 1.0% monthly return may be considered if the system demonstrates strong risk control and credible
Economic Event Analysis Back ground . I have an app which downloads economic event data from a website called MyFXBook, using a script. But currently this website does not allow any script to be used. So, I have to go back to manually downloading a .csv file that shows the economic events scheduled to occur in the coming week Python . This job requires Python. Execution of this job by any other method that does not
I am looking for an experienced developer to build a professional web-based trading performance dashboard connected to an MT5 trading account and/or FX Blue. The dashboard should automatically collect trading data and display: • Daily P&L calendar – profitable days green, losing days red and no-trade days grey • Equity/growth curve • Drawdown curve • Initial capital and current balance • Net profit and percentage
Chciał bym w tej grze poznać dużo i zrozumieć ciężko bez języka mam tylko sms na gry nie mam kieszonkowych i kiepsko się trzymam finansowo żeby czasem myślę gdzie będę
Hi. I am looking for an experienced MQL5 developer for an advanced XAUUSD MT5 indicator. Before choosing a developer, I would like to see a small proof-of-concept or an example of a similar indicator you have already developed. My final indicator must be written from scratch in MQL5 and I must receive the complete .mq5 source code + compiled .ex5 . Main requirements: XAUUSD MT5 / MQL5 Indicator only — NO AutoTrading
Title: Advanced XAUUSD MT5 Indicator – MQL5 Source Code Required I need a professional MT5 indicator written from scratch in MQL5 (.mq5) for XAUUSD. The indicator must be signals/analysis only — AutoTrading must remain OFF . I need the complete editable .mq5 source code, not only an .ex5 file. The system should analyze multiple timeframes: H4 → H1 → M30 → M15 → M5 → M1 . Required logic: Higher-timeframe
I need a professional XAUUSD signal indicator for MetaTrader 5, written entirely in MQL5 (.mq5). IMPORTANT: This is NOT an auto-trading EA. It must never open, close or modify trades. It only analyzes XAUUSD and generates signals + MT5 push notifications. 1. Multi-timeframe analysis: H4 → H1 → M30 → M15 → M10 → M5 → M1. 2. Detect market structure: - Swing High / Swing Low - BOS - MSS - CHOCH - Bullish/Bearish HTF
i have indicator for Trading View, also copy for NT, i need someone to improve and check the NT version (indicator is simple is volume density koncept)…. when i put same settings on TV version and NT version i have diffrerent results, but this can be because diffrent market data or fact that TV sending tick info in blocks , not tick by tick like NT8 on both. I(ndicator base on counting volume) so besied that is it

Informations sur le projet

Budget
50 - 100 USD
Délais
de 3 à 5 jour(s)