Yong Xie / Seller
Published products

This is a review script that directly displays transaction history on a chart.
Firstly, set the time period for the account's historical transaction records. After the script runs, the historical transaction records within the set time period will be displayed on a chart. The displayed prices include opening price, closing price, stop loss price, stop profit price, as well as the trading volume of each order. Multiple orders have a red line, while empty orders have a green line. The hanging o

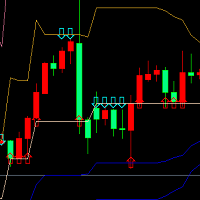
This indicator is based on the golden ratio theory, which obtains the high and low prices of the past 22 (default) K-lines, and calculates the support and pressure curves through the golden ratio coefficient. When the price approaches the pressure line for the first time or multiple times, a downward arrow will appear, indicating that there is pressure and it is suitable to short sell; When the price approaches the support line for the first time or multiple times, an upward arrow will appear,

本指标是根据黄金分割理论,分别获取过去22(默认)根K线高低价,并通过黄金分割系数计算得出支撑、压力曲线。 当价格第一次向上靠近压力线,或者多次靠近压力线时,会出现向下的箭头符合,提示有压力,适宜做空sell; 当价格第一次向下靠近支撑线,或者多次靠近支撑线时,会出现向上的箭头符合,提示有支撑,适宜做多buy; 在数据窗口,会提示各条支撑、压力线的价格数值,出现的箭头符合数值为up、down。
这个指标,适合在所挂的图表里做短线,也即进场开仓后,持仓几根K线柱,然后可以平仓。做多的话,止损可以在支撑线下方,止盈在压力线附近。做空的话,止损可以在压力线上方,止盈在支撑线附近。
本指标涉及的黄金分割系数分别为0.382、0.618、1.618、2.168、4.236,计算得到对应的支撑压力线。 由于MT4的指标数量有限,本指标分成了2个EX4文件,第一个的黄金分割系数为0.382、0.618、1.618,第二个为2.168、4.236,第二个文件名为“Golden Ratio Support Pressure Indicator extend”,可免费下载和使用。
FREE