Soraya Bahlekeh / Profile
- Information
|
3 years
experience
|
6
products
|
860
demo versions
|
|
0
jobs
|
0
signals
|
0
subscribers
|
If you require guidance and advice, please feel free to send me a private message, and I will respond as soon as possible.
Soraya Bahlekeh
Using Technical Indicators in Forex Trading:
Technical indicators can help traders analyze price patterns and trends, identify entry and exit points, and make informed trading decisions. Let's discuss some popular technical indicators and how to use them effectively:
Moving Average:
Simple Moving Average (SMA): SMA calculates the average price over a specified period of time. Using SMA can help identify price trends and confirm entry and exit signals.
Exponential Moving Average (EMA): EMA is similar to SMA but gives more weight to recent prices. EMA, being a dynamic indicator, can reflect the speed of price changes.
Relative Strength Index (RSI):
RSI is a popular indicator that measures the strength and direction of a price trend. It ranges from 0 to 100, and when RSI approaches the upper range (above 70), the market may be overbought, and when it approaches the lower range (below 30), the market may be oversold.
Moving Average Convergence Divergence (MACD):
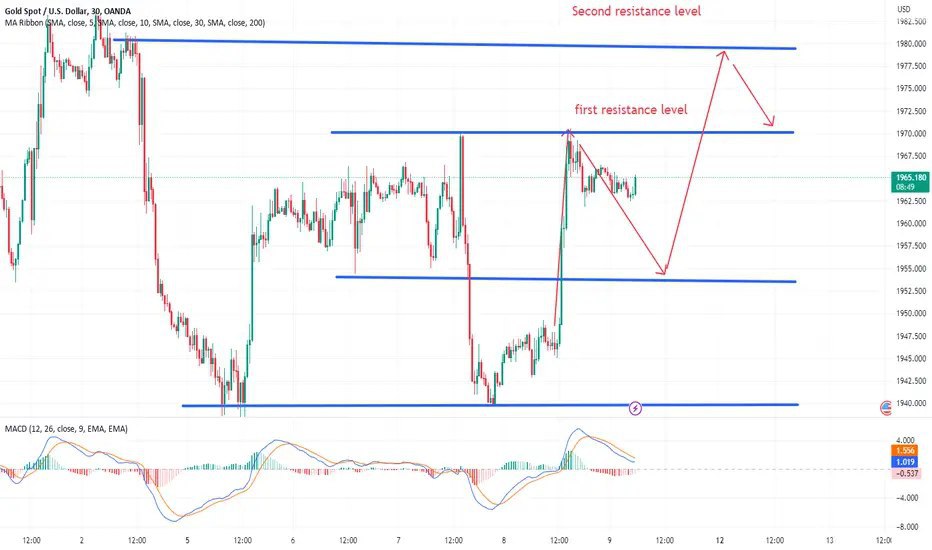
MACD is a lagging indicator used to identify changes in trend direction and potential continuation or reversal of price trends. Its main components include the MACD line, signal line, and histogram.
Bollinger Bands:
Bollinger Bands consist of a middle band (SMA or EMA), an upper band (standard deviation multiplied by a factor), and a lower band (standard deviation multiplied by a factor). They help identify periods of high or low volatility and potential price breakouts.
Fibonacci Retracement:
Fibonacci retracement is based on the Fibonacci sequence and is used to identify potential support and resistance levels. Traders use these levels to determine entry and exit points in a trending market.
Remember, technical indicators should not be used in isolation but as part of a comprehensive trading strategy. It's crucial to combine technical analysis with fundamental analysis, risk management techniques, and market understanding for successful trading.
Technical indicators can help traders analyze price patterns and trends, identify entry and exit points, and make informed trading decisions. Let's discuss some popular technical indicators and how to use them effectively:
Moving Average:
Simple Moving Average (SMA): SMA calculates the average price over a specified period of time. Using SMA can help identify price trends and confirm entry and exit signals.
Exponential Moving Average (EMA): EMA is similar to SMA but gives more weight to recent prices. EMA, being a dynamic indicator, can reflect the speed of price changes.
Relative Strength Index (RSI):
RSI is a popular indicator that measures the strength and direction of a price trend. It ranges from 0 to 100, and when RSI approaches the upper range (above 70), the market may be overbought, and when it approaches the lower range (below 30), the market may be oversold.
Moving Average Convergence Divergence (MACD):
MACD is a lagging indicator used to identify changes in trend direction and potential continuation or reversal of price trends. Its main components include the MACD line, signal line, and histogram.
Bollinger Bands:
Bollinger Bands consist of a middle band (SMA or EMA), an upper band (standard deviation multiplied by a factor), and a lower band (standard deviation multiplied by a factor). They help identify periods of high or low volatility and potential price breakouts.
Fibonacci Retracement:
Fibonacci retracement is based on the Fibonacci sequence and is used to identify potential support and resistance levels. Traders use these levels to determine entry and exit points in a trending market.
Remember, technical indicators should not be used in isolation but as part of a comprehensive trading strategy. It's crucial to combine technical analysis with fundamental analysis, risk management techniques, and market understanding for successful trading.
Soraya Bahlekeh
The hedging strategy is a method used to reduce risks in trading and financial investments. Essentially, hedging is employed to protect financial positions against price fluctuations, exchange rates, and other market factors. This approach is commonly used by companies, investors, and traders in financial markets.
One common method of hedging is through the use of futures contracts. By buying or selling futures contracts, individuals can lock in the price of a desired product or asset. This enables them to benefit from price increases or decreases in the future.
Another hedging method is engaging in offsetting transactions (e.g., trading in the spot market or in the options market). By executing offsetting trades, individuals can reduce risk while still taking advantage of profitable opportunities.
Implementing a hedging strategy requires careful market analysis, risk assessment, and precise portfolio management. Its main objective is to mitigate price volatility, preserve capital, and maintain profitability in turbulent market conditions.
One common method of hedging is through the use of futures contracts. By buying or selling futures contracts, individuals can lock in the price of a desired product or asset. This enables them to benefit from price increases or decreases in the future.
Another hedging method is engaging in offsetting transactions (e.g., trading in the spot market or in the options market). By executing offsetting trades, individuals can reduce risk while still taking advantage of profitable opportunities.
Implementing a hedging strategy requires careful market analysis, risk assessment, and precise portfolio management. Its main objective is to mitigate price volatility, preserve capital, and maintain profitability in turbulent market conditions.
: