📘 User Guide – FX Super Arrow Indicator
1. Introduction
The FX Super Arrow is a custom indicator designed to highlight potential buy and sell opportunities using a confluence of technical signals:
Moving Averages (EMA crossovers)
RSI (Relative Strength Index)
Bollinger Bands
Bulls & Bears Power
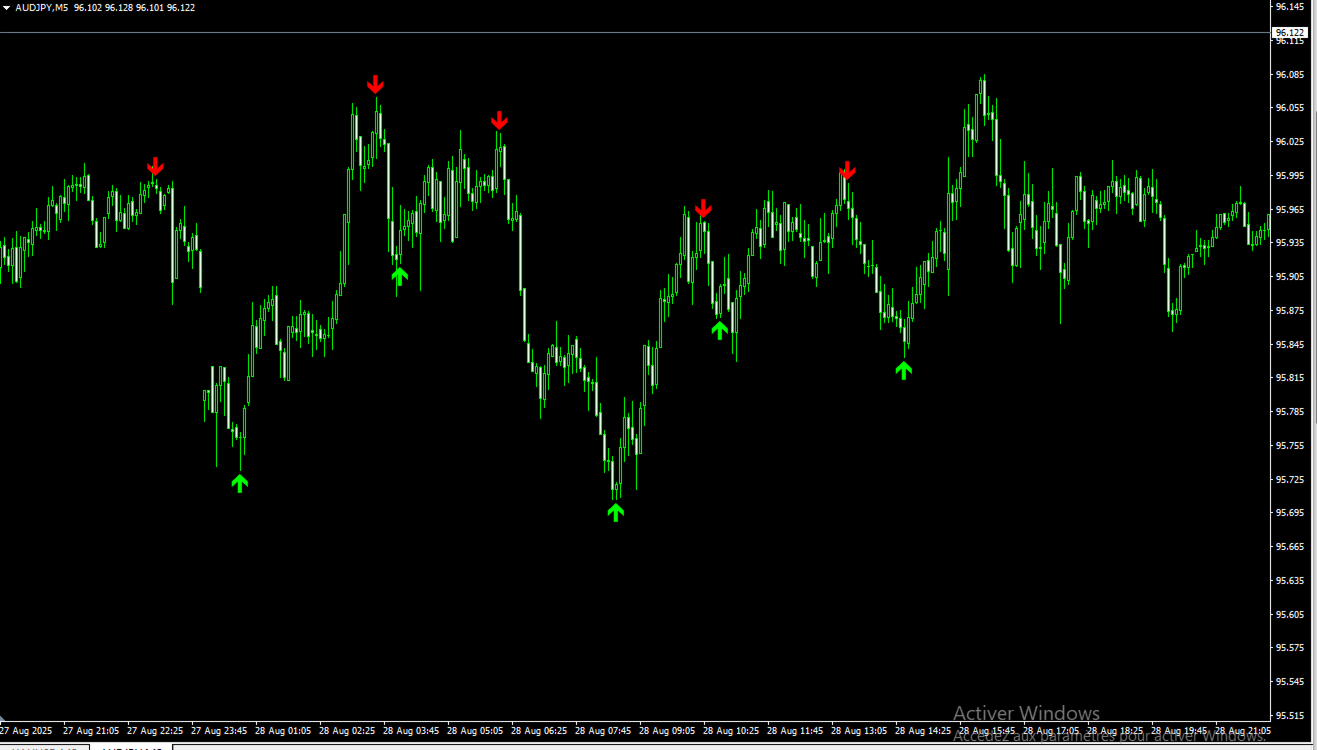
The indicator plots arrows on the chart:
Green arrow (Buy) below price → potential bullish signal
Red arrow (Sell) above price → potential bearish signal
⚠️ Important: Arrows may move on the current candle until it closes. Once the candle is closed, the signal does not repaint.
2. How to Use
Attach the indicator to your chart (any symbol, any timeframe).
Adjust settings if needed (default works well for most symbols).
Wait for arrows:
Green arrow = potential Buy
Red arrow = potential Sell
Always confirm signals with your trading rules (price action, higher timeframe trend, support/resistance).
For more reliable signals:
Use M15 timeframe or higher.
Wait for candle close to confirm the signal.
3. Trading Tips
✅ Trend Confirmation: Align arrow signals with the main trend (e.g., use EMA200 or higher timeframe direction).
✅ Avoid Noise: On very low timeframes (M1/M5), signals may be more frequent but less reliable.
✅ Risk Management: Always set Stop Loss and Take Profit according to your trading plan.
4. Alerts
When a Buy or Sell arrow is generated on the latest candle, a popup alert will appear (if enabled).
Alerts can be disabled in the input settings (Alerts = false).
5. Disclaimer
The FX Super Arrow is a technical tool and should not be used alone. Always combine it with proper risk management and additional confirmation. Past performance is not a guarantee of future results.
FX Super Arrow Indicator : https://www.mql5.com/en/market/product/148493?source=Site+Profile+Seller
1. Introduction
The FX Super Arrow is a custom indicator designed to highlight potential buy and sell opportunities using a confluence of technical signals:
Moving Averages (EMA crossovers)
RSI (Relative Strength Index)
Bollinger Bands
Bulls & Bears Power
The indicator plots arrows on the chart:
Green arrow (Buy) below price → potential bullish signal
Red arrow (Sell) above price → potential bearish signal
⚠️ Important: Arrows may move on the current candle until it closes. Once the candle is closed, the signal does not repaint.
2. How to Use
Attach the indicator to your chart (any symbol, any timeframe).
Adjust settings if needed (default works well for most symbols).
Wait for arrows:
Green arrow = potential Buy
Red arrow = potential Sell
Always confirm signals with your trading rules (price action, higher timeframe trend, support/resistance).
For more reliable signals:
Use M15 timeframe or higher.
Wait for candle close to confirm the signal.
3. Trading Tips
✅ Trend Confirmation: Align arrow signals with the main trend (e.g., use EMA200 or higher timeframe direction).
✅ Avoid Noise: On very low timeframes (M1/M5), signals may be more frequent but less reliable.
✅ Risk Management: Always set Stop Loss and Take Profit according to your trading plan.
4. Alerts
When a Buy or Sell arrow is generated on the latest candle, a popup alert will appear (if enabled).
Alerts can be disabled in the input settings (Alerts = false).
5. Disclaimer
The FX Super Arrow is a technical tool and should not be used alone. Always combine it with proper risk management and additional confirmation. Past performance is not a guarantee of future results.
FX Super Arrow Indicator : https://www.mql5.com/en/market/product/148493?source=Site+Profile+Seller