|
12+ years
experience
|
0
products
|
0
demo versions
|
|
0
jobs
|
0
signals
|
0
subscribers
|
Internet money miner

Yury Kirillov

· 4
Yury Kirillov
2015.04.14
Приходите Вы в магазин, набираете товар - а оплата с карточки придёт магазину через неделю...
Sergey Portianyk
2015.04.14
а я уж подумал что эт такое заморозка средств... сервис деск доставал ))

Yury Kirillov

· 4
Pankaj D Costa
2015.03.28
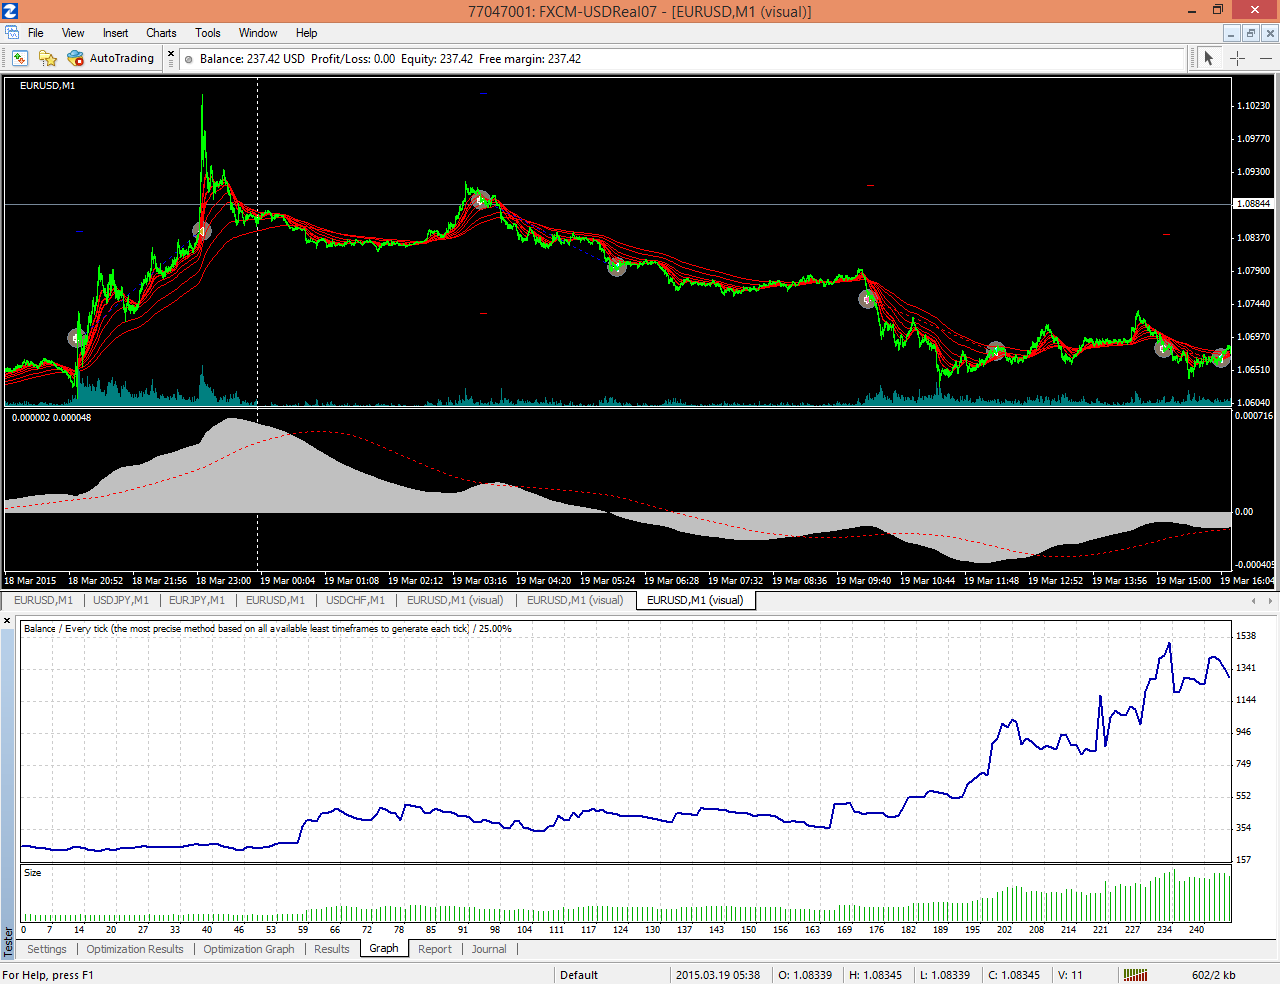
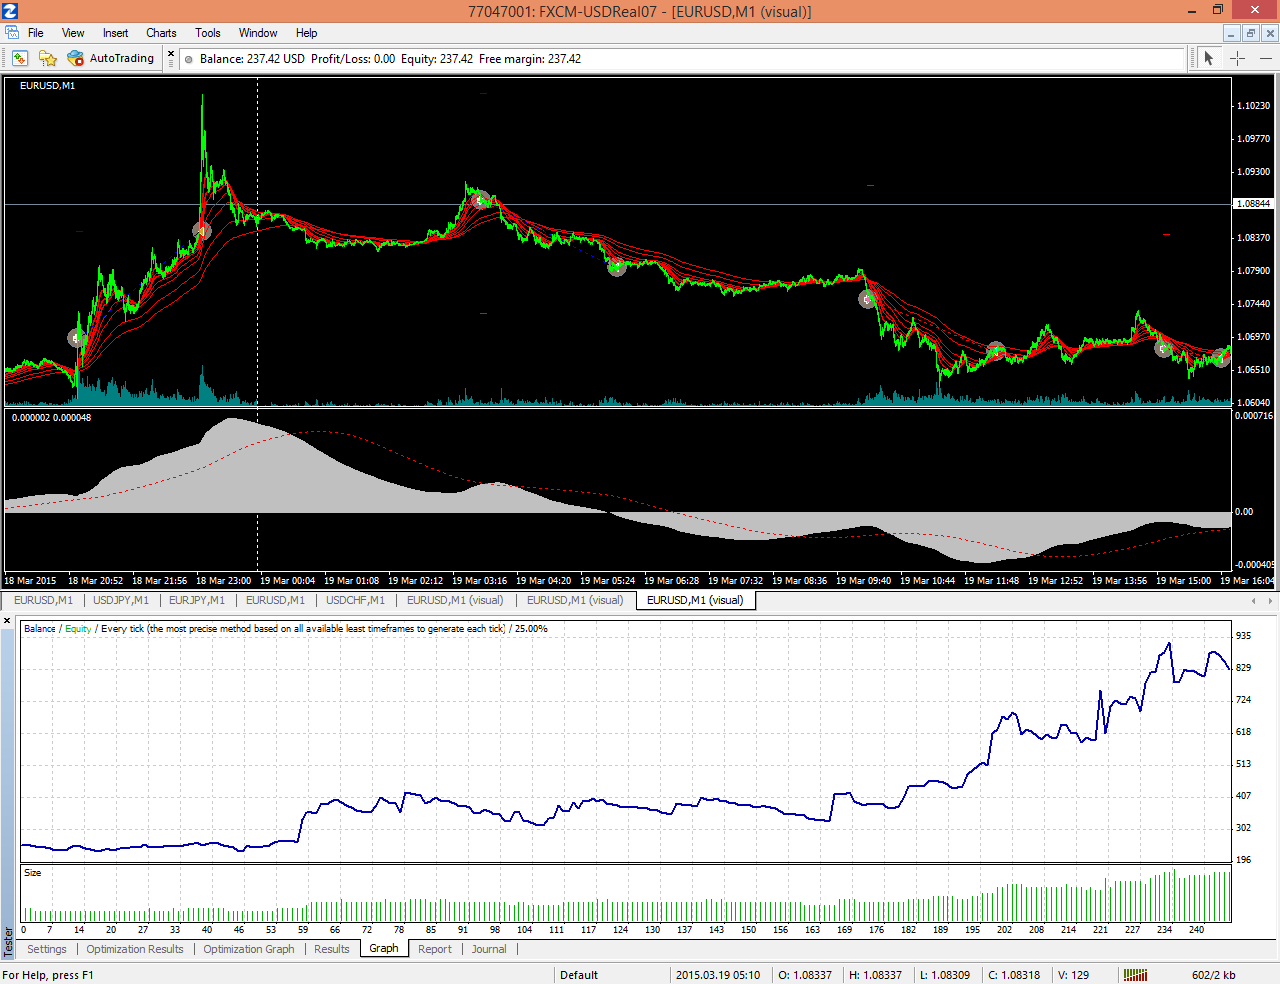
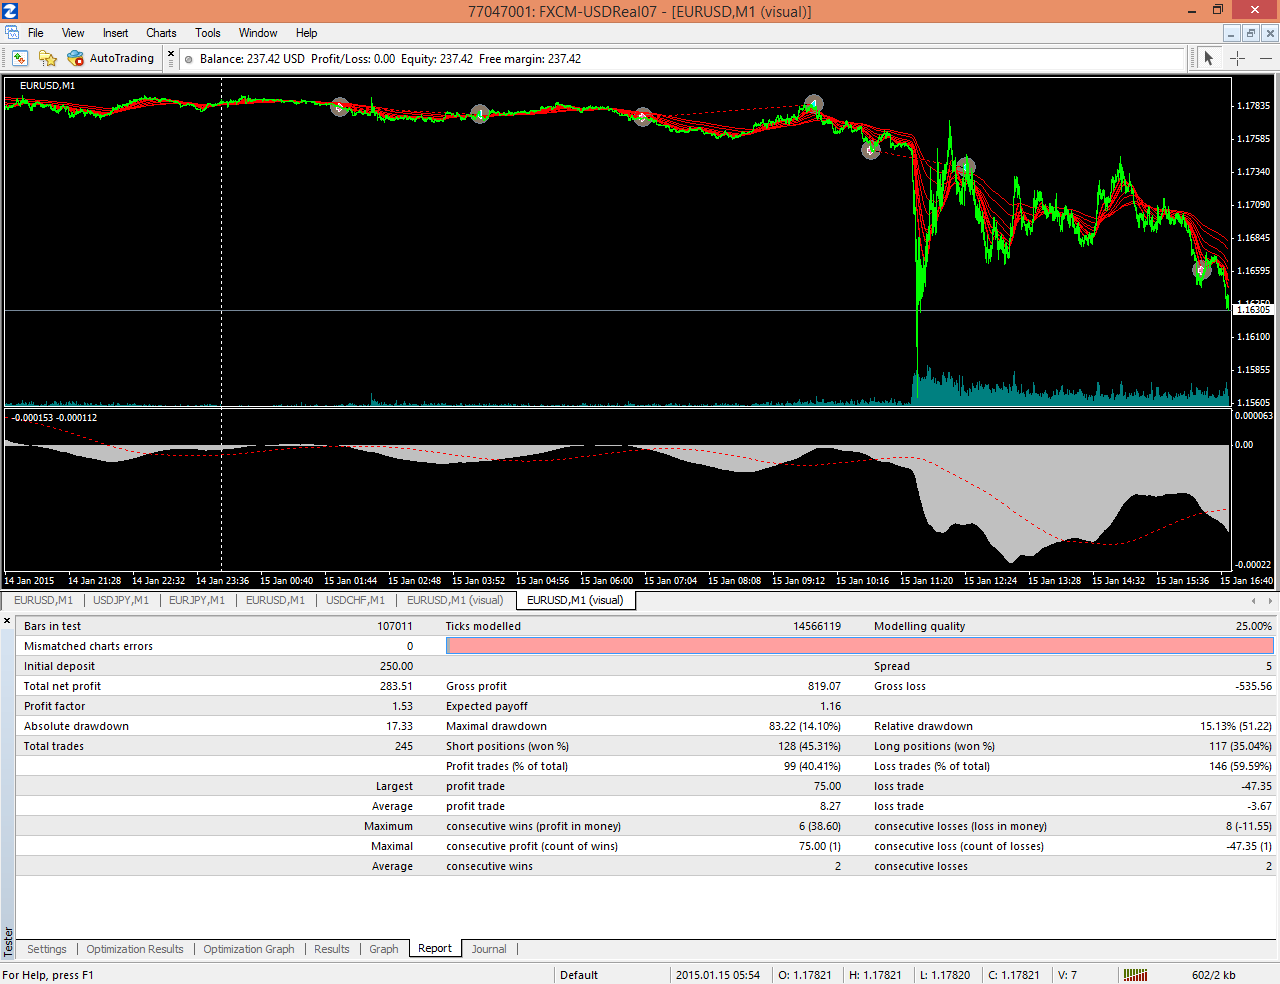
Everybody is looking for modelling quality (99.90%), what is your explanation about your modelling quality? Because I am also getting this type of quality but profit is good, d/d also low.
Yury Kirillov
2015.03.28
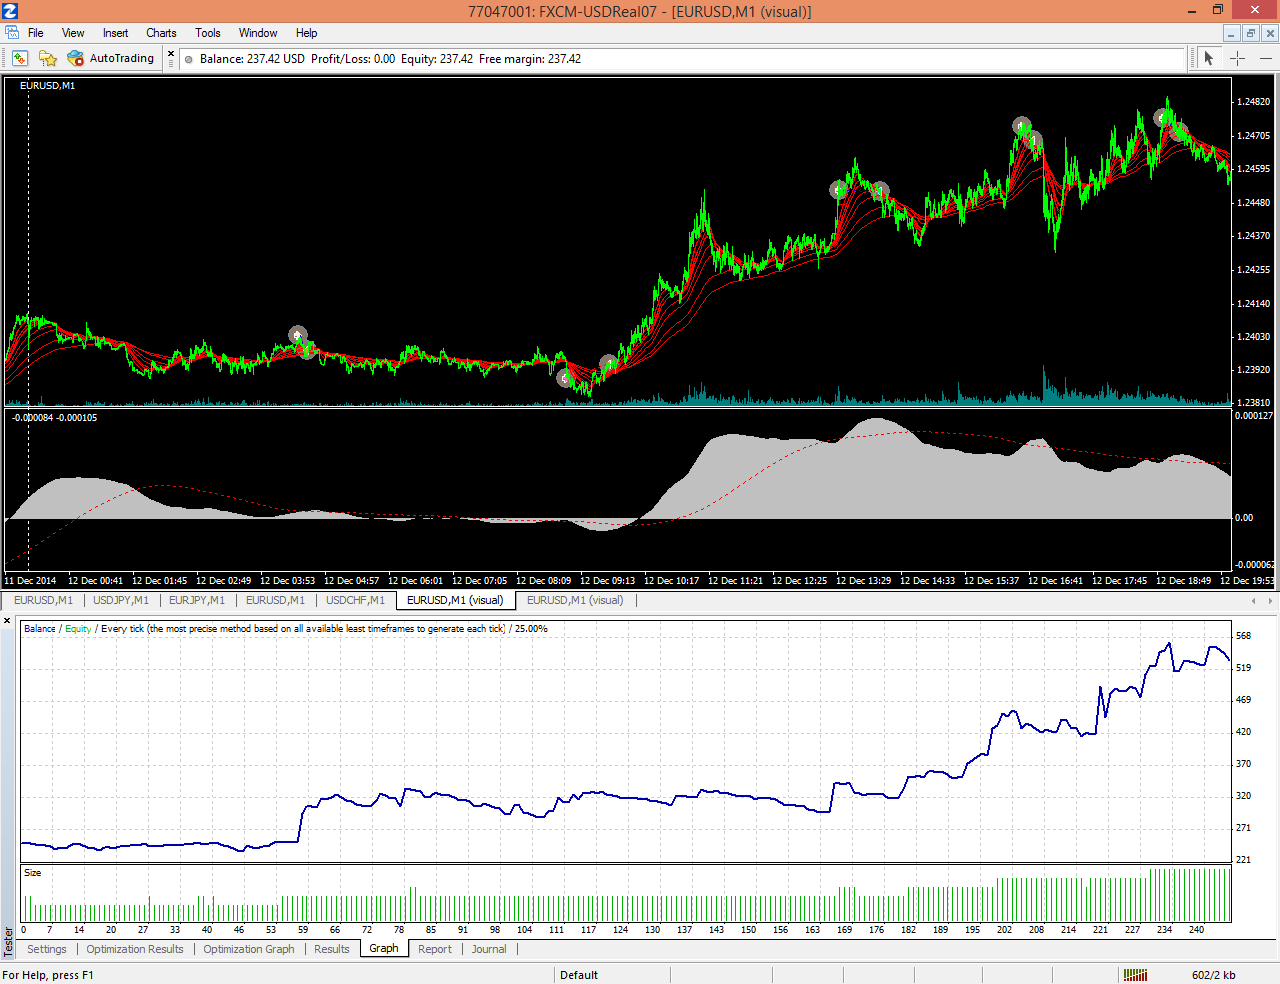
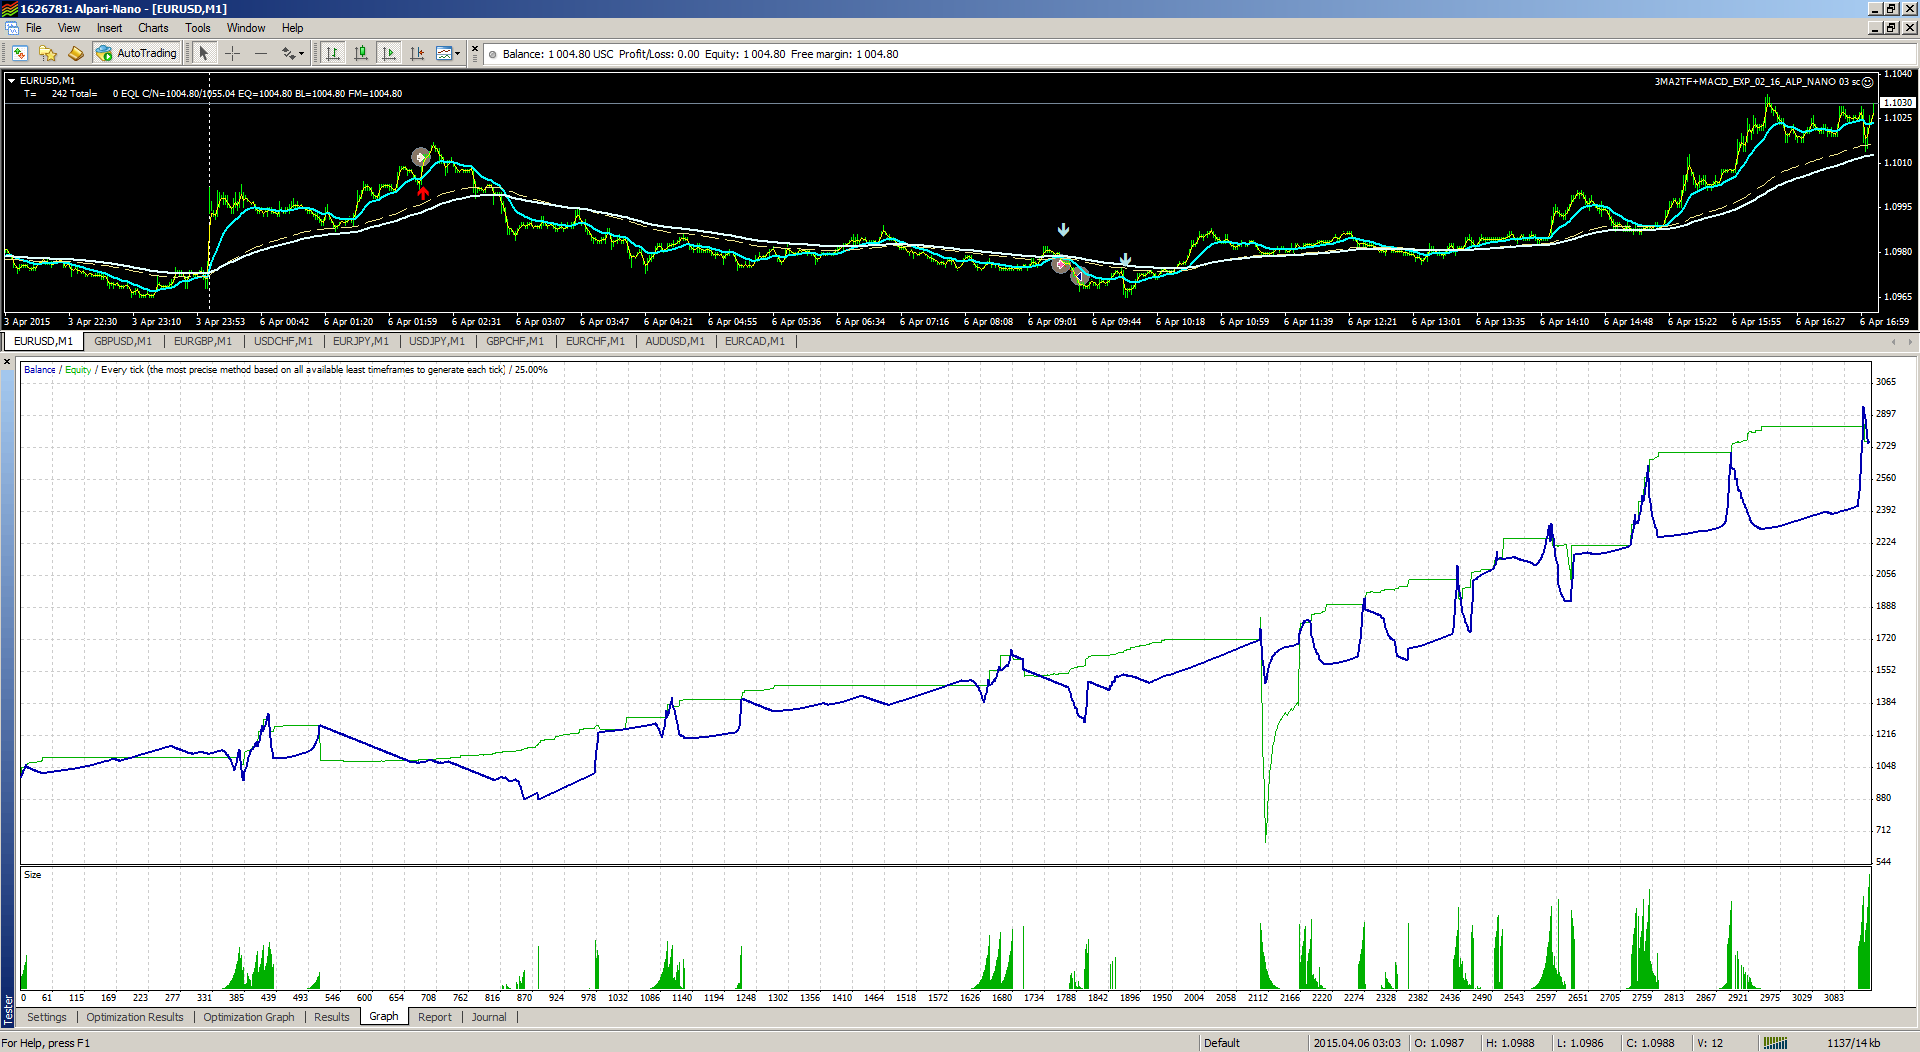
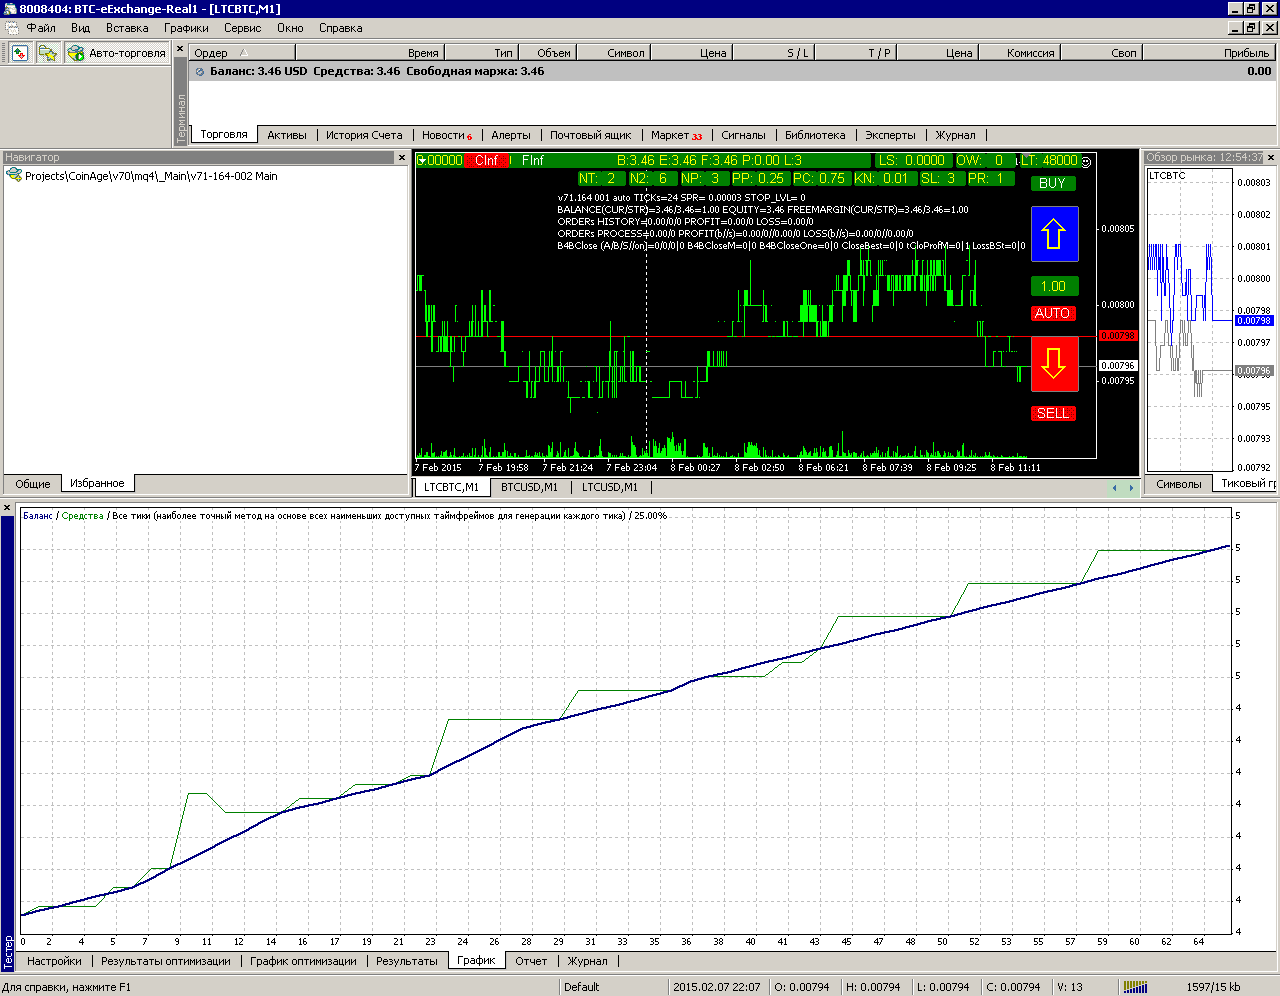
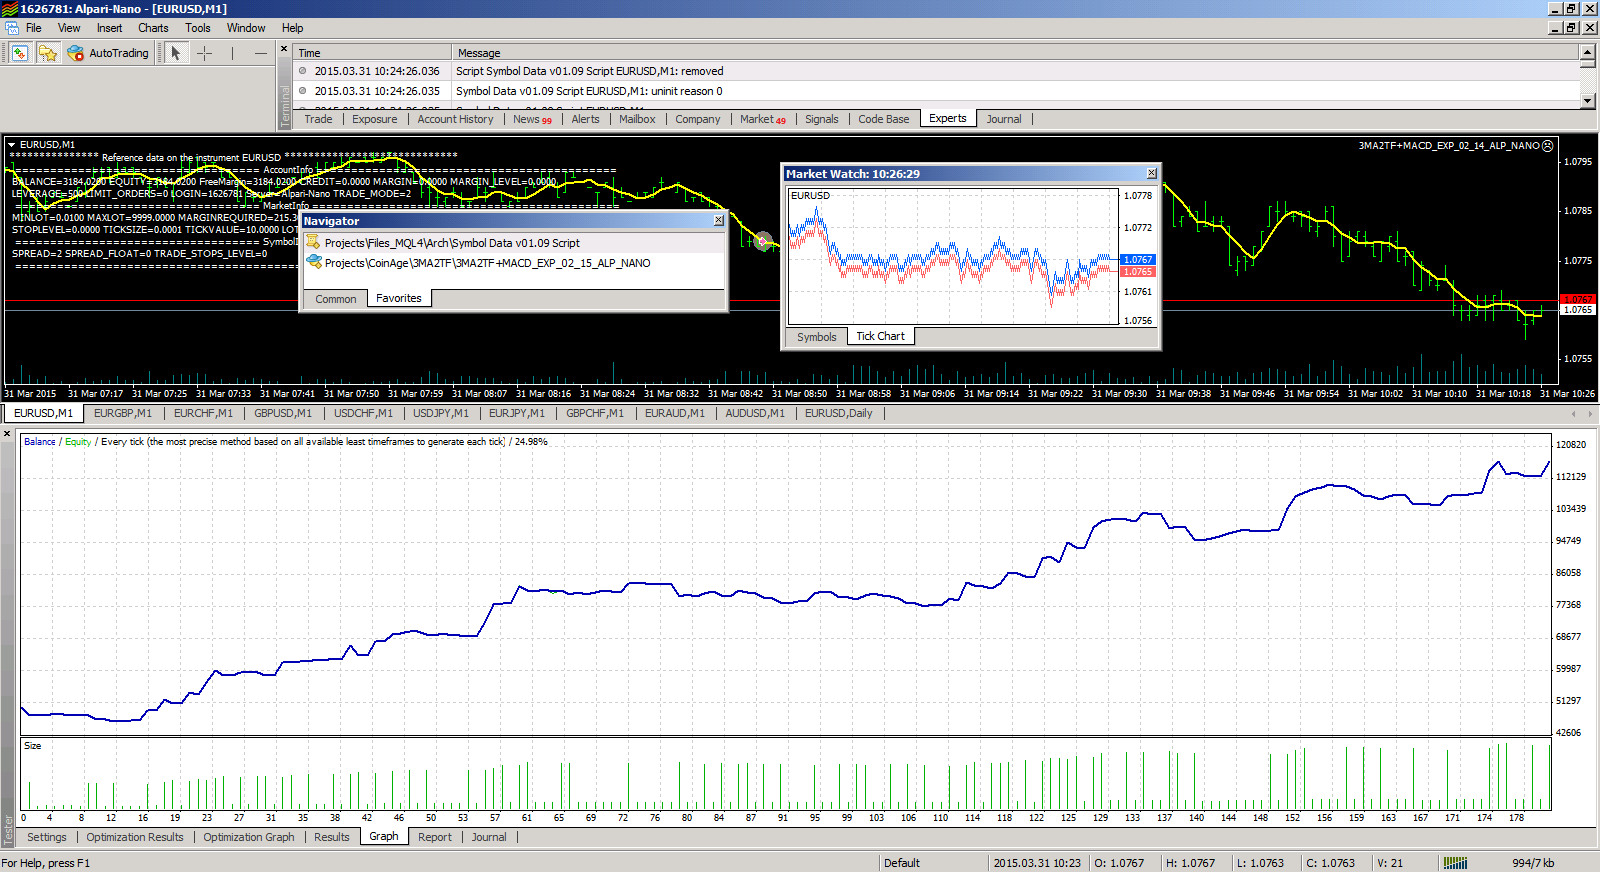
Quality modeling minute timeframe is always 25%, if not use special tools.
Качество моделирования на минутном таймфрейме всегда 25%, если не использовать специальные средства.
Качество моделирования на минутном таймфрейме всегда 25%, если не использовать специальные средства.