|
13+ years
experience
|
0
products
|
0
demo versions
|
|
7
jobs
|
0
signals
|
0
subscribers
|
Trajecta - Consultoria e Projeto de Robôs - http://www.trajecta.com.br
LinkedIn: https://br.linkedin.com/in/figurelli
Published books: https://goo.gl/j9mhPi
LinkedIn: https://br.linkedin.com/in/figurelli
Published books: https://goo.gl/j9mhPi

Rogerio Figurelli

· 3
Rogerio Figurelli
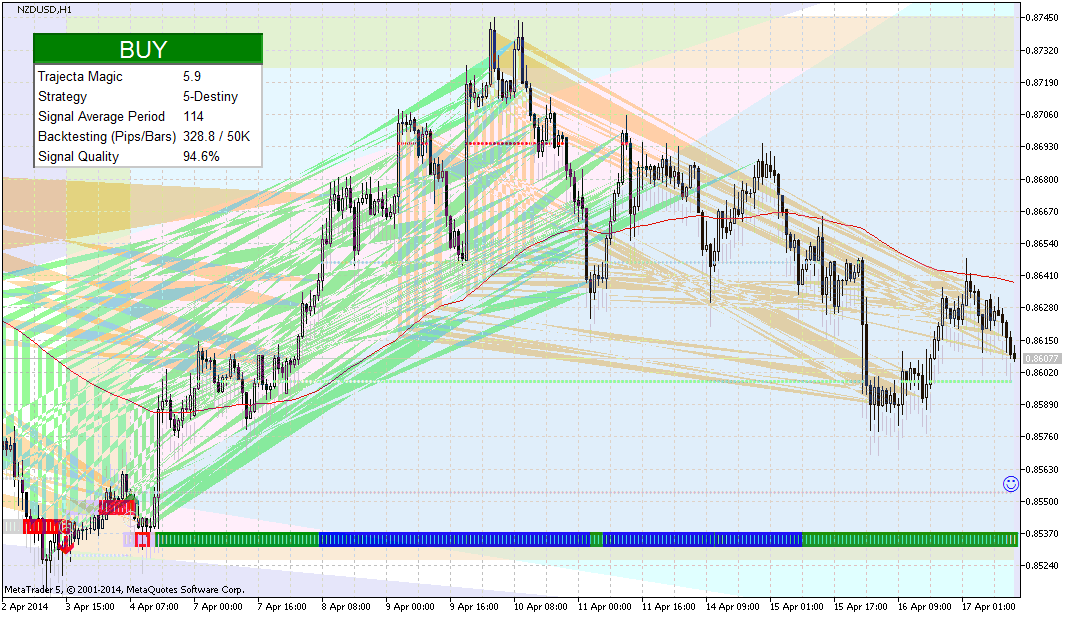
2014.04.17
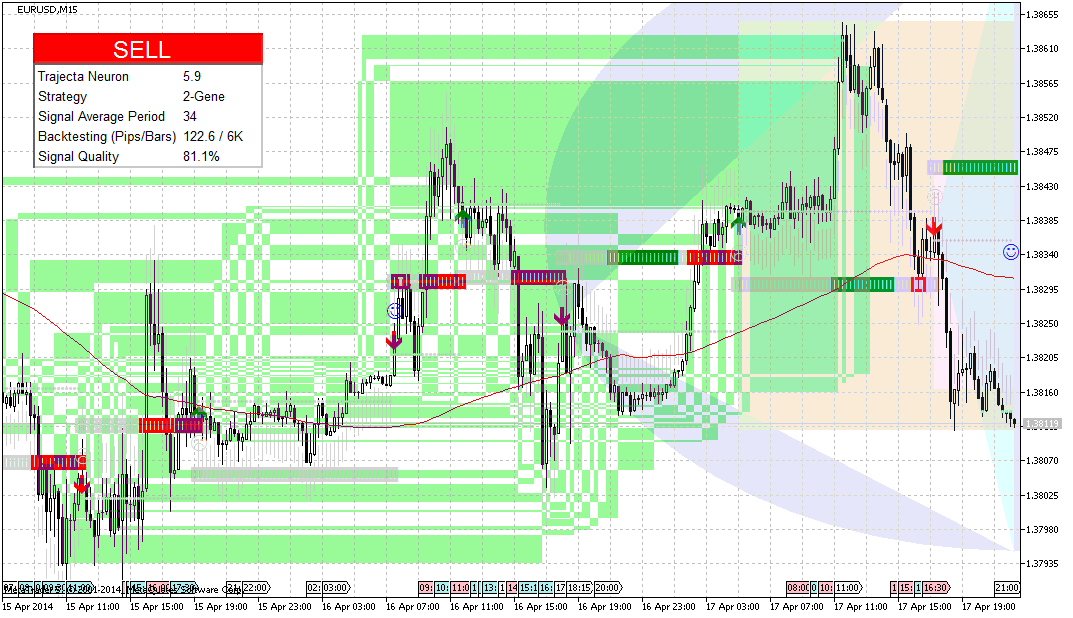
Thanks Imtiaz, but this was not a prediction, just a good trading signal ...