Rogerio Figurelli / Profile
- Information
|
13+ years
experience
|
0
products
|
0
demo versions
|
|
7
jobs
|
0
signals
|
0
subscribers
|
Trajecta - Consultoria e Projeto de Robôs - http://www.trajecta.com.br
LinkedIn: https://br.linkedin.com/in/figurelli
Published books: https://goo.gl/j9mhPi
LinkedIn: https://br.linkedin.com/in/figurelli
Published books: https://goo.gl/j9mhPi
Friends
1076
Requests
Outgoing
Rogerio Figurelli


Rogerio Figurelli
2014.04.18
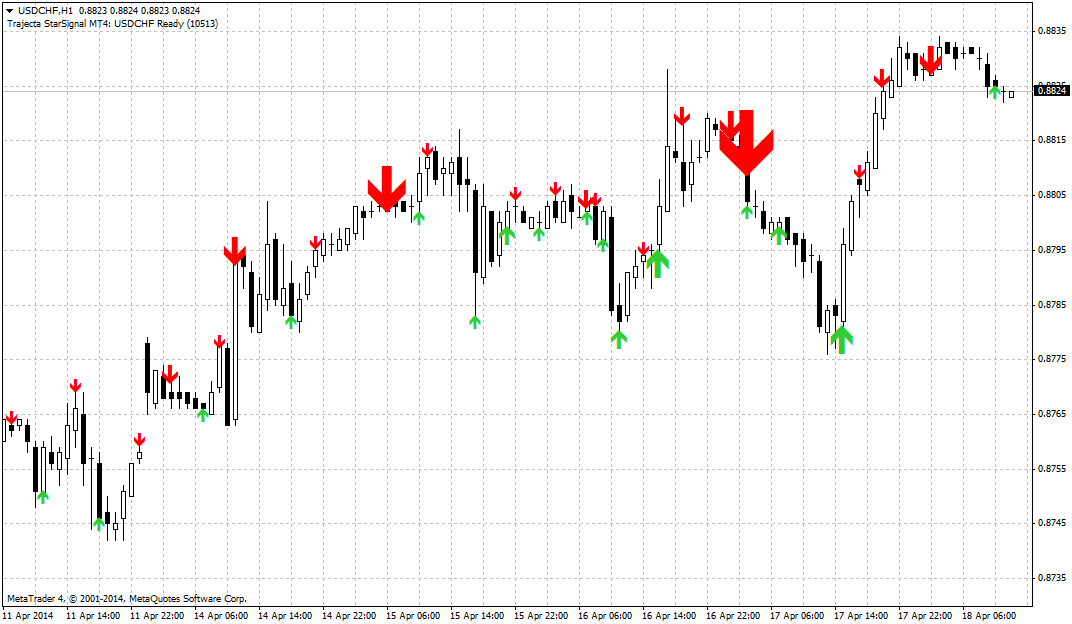
This is a new generation of trading signals indicators at Trajecta, starting with MT4. All adjustments are automatic for any pair or timeframe.
Imtiaz Ahmed
2014.04.18
nice small arrows with big ones...
Rogerio Figurelli
2014.04.18
Thank you Imtiaz, this is a new idea to show signals indicators that I'm working (looks like stars in the sky, so I named in this way this first release) and it will be submited to MT4 market next week.
Rogerio Figurelli


Rogerio Figurelli
2014.04.19
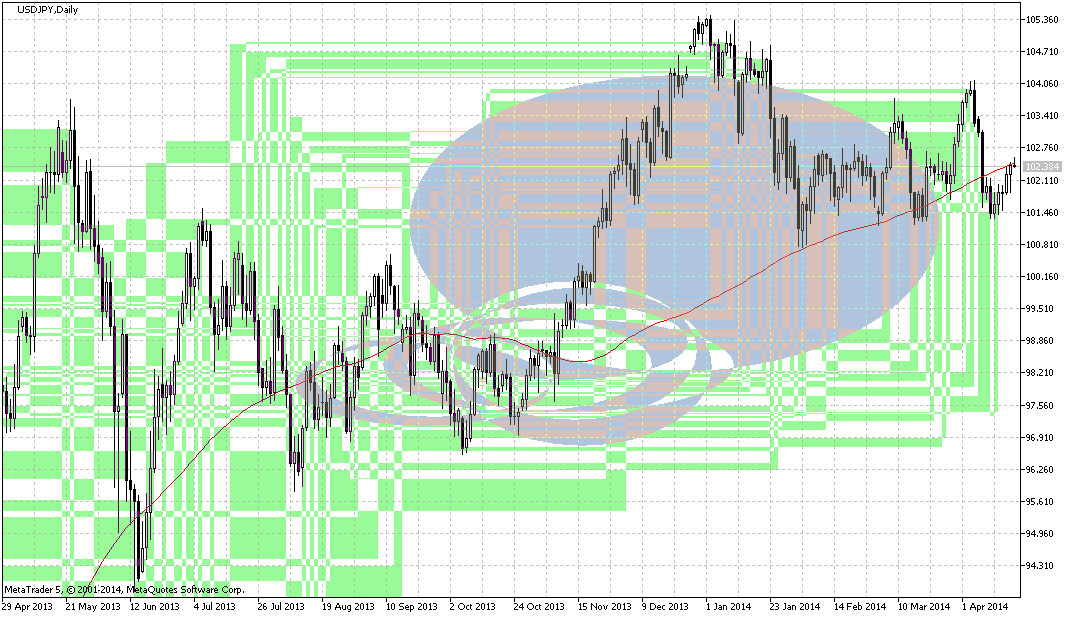
hi, simple, green rectangles indicates up trending, circle areas indicate divergence and resistance zones.
Rogerio Figurelli
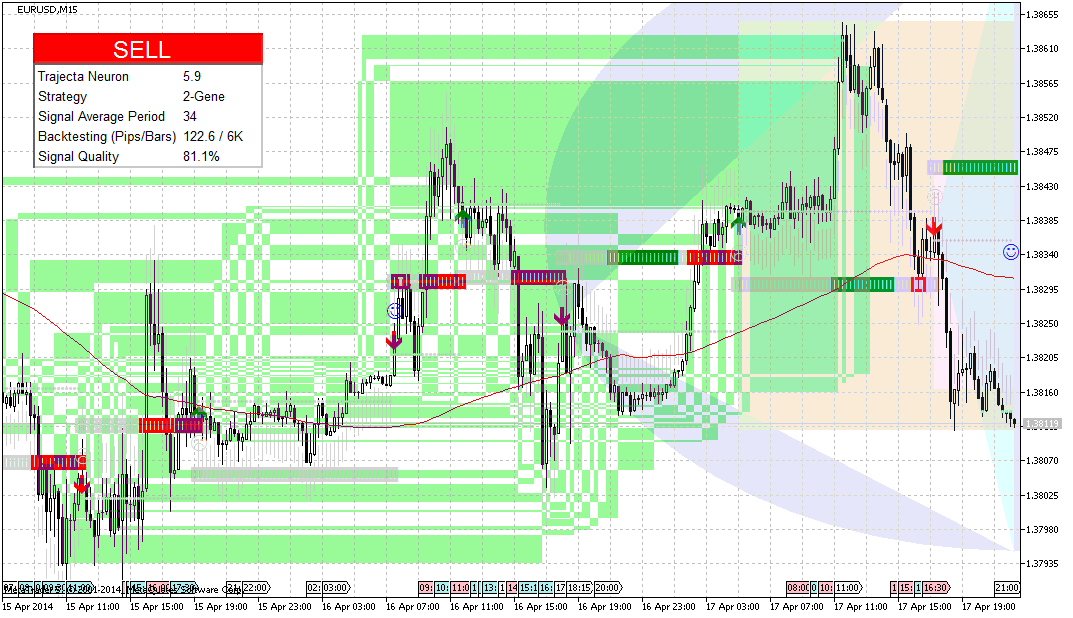
Trajecta Neuron - Strategy Gene and Trajecta ClusterMap for EURUSD,M15 - https://www.mql5.com/en/market/product/3849

Rogerio Figurelli
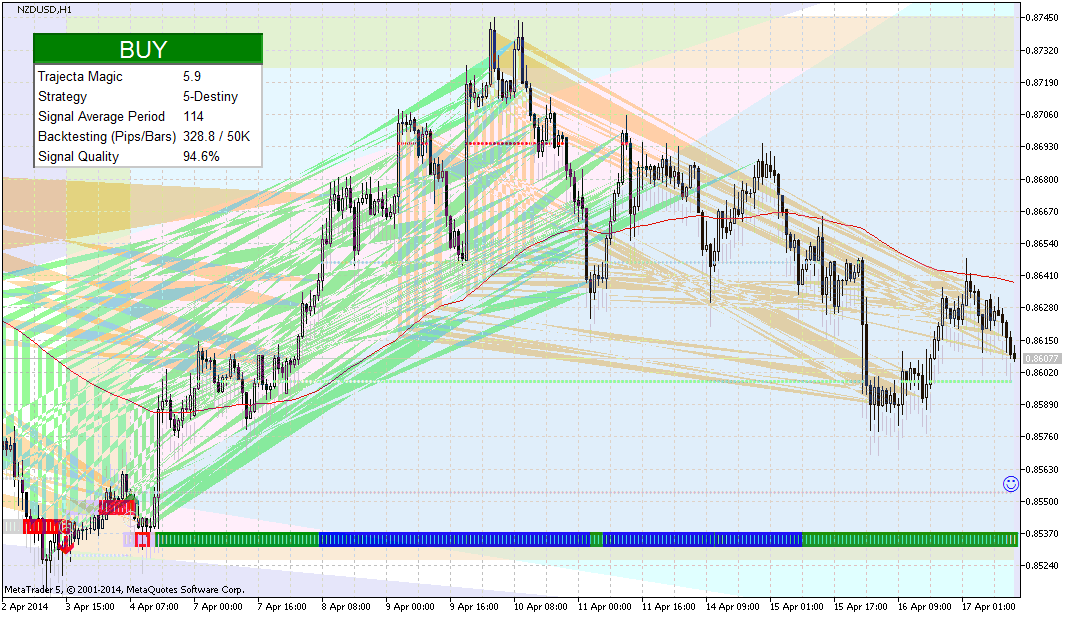
Trajecta Magic - Destiny Strategy and Trajecta FlashMap for NZDUSD,H1 - https://www.mql5.com/en/market/product/3798

Rogerio Figurelli
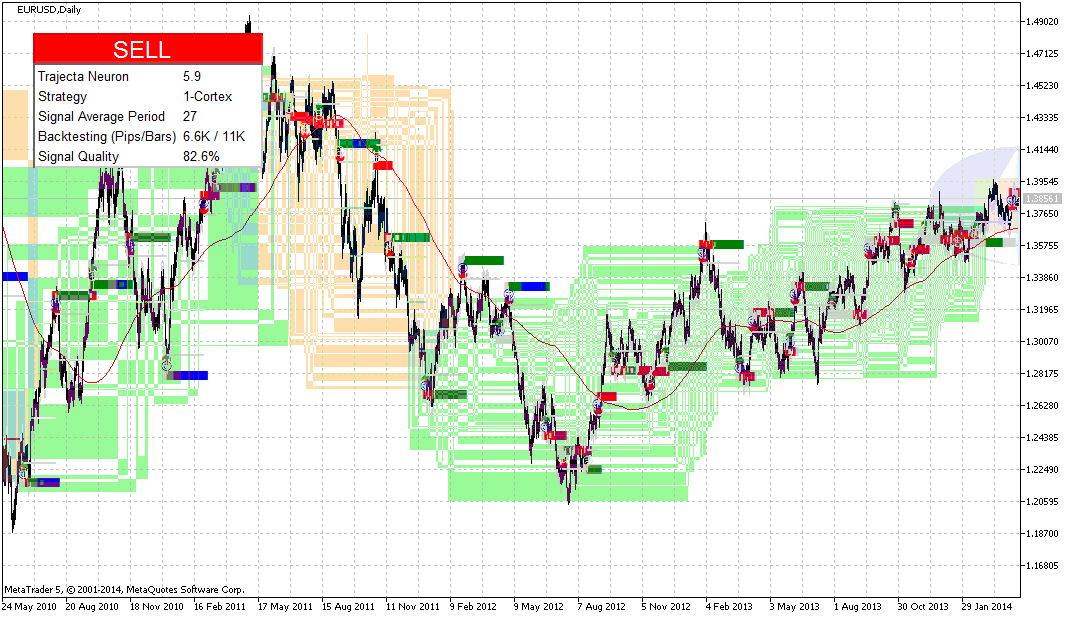


Trajecta Neuron - Strategy Cortex and Trajecta Cluster Map - https://www.mql5.com/en/market/product/3849

Rogerio Figurelli
2014.04.17
Thanks Imtiaz, but this was not a prediction, just a good trading signal ...
Rogerio Figurelli
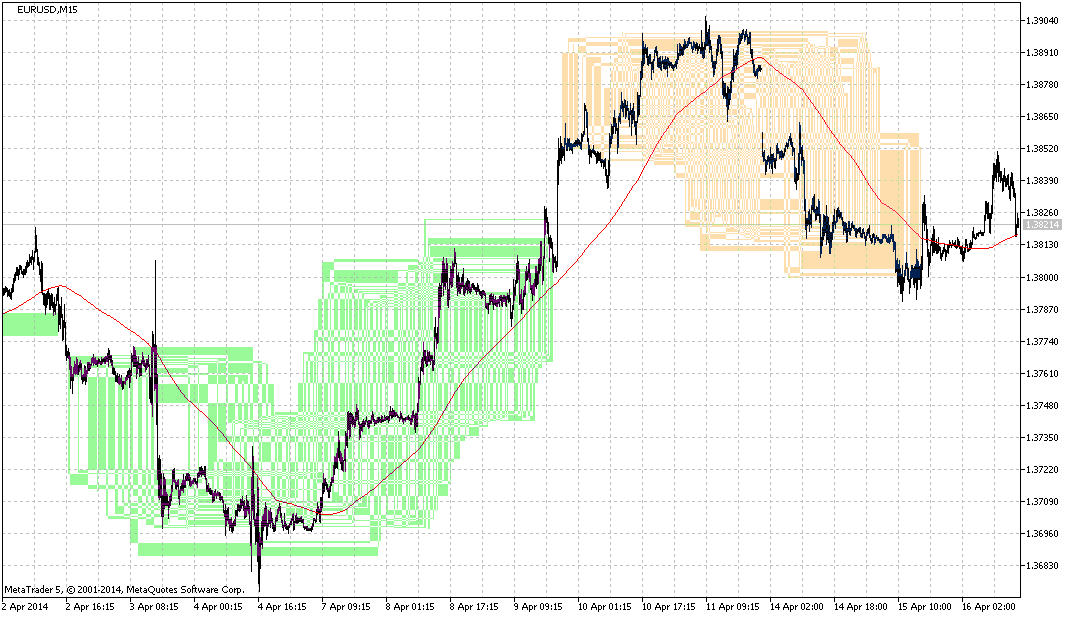
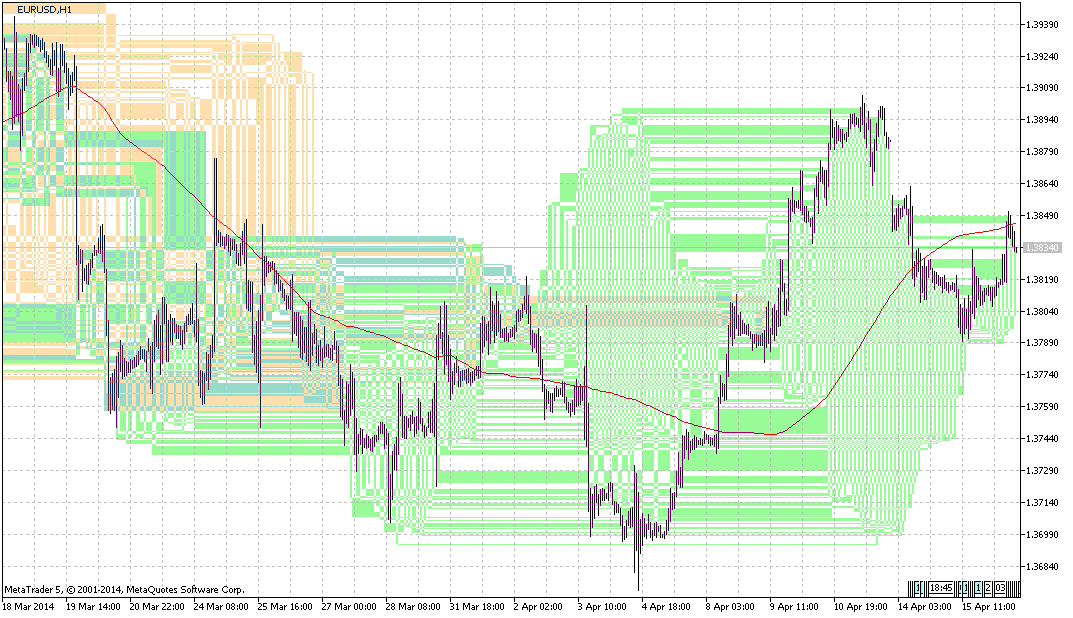
Introducing Trajecta ClusterMap - from quantitative to qualitative
Examples of visual information to trading analysis and decision support, based on this indicator:
Volatility: long areas can indicate high volatility.
Lateral Movement: several mix of colors can indicate that market is not trending.
Trend Force: just one color can indicate that market is trending.
Divergence: start of new colors can indicate a market divergence and start of new trend.
Risk: be aware about unusual maps formats since they can indicate risk market scenarios.
Cycles: usual maps formats can indicate cycle market scenarios.
Scenarios: pattern maps formats can indicate usual market scenarios.
Correlations: pattern maps formats between two instruments can indicate pair trading opportunities.
Combinations: up and down trend colors combination (new color) can indicate lateral market or trend changing to lateral.
Support and Resistence: white areas (no color) can indicate weak to strong support and resistance areas.

Rogerio Figurelli
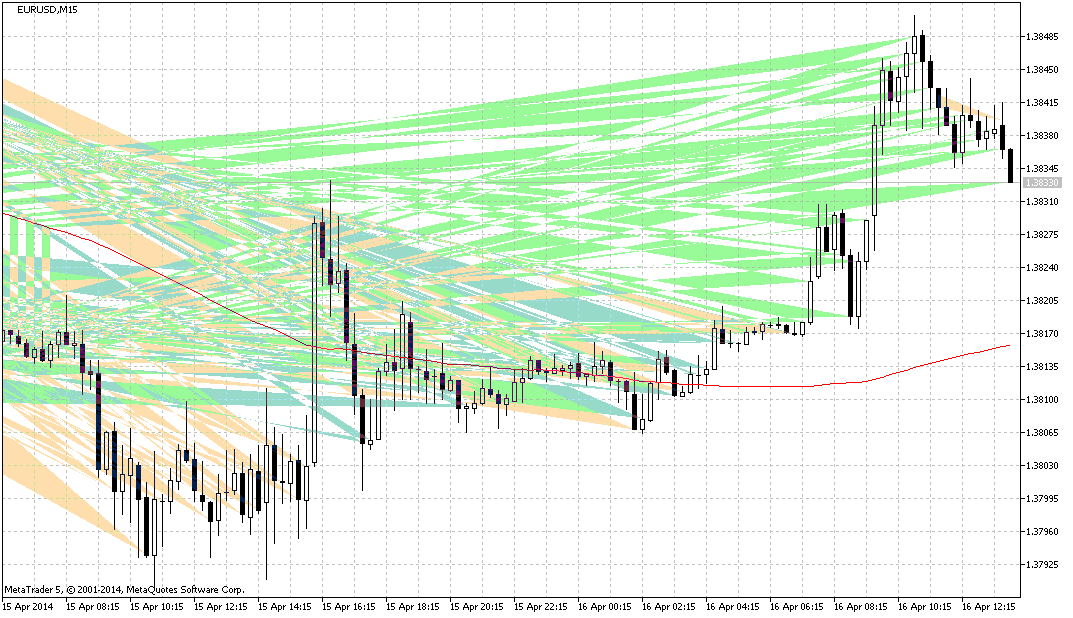
Introducing Trajecta ForceMap - from quantitative to qualitative
Examples of visual information to trading analysis and decision support, based on this indicator:
Volatility: long areas can indicate high volatility.
Lateral Movement: several mix of colors can indicate that market is not trending.
Trend Force: just one color can indicate that market is trending.
Divergence: start of new colors can indicate a market divergence and start of new trend.
Risk: be aware about unusual maps formats since they can indicate risk market scenarios.
Cycles: usual maps formats can indicate cycle market scenarios.
Scenarios: pattern maps formats can indicate usual market scenarios.
Correlations: pattern maps formats between two instruments can indicate pair trading opportunities.
Combinations: up and down trend colors combination (new color) can indicate lateral market or trend changing to lateral.
Support and Resistence: white areas (no color) can indicate weak to strong support and resistance areas.

Rogerio Figurelli
Introducing Trajecta SpeedMap - from quantitative to qualitative
Examples of visual information to trading analysis and decision support, based on this indicator:
Volatility: long areas can indicate high volatility.
Lateral Movement: several mix of colors can indicate that market is not trending.
Trend Force: just one color can indicate that market is trending.
Divergence: start of new colors can indicate a market divergence and start of new trend.
Risk: be aware about unusual maps formats since they can indicate risk market scenarios.
Cycles: usual maps formats can indicate cycle market scenarios.
Scenarios: pattern maps formats can indicate usual market scenarios.
Correlations: pattern maps formats between two instruments can indicate pair trading opportunities.
Combinations: up and down trend colors combination (new color) can indicate lateral market or trend changing to lateral.
Support and Resistence: white areas (no color) can indicate weak to strong support and resistance areas.

Rogerio Figurelli


Rogerio Figurelli
2014.04.15
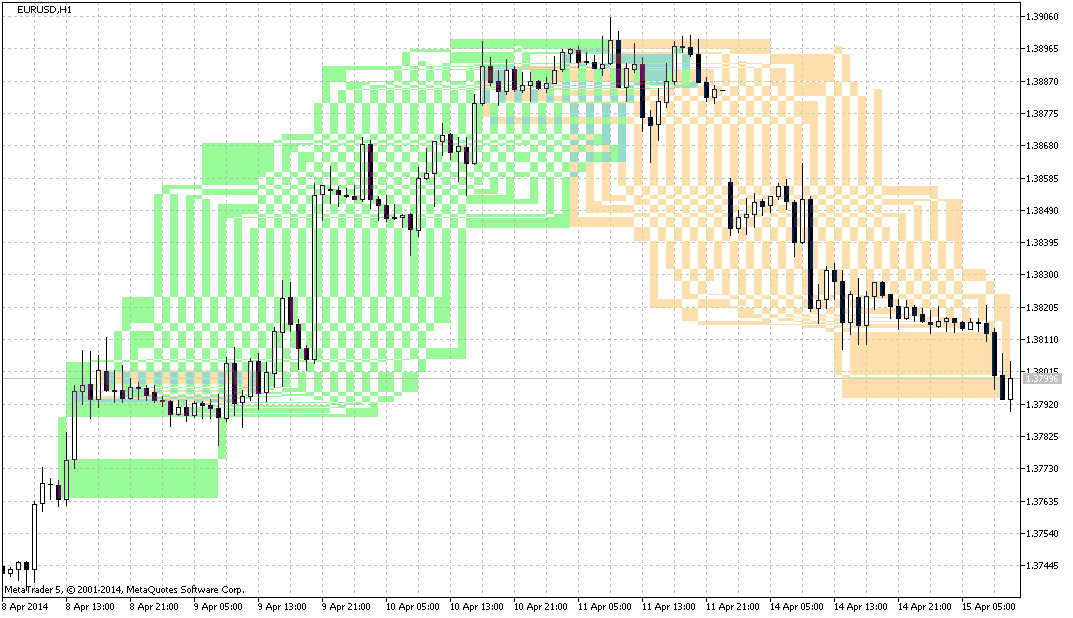
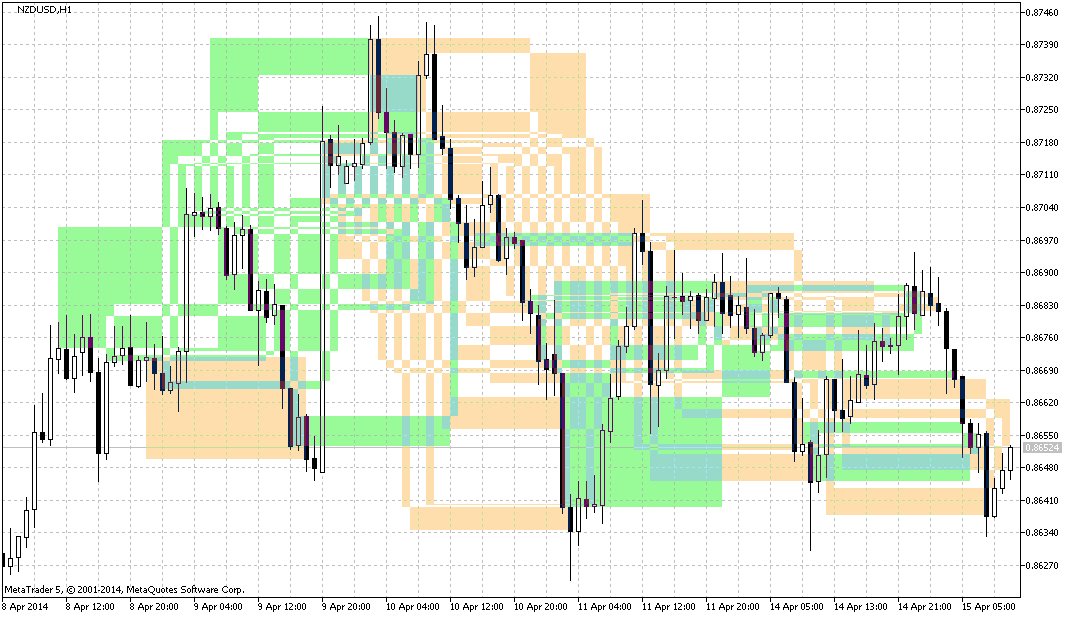
Thanks Jeremy, the main idea is quite simple, create maps based on forces and use brain intuition do the rest. Anyway, the algorithm logic is map colors for bulls and bears scenarios in graph area, instead of traditional indicators based on lines and/or histograms.
Rogerio Figurelli
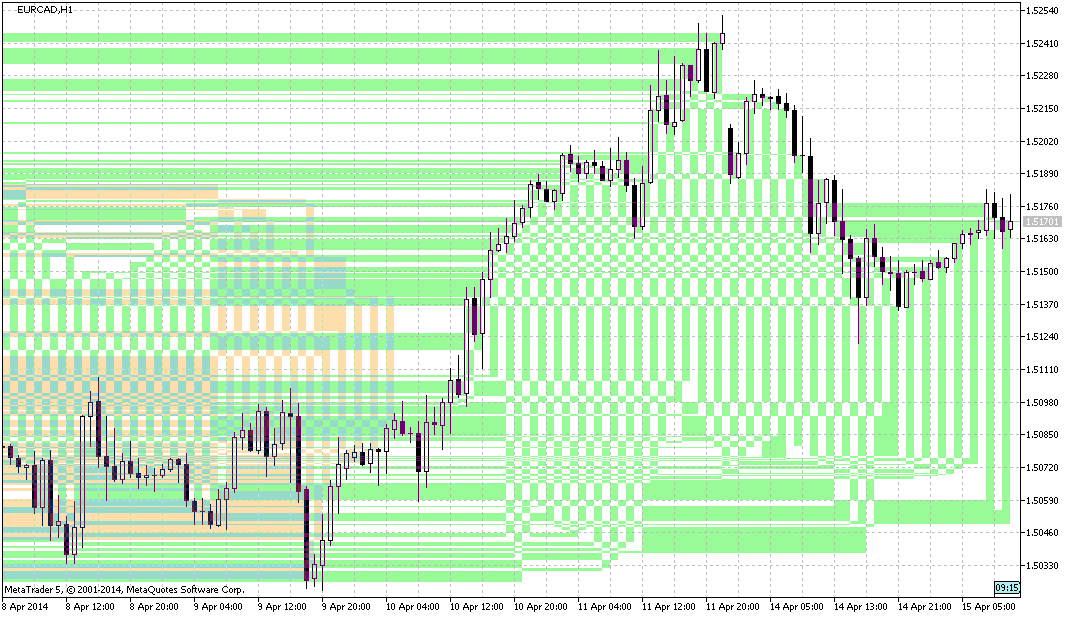
Looking for innovation? These are the first public Trajecta ForceMap screenshots. I created this new kind of indicator to bring new research ideas to this field. Hope you like. Any suggestion are welcome, the idea is bring a new series of indicators showing what no other indicator shows or trader see in their platform.

Rogerio Figurelli
New setup studies for Trajecta Neuron (https://www.mql5.com/en/market/product/3849)
2014.04.14 11:29:39.453 Trajecta Neuron (EURJPY,D1) [ Strategy: 4-Layer - Quality: 80.7% - Pips: 1.6K / 5K bars ]
2014.04.14 11:29:28.501 Trajecta Neuron (EURUSD,M15) [ Strategy: 7-Mutual - Quality: 89.1% - Pips: 239.4 / 5K bars ]
2014.04.14 11:29:26.203 Trajecta Neuron (EURGBP,D1) [ Strategy: 9-Mimic - Quality: 88.9% - Pips: 135.7 / 5K bars ]
2014.04.14 11:29:16.209 Trajecta Neuron (NZDUSD,D1) [ Strategy: 5-Nodes - Quality: 86.5% - Pips: 1.9K / 5K bars ]
2014.04.14 11:29:15.184 Trajecta Neuron (NZDCAD,H1) [ Strategy: 8-Nervous - Quality: 84.0% - Pips: 193.1 / 33K bars ]
2014.04.14 11:29:11.769 Trajecta Neuron (NZDUSD,D1) [ Strategy: 1-Cortex - Quality: 81.3% - Pips: 1.9K / 5K bars ]
2014.04.14 11:29:04.934 Trajecta Neuron (AUDUSD,D1) [ Strategy: 8-Nervous - Quality: 87.5% - Pips: 2.2K / 5K bars ]
2014.04.14 11:28:59.289 Trajecta Neuron (NZDCAD,H4) [ Strategy: 4-Layer - Quality: 84.5% - Pips: 1.3K / 8K bars ]
2014.04.14 11:28:42.818 Trajecta Neuron (NZDUSD,H4) [ Strategy: 4-Layer - Quality: 85.3% - Pips: 1.2K / 23K bars ]
2014.04.14 11:28:38.692 Trajecta Neuron (AUDUSD,D1) [ Strategy: 6-Brain - Quality: 88.1% - Pips: 2.3K / 5K bars ]
2014.04.14 11:28:33.501 Trajecta Neuron (EURUSD,D1) [ Strategy: 9-Mimic - Quality: 90.7% - Pips: 7.4K / 11K bars ]
2014.04.14 11:28:20.806 Trajecta Neuron (EURJPY,M15) [ Strategy: 8-Nervous - Quality: 87.0% - Pips: 626.8 / 50K bars ]
2014.04.14 11:28:11.612 Trajecta Neuron (USDCAD,H1) [ Strategy: 1-Cortex - Quality: 80.1% - Pips: 215.9 / 5K bars ]
2014.04.14 11:28:07.142 Trajecta Neuron (NZDCAD,D1) [ Strategy: 2-Gene - Quality: 81.0% - Pips: 1.5K / 1K bars ]
2014.04.14 11:28:03.477 Trajecta Neuron (AUDJPY,D1) [ Strategy: 10-Model - Quality: 84.2% - Pips: 1.0K / 5K bars ]
2014.04.14 11:28:02.380 Trajecta Neuron (NZDUSD,H4) [ Strategy: 3-Vector - Quality: 81.7% - Pips: 853.7 / 23K bars ]
2014.04.14 11:28:00.665 Trajecta Neuron (EURUSD,H4) [ Strategy: 8-Nervous - Quality: 86.4% - Pips: 117.9 / 5K bars ]
Rogerio Figurelli
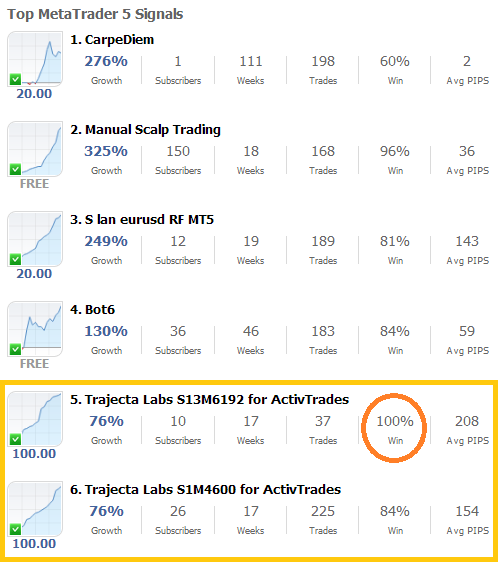
Brothers looking for a better ranking position ... but take care, one of them with 100% Win in 4 months,what is a big risk.

Rogerio Figurelli
Trajecta Elephant FULL14032615 - https://www.mql5.com/en/signals/34461
---------------------------------------------------------------------------------------------------------------------------
Trajecta SOS - Signal Open Setup (generated by TrajectaLabs.com at 2014.03.26 19:43
Copy Trajecta SOS to setup the same Inputs from the original Trajecta Labs trading signal Expert Advisor
Online Ranking: http://www.trajectalabs.com/elephant
---------------------------------------------------------------------------------------------------------------------------
Expert Advisor: Trajecta Elephant G4 Build 005 - Version: FULL
Original Trading Signal: Trajecta Elephant - https://www.mql5.com/en/signals/34461
Trajecta SOS: FULL,EURJPY,EURUSD,CHFJPY,EURJPY,GBPJPY,scalper: false,strategy: 5,adv_strategy: 7530,risk_profile: 3,risk_strategy: 8474,starting_lot: 0.99,maximal_lot: 5.0
---------------------------------------------------------------------------------------------------------------------------
---------------------------------------------------------------------------------------------------------------------------
Trajecta SOS - Signal Open Setup (generated by TrajectaLabs.com at 2014.03.26 19:43
Copy Trajecta SOS to setup the same Inputs from the original Trajecta Labs trading signal Expert Advisor
Online Ranking: http://www.trajectalabs.com/elephant
---------------------------------------------------------------------------------------------------------------------------
Expert Advisor: Trajecta Elephant G4 Build 005 - Version: FULL
Original Trading Signal: Trajecta Elephant - https://www.mql5.com/en/signals/34461
Trajecta SOS: FULL,EURJPY,EURUSD,CHFJPY,EURJPY,GBPJPY,scalper: false,strategy: 5,adv_strategy: 7530,risk_profile: 3,risk_strategy: 8474,starting_lot: 0.99,maximal_lot: 5.0
---------------------------------------------------------------------------------------------------------------------------
Rogerio Figurelli
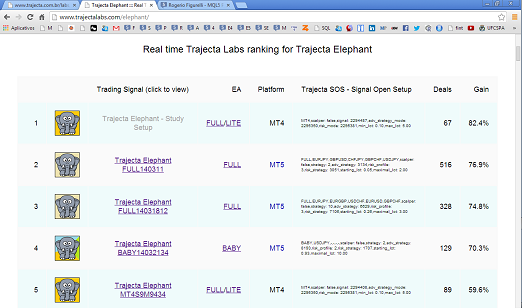

Introducing Trajecta SOS - Signal Open Setup ::: Real Time Ranking
Now you can access our Trajecta Elephant trading signals real time ranking and copy the setup even before the signal published at MQL5 (Setup Study).
http://www.trajectalabs.com/elephant/
Now you can access our Trajecta Elephant trading signals real time ranking and copy the setup even before the signal published at MQL5 (Setup Study).
http://www.trajectalabs.com/elephant/

Rogerio Figurelli


Trajecta Elephant (FULL Version) Updated to Version 4.7 - https://www.mql5.com/en/market/product/3320
Two new basic strategies (just for FULL and BRAIN versions):
13-TRIX Variation 1
14-TRIX Variation 2
Also we created 4 new Trajecta Labs to test this strategies at http://www.trajectalabs.com/elephant/
Two new basic strategies (just for FULL and BRAIN versions):
13-TRIX Variation 1
14-TRIX Variation 2
Also we created 4 new Trajecta Labs to test this strategies at http://www.trajectalabs.com/elephant/

Correos.14 aguilar
2014.03.24
Just learning so dont understand too much about this things so gonna read it to see what is this about. Thank you for this information
Rogerio Figurelli
Added poll Do you believe that KISS (Keep It Short and Simple) principle works for the market?
-
19% (10)
-
19% (10)
-
26% (14)
-
19% (10)
-
19% (10)
Total voters: 54
Rogerio Figurelli
New trading signal setup:
-------------------------------------------------------------------------------------------------------------------------------------------------
Trajecta SOS - Signal Open Setup (generated by TrajectaLabs.com at 2014.03.21 18:43)
Copy Trajecta SOS to setup the same Inputs from the original Trajecta Labs trading signal Expert Advisor
Online Ranking: http://www.trajectalabs.com/elephant
-------------------------------------------------------------------------------------------------------------------------------------------------
Expert Advisor: Trajecta Elephant G4 Build 004 - Version: BABY
Original Trading Signal: Trajecta Elephant - https://www.mql5.com/en/signals/33796
Trajecta SOS: BABY,USDJPY,-,-,-,-,scalper: false,strategy: 2,adv_strategy: 8193,risk_profile: 2,risk_strategy: 1707,starting_lot: 0.93,maximal_lot: 10.00
-------------------------------------------------------------------------------------------------------------------------------------------------
-------------------------------------------------------------------------------------------------------------------------------------------------
Trajecta SOS - Signal Open Setup (generated by TrajectaLabs.com at 2014.03.21 18:43)
Copy Trajecta SOS to setup the same Inputs from the original Trajecta Labs trading signal Expert Advisor
Online Ranking: http://www.trajectalabs.com/elephant
-------------------------------------------------------------------------------------------------------------------------------------------------
Expert Advisor: Trajecta Elephant G4 Build 004 - Version: BABY
Original Trading Signal: Trajecta Elephant - https://www.mql5.com/en/signals/33796
Trajecta SOS: BABY,USDJPY,-,-,-,-,scalper: false,strategy: 2,adv_strategy: 8193,risk_profile: 2,risk_strategy: 1707,starting_lot: 0.93,maximal_lot: 10.00
-------------------------------------------------------------------------------------------------------------------------------------------------
:
