
|
15+ years
experience
|
13
products
|
101
demo versions
|
|
48
jobs
|
0
signals
|
0
subscribers
|
Education: engineer-physicist, with specialization - automatic control systems.
Make programs on C++ for about 25 years. At now - I use C# only.
I'm interested in trading from 2005.
From 2013 - FORTS only (no FOREX). From 2024 - Cripto, too
Areas of interests: Algo-Trading, Stat Arbitrage systems, some kind of Adaptive Trading systems, Patterns Recognition systems, Dynamic Chaos Theory, Fractal Analizing, EconoPhysics and etc.
I consider all suggestions to take part in a serious and earnest project. I consider all interesting ideas too.

Dmitriy Skub


· 18
[Deleted]
2015.01.16
[Deleted]
Nikolay Svintsov
2015.04.11
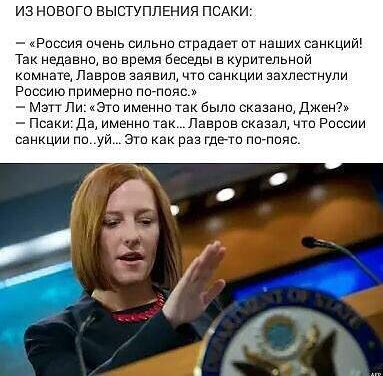
))) расмешили))) пусть так думают, либо пусть изучают русский язык, чтобы быть в тренде с Россией
Dmitriy Skub

· 6
Dmitriy Skub
2014.12.05
Вот, елки зеленые! А я пропустил - заработался! Интересно, там двигатели советские стояли?