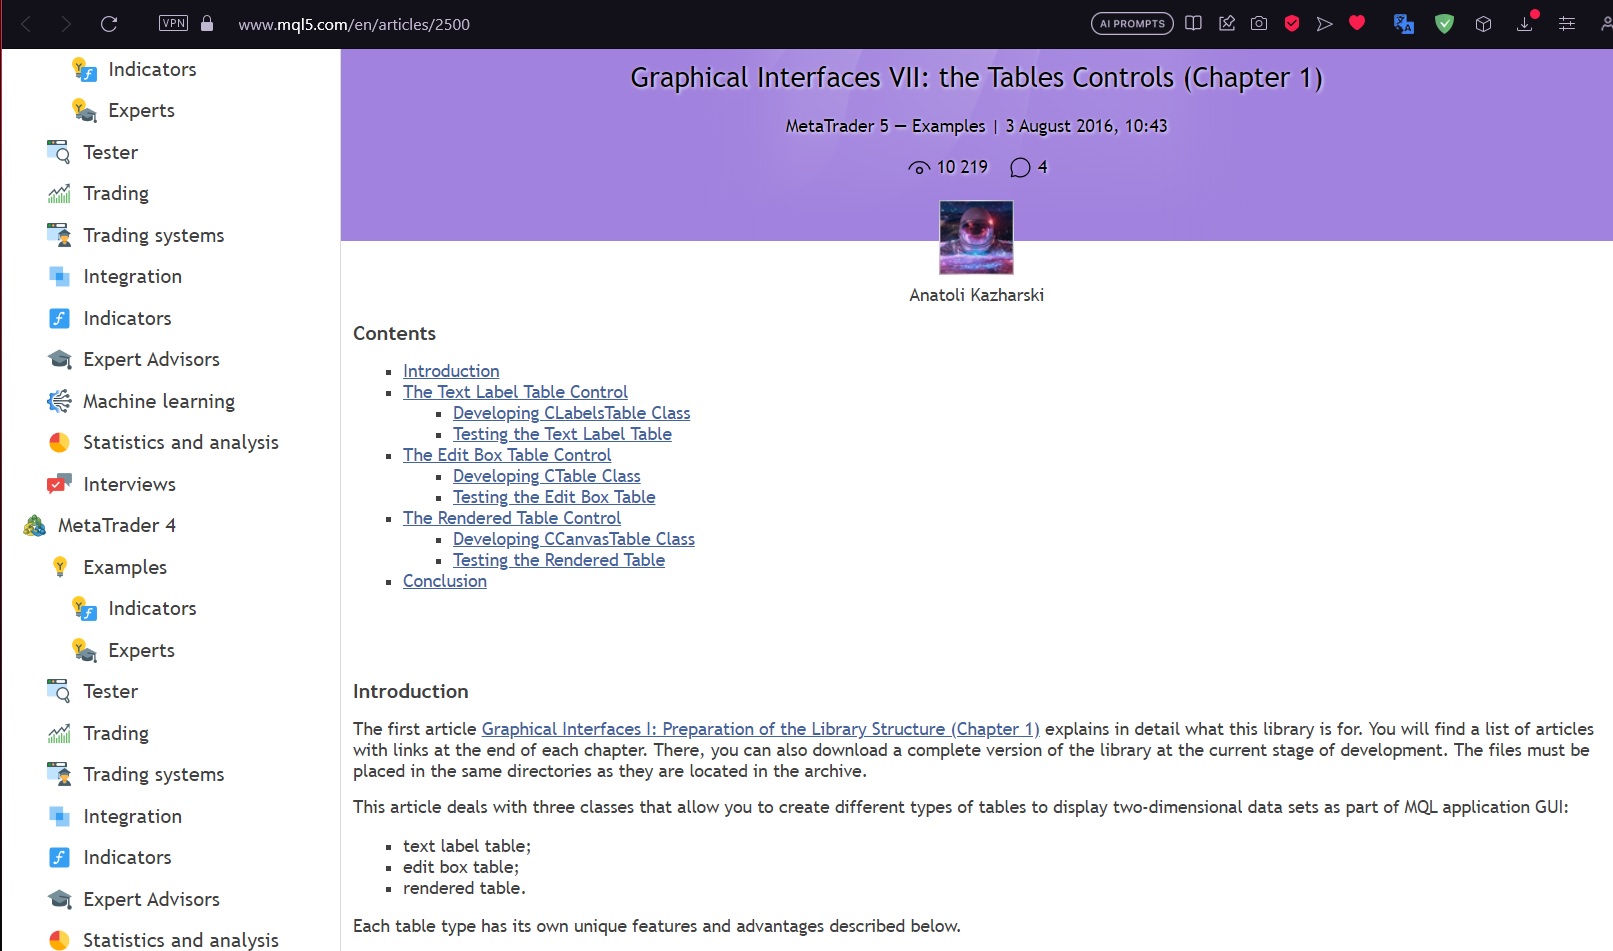
Or perhaps I can use Tables Controls from the MQL5 Standard Lib although I'm programming in MQL4?! There must be easier ways than to write an entire spreadsheet software from scratch, with graphical objects in MQL4.
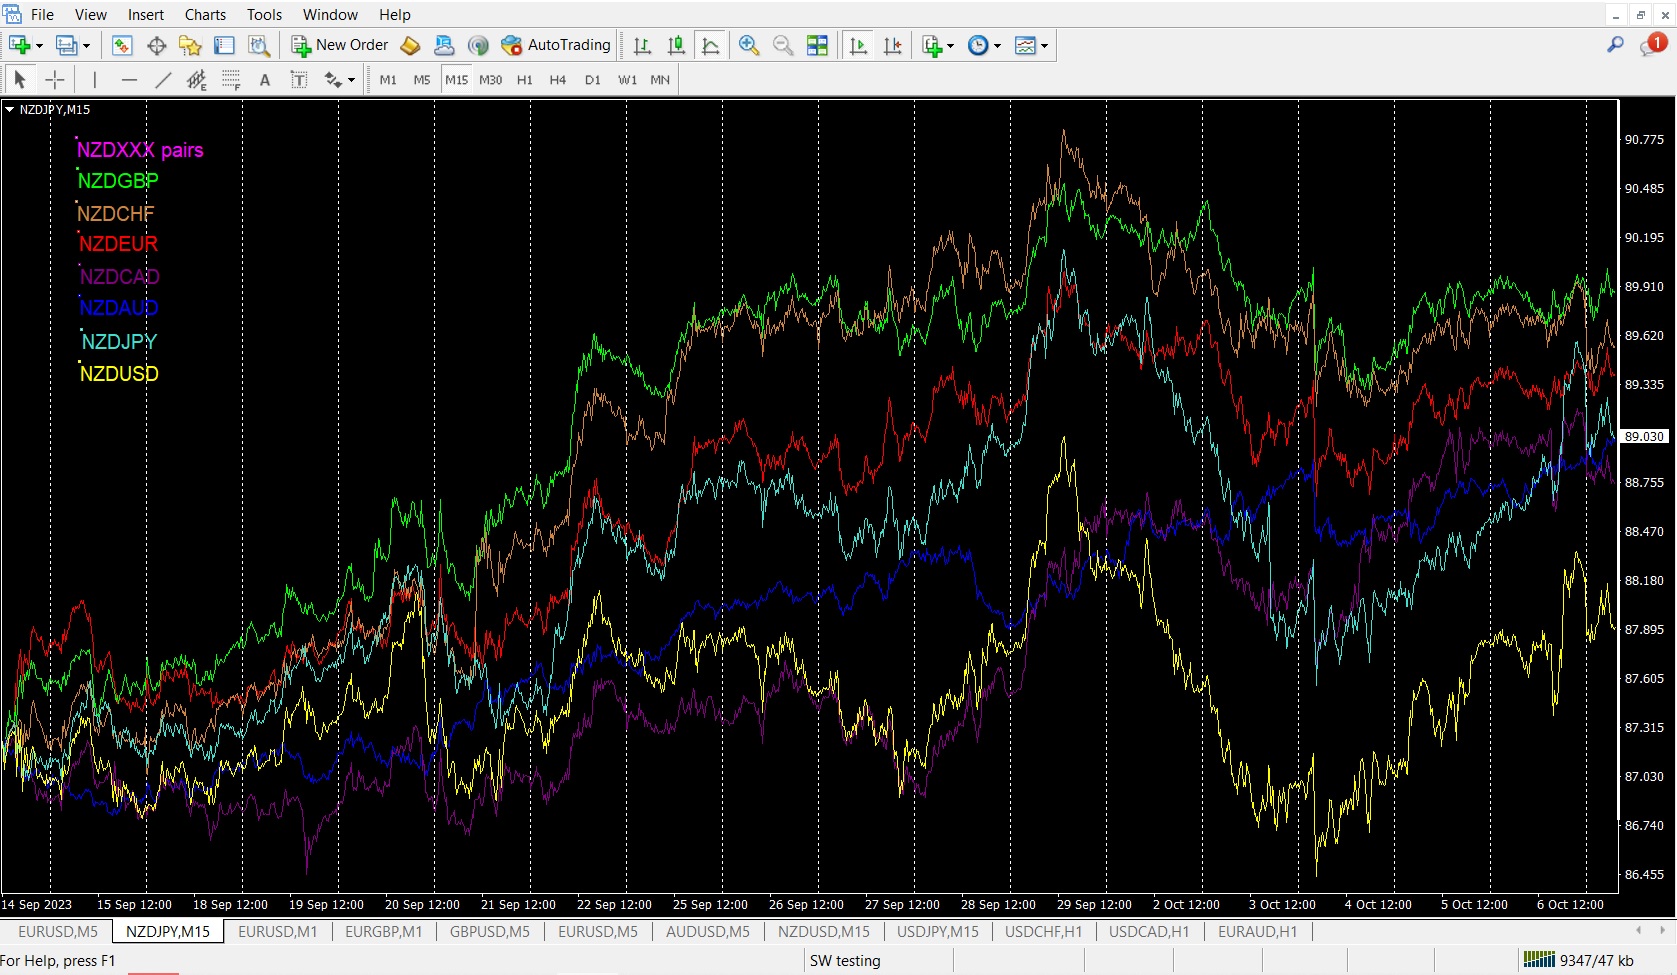
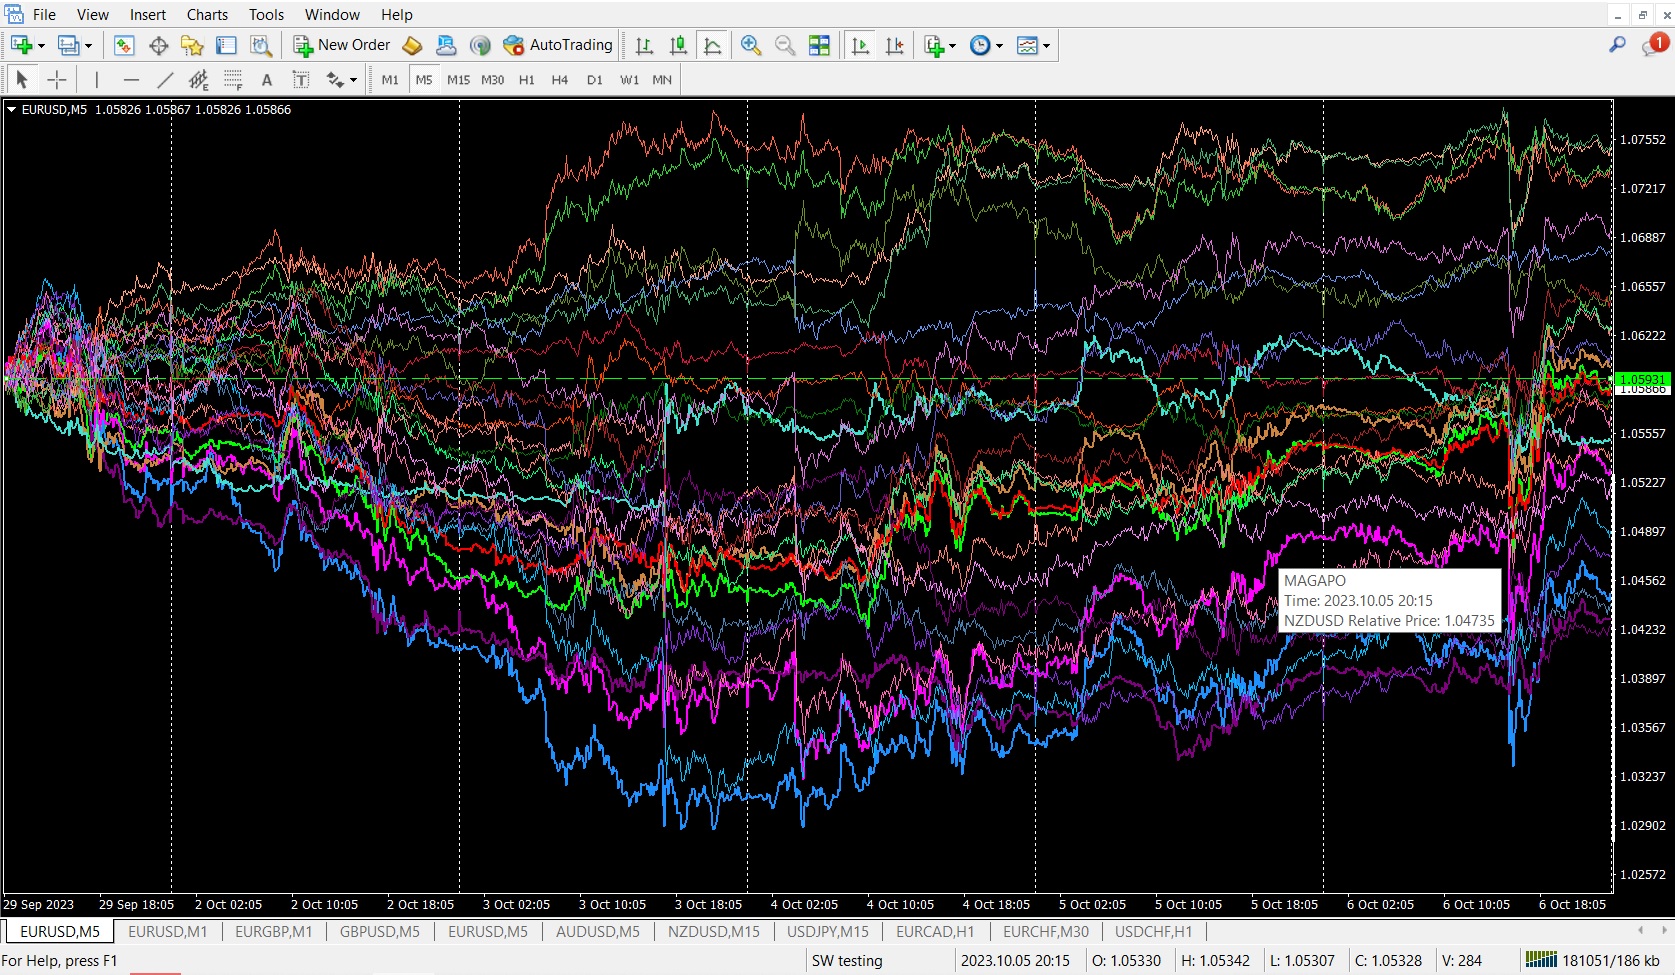
Here's a picture of MAGAPO, as promised. These are the relative changes in the last week, of the 28 main currency pairs made up of USD, EUR, AUD, NZD, CAD, CHF, GBP and JPY. Some of the pairs are inverted, or "mirrored", like for instance USDCHF. It's possible to select which symbols that should be inverted.
It's also possible to display some other lines, like for instance various moving averages.
I'm currently working on a few utilities, mainly for my own use and for learning MQL4. It would be nice to have some people to discuss ideas with, get feedback from etc. but I'm not sure what the best way is. When I posted about one of my utilities in the forum a moderator suggested that I should post in a blog or on the Market page instead. I'm not too keen on starting a blog at the moment. It feels overly ambitious. And I think that my utilities are not mature enough to put on the market. Any suggestions?
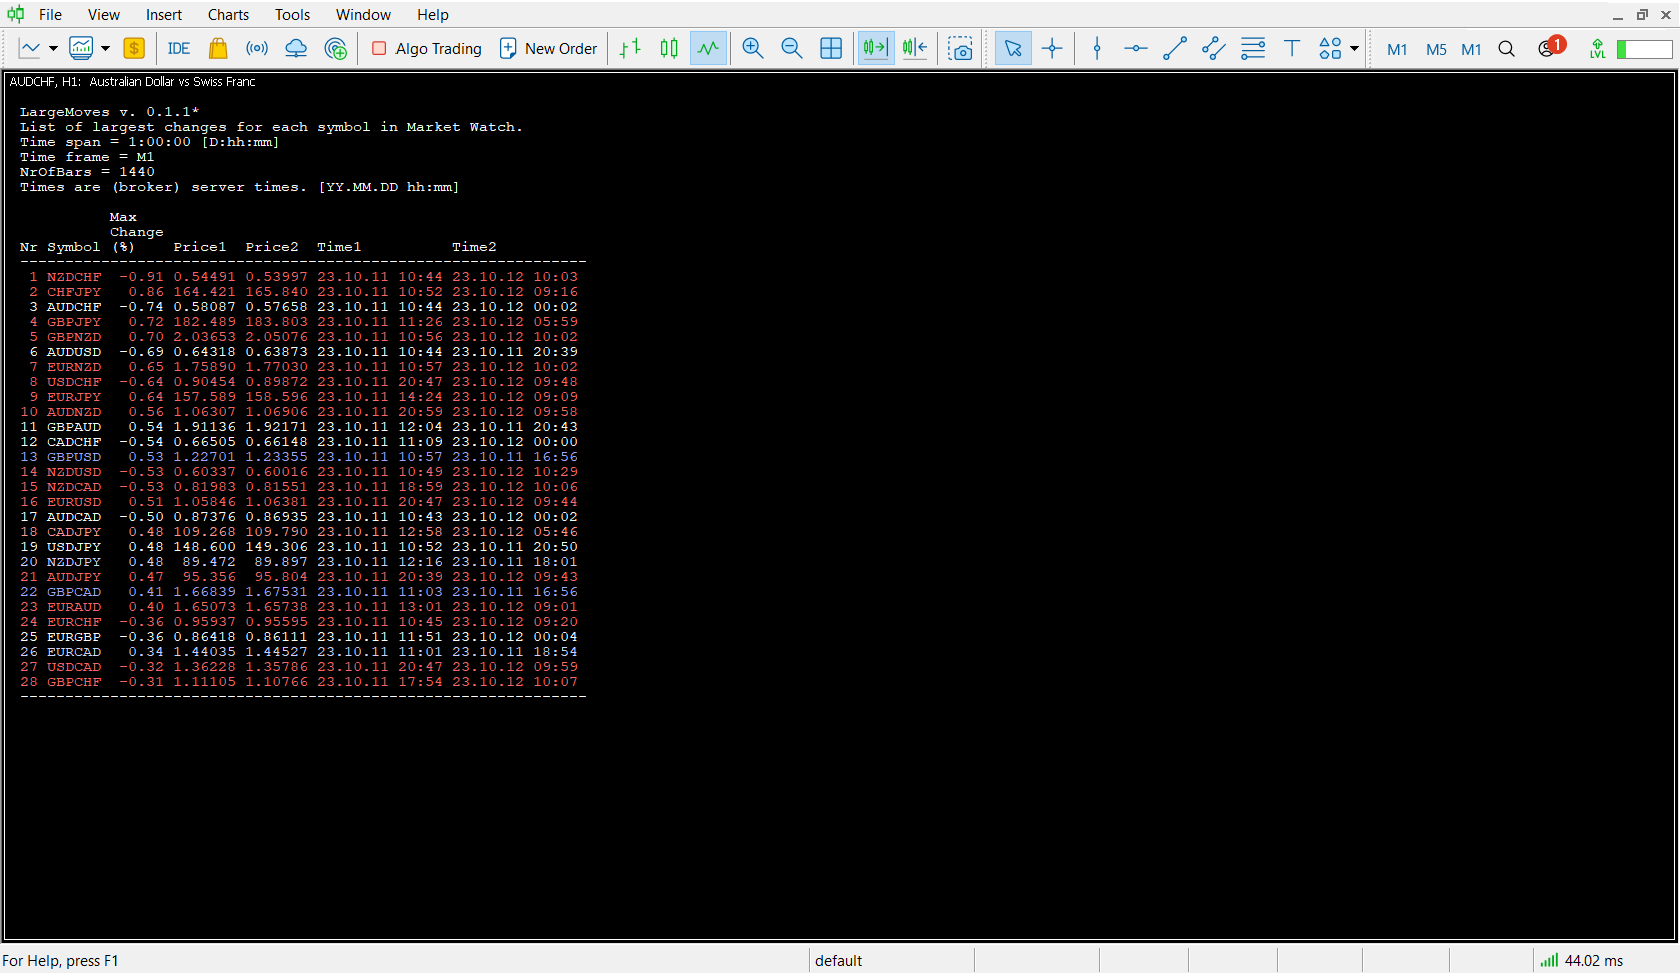
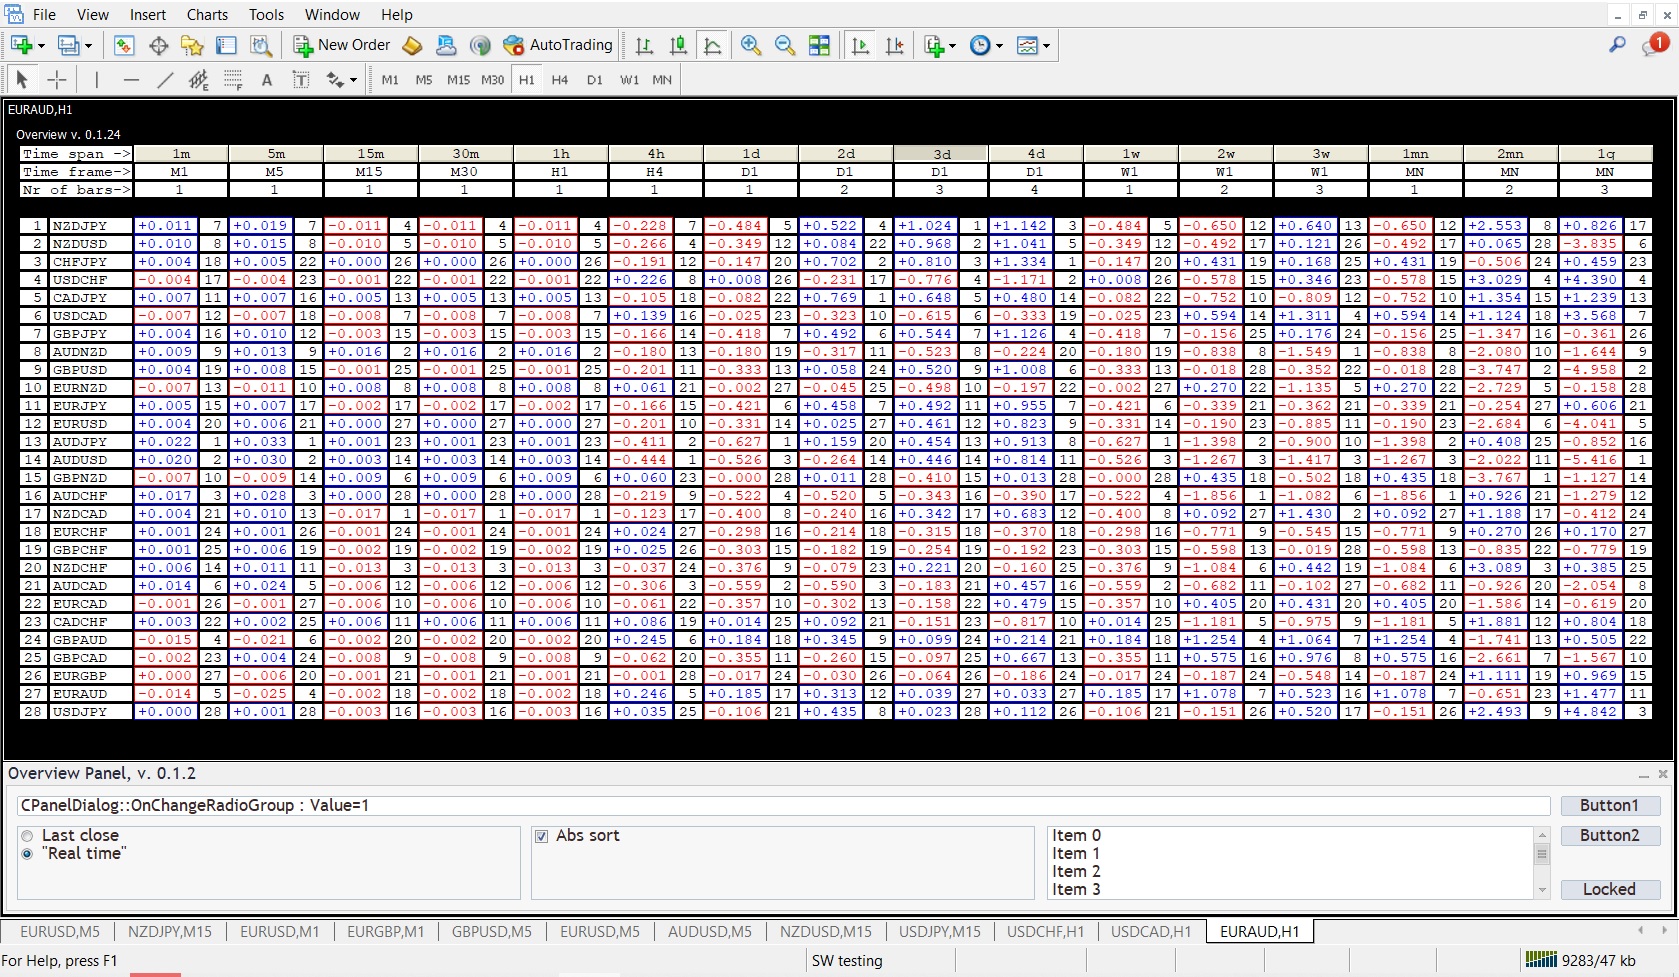
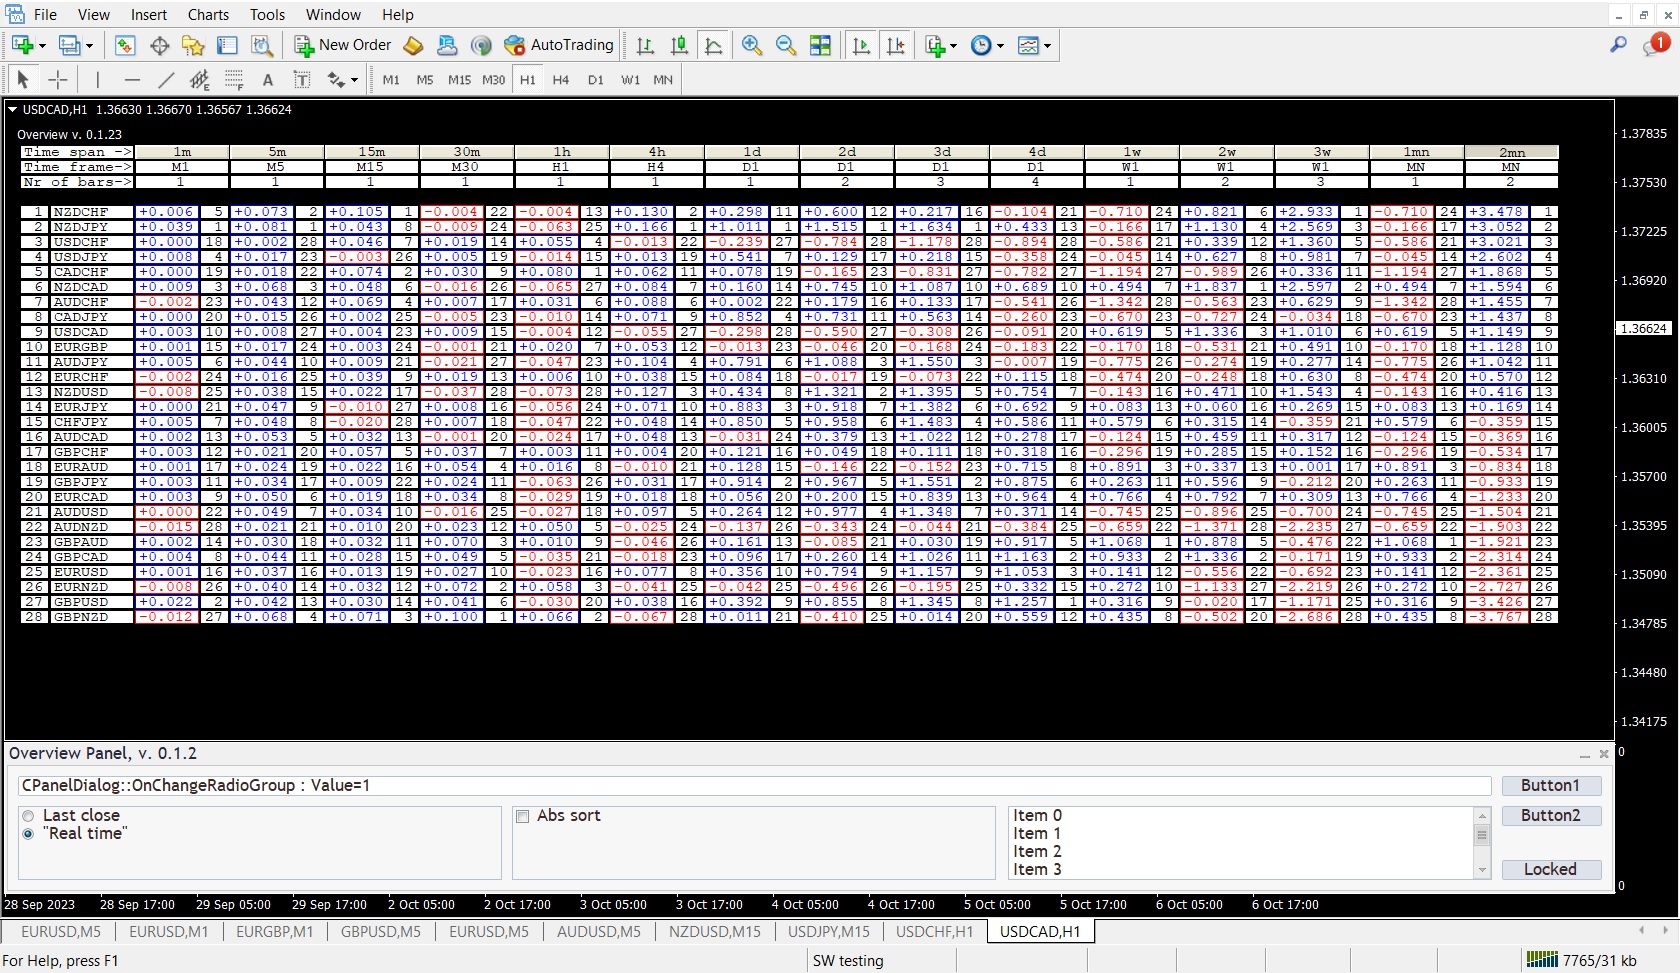
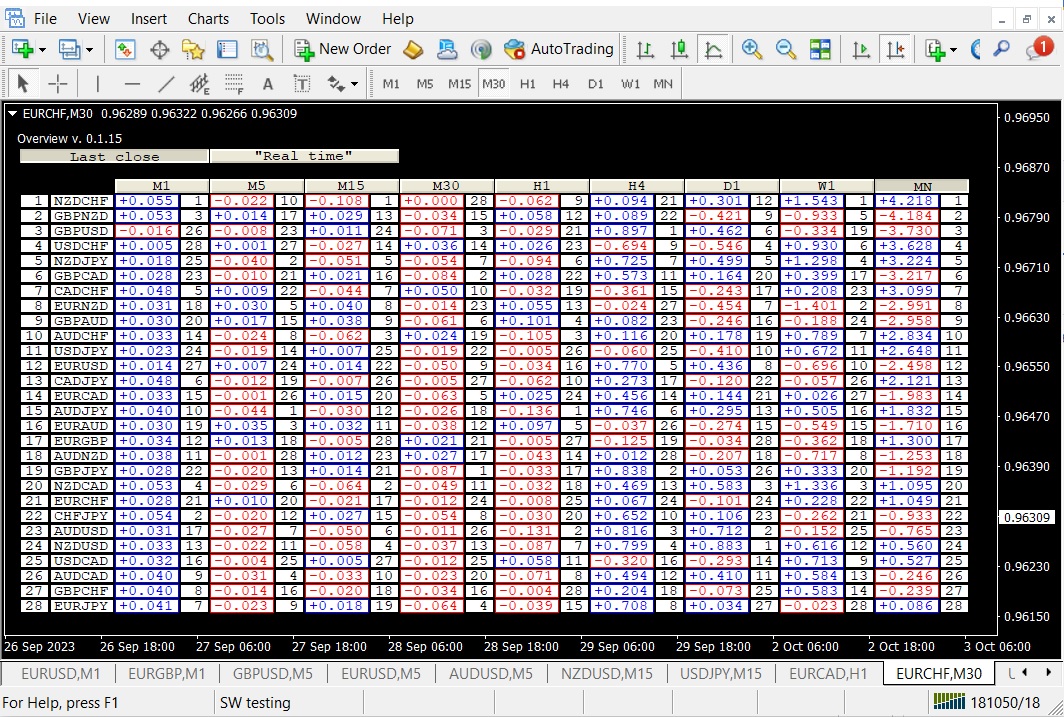
One of the utilities I work on I call "Overview". See picture below. It shows percentage changes for a chosen set of symbols (instruments) on different time frames. The set of symbols is selected from the first 28 symbols in the Market Watch window. It's possible to sort the table on size of change in each time frame. For each time frame there are also ranking position values displayed, beside the change values.
Another utility I work on I call MAGAPO. Among other things, it graphically shows relative changes between different symbols. Since this format only allows one picture per message I'll post a picture of MAGAPO in the following message.