Jesus Aldana / Profile
- Information
|
8+ years
experience
|
0
products
|
0
demo versions
|
|
0
jobs
|
0
signals
|
0
subscribers
|
Jesus Aldana is an Independent Trader who is dedicated full time in Financial Markets, his major area of work are technical swing trading in Commodities and Forex. Most analysis are accompanied with Fundamental information such as data release and recent news. He has studied many financial indicators in order to have a better understanding of market trend and also read several books from relevant traders such as M Douglas, A Elder etc.
Friends
7
Requests
Outgoing
Jesus Aldana


Under the past weeks I've been posting a dollar reversal scenario, this week we are closer to that output. EUR/USD -0.10% broke a 6 month support uptrend on late September. Oscilators on 1W chart were showing enough strengh to break support line and it happend...
Jesus Aldana


Under the past weeks I've been posting a dollar reversal scenario (https://www.investing.com/analysis/us-index-brent-stocks-weekly-analysis-200217789), this week we are closer to that output. US Index broke a 6 month resistance downtrend on late September...
Jesus Aldana

Jesus Aldana
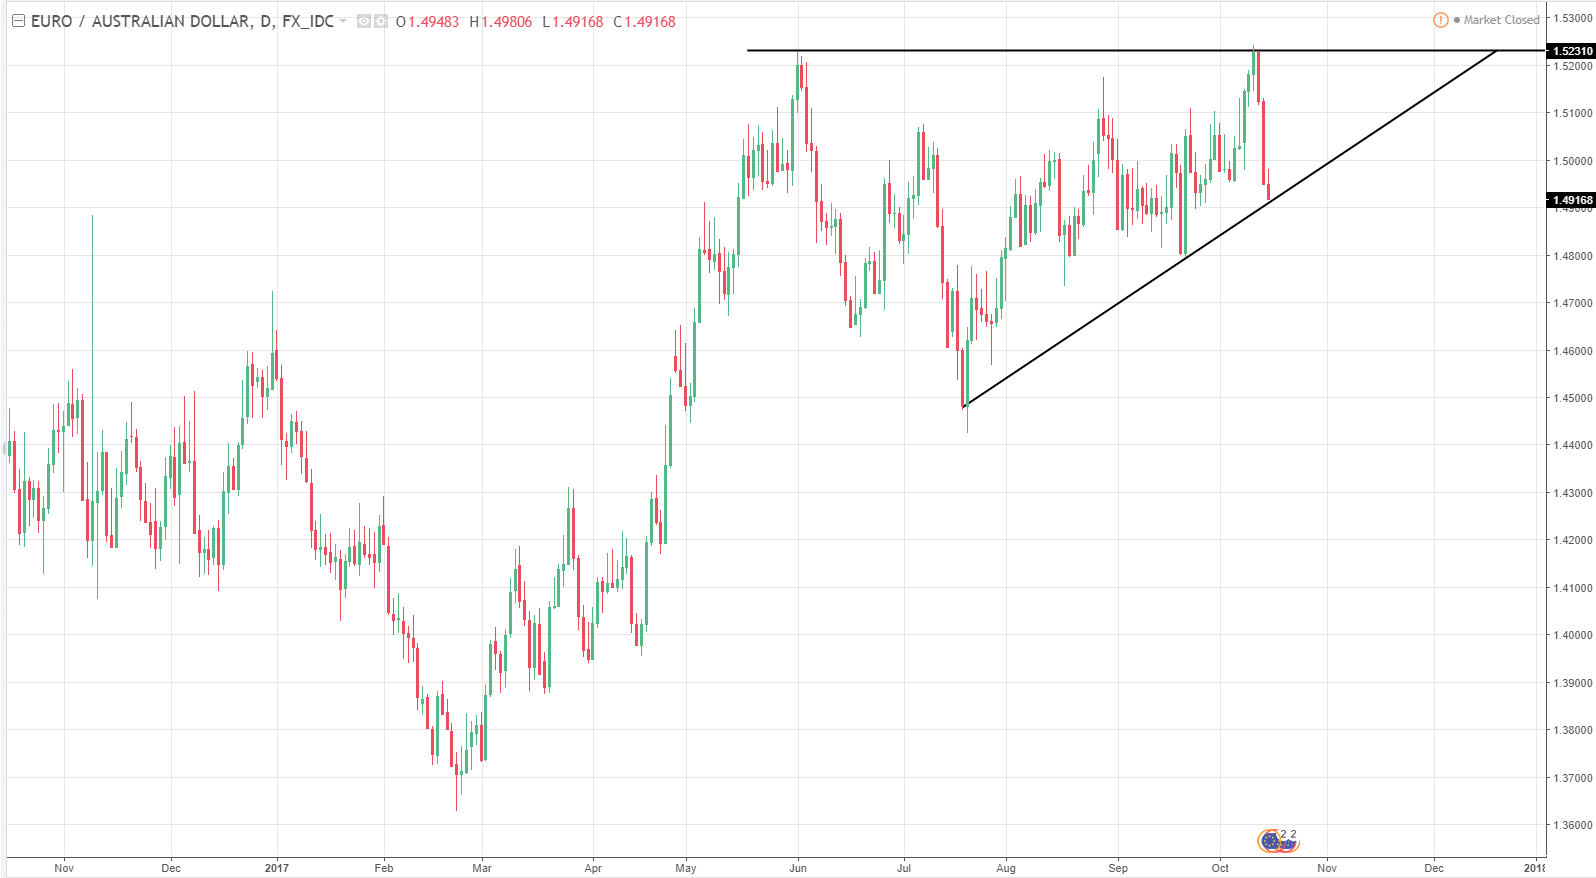
Supporting a Euro -0.10% Reversal. EUR/AUD rallied to resistance 1.523, however in my last week post I stated technical indicators didn't support a breakout. This week we saw it happen, price reverted to 1.491 on only two days. On a daily chart an ascending triangle is formed. Time will tell if it has enough strength to break support, or if it will return back to resistance and break it.
For more analysis visit https://www.investing.com/members/200755314
For more analysis visit https://www.investing.com/members/200755314
Jesus Aldana

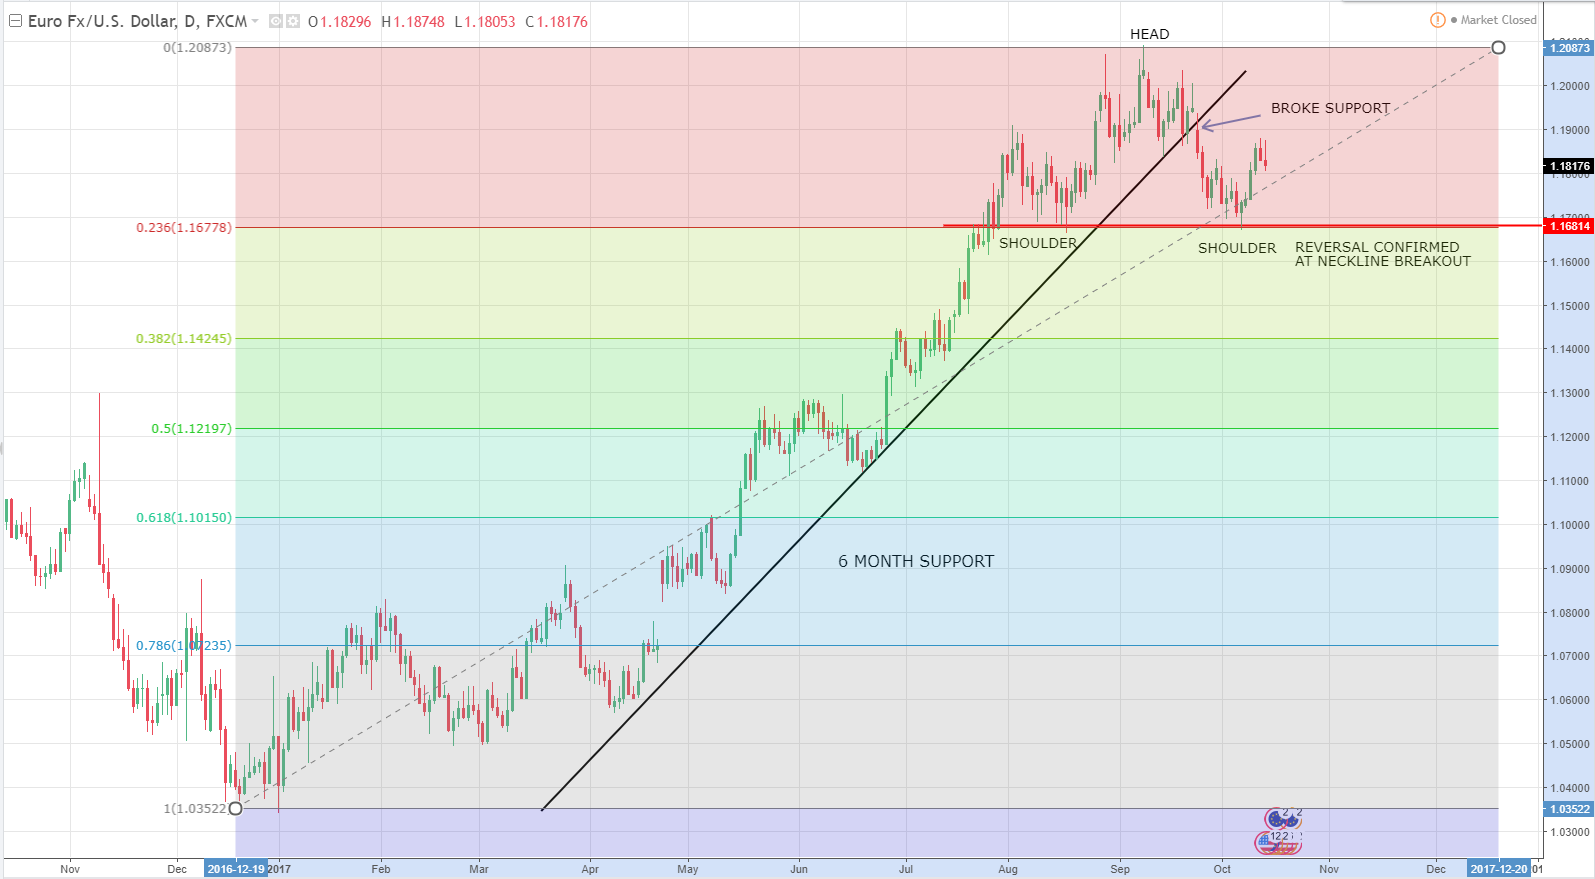
Under the past weeks I've been posting a dollar reversal scenario, this week we are closer to that output. EUR/USD broke a 6 month support uptrend on late September. Oscilators on 1W chart were showing enough strengh to break support line and it happend. It rallied and found support at August Peak defore correcting.
On this week a Head & Shoulders pattern was brought out into the light. Although a reversal is not yet confirmed until price manages to break neckline at 1.168. Signs of reversal are already piling up:
6 Month Support Broken late September
Rally to August Peak
Inverted Head & Shoulder pattern showed up this week
Inverted hammer candle on Friday 13th
Economic Data support a stronger dollar: ISM, PMI, ADP NFP, Jobless Claims, Unemployment Rate, PPI
There are enough signs at this stage that support a US Dollar -0.05% reversal. However time will tell if this is just a false breakout which leads to further deterioration, or a neckline breakout is confirmed. Fed Interest Rates are strongly driving dollar sentiment, along with NK tensions.
For more analysis visit https://www.investing.com/members/200755314
Jesus Aldana

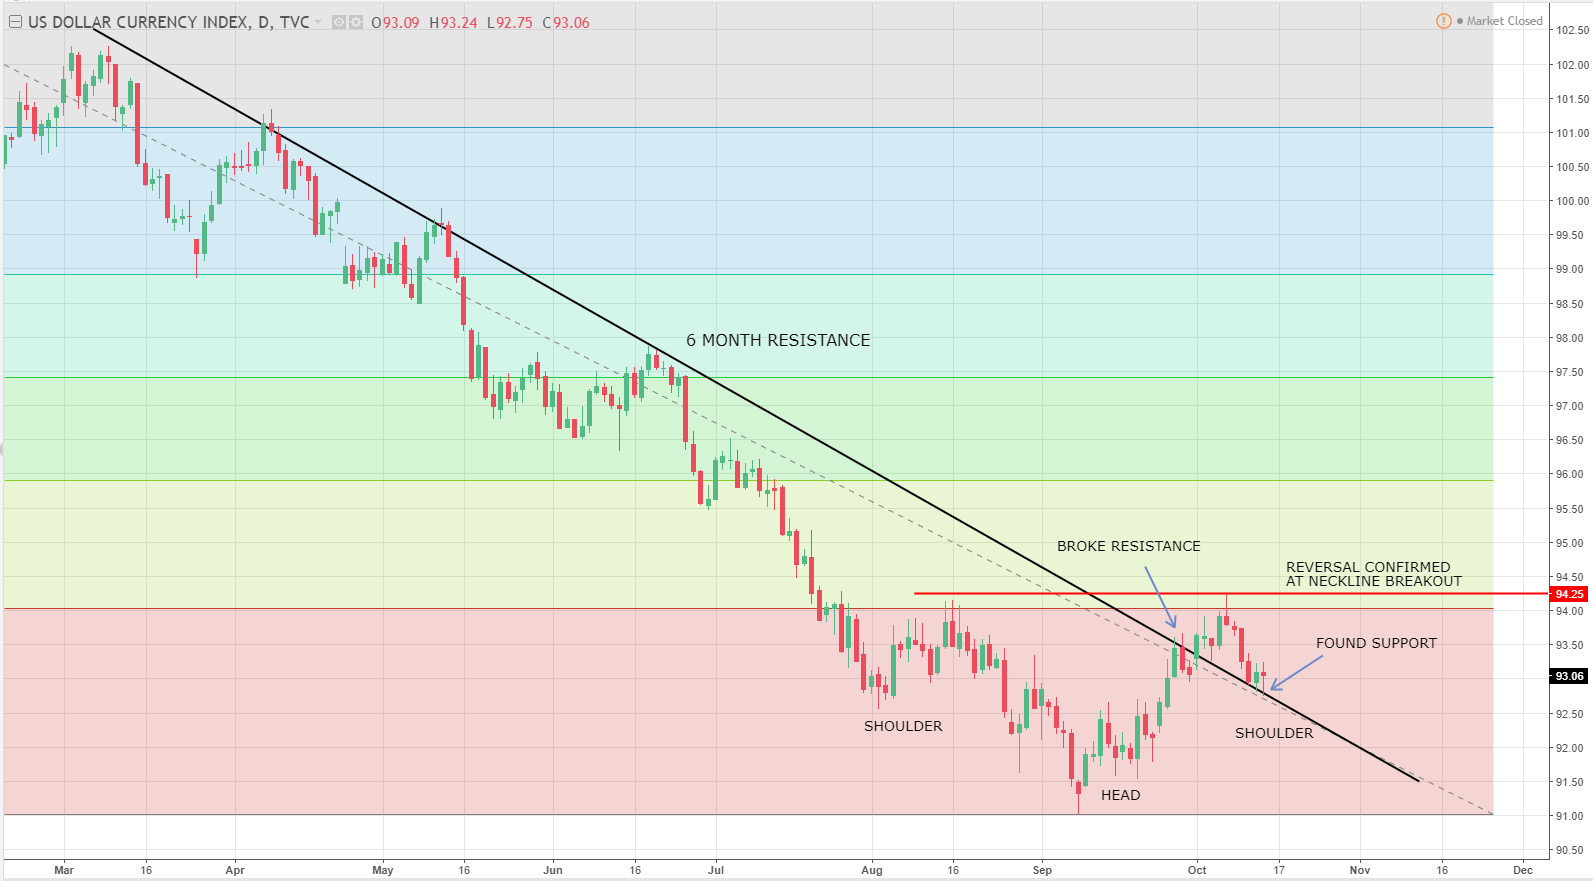
Under the past weeks I've been posting a dollar reversal scenario ( https://www.investing.com/analysis/us-index-brent-stocks-weekly-analysis-200217789), this week we are closer to that output. US Index broke a 6 month resistance downtrend on late September. Oscillators on 1W chart were showing enough strength to break resistance line and it happened. It rallied four straight weeks and found resistance at August Peak before correcting.
On this week an inverted Head & Shoulders pattern was brought out into the light. Although a reversal is not yet confirmed until price manages to break neckline at 94.25. Signs of reversal are already piling up:
6 Month Resistance Broken late September
Rally to August Peak
Support found this week
Inverted Head & Shoulder pattern showed up this week
Hammer candle on Friday 13th
Economic Data support a stronger dollar: ISM, PMI, ADP NFP, Jobless Claims, Unemployment Rate, PPI
There are enough signs at this stage that support a US Dollar reversal. However time will tell if this is just a false breakout which leads to further deterioration, or a neckline breakout is confirmed. Fed Interest Rates are strongly driving dollar sentiment, along with NK tensions.
For more analysis visit https://www.investing.com/members/200755314
Jesus Aldana
Weekly Analysis on US Index, Brent, Ford, Intel, Apple, Costo Follow me for weekly videos
https://youtu.be/zK6NJKlk-_s
https://youtu.be/zK6NJKlk-_s
: