• Overview
  • Reviews
  • Comments (2)

Parabolic Breakout Scanner Pro

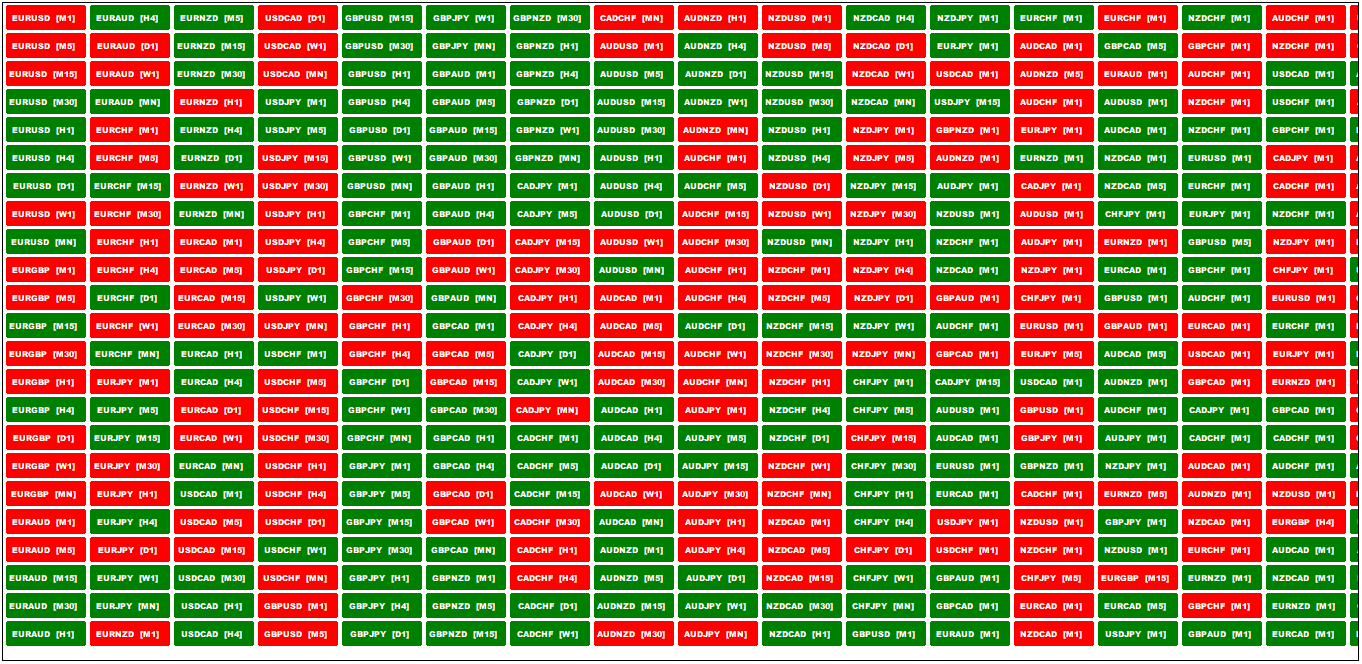
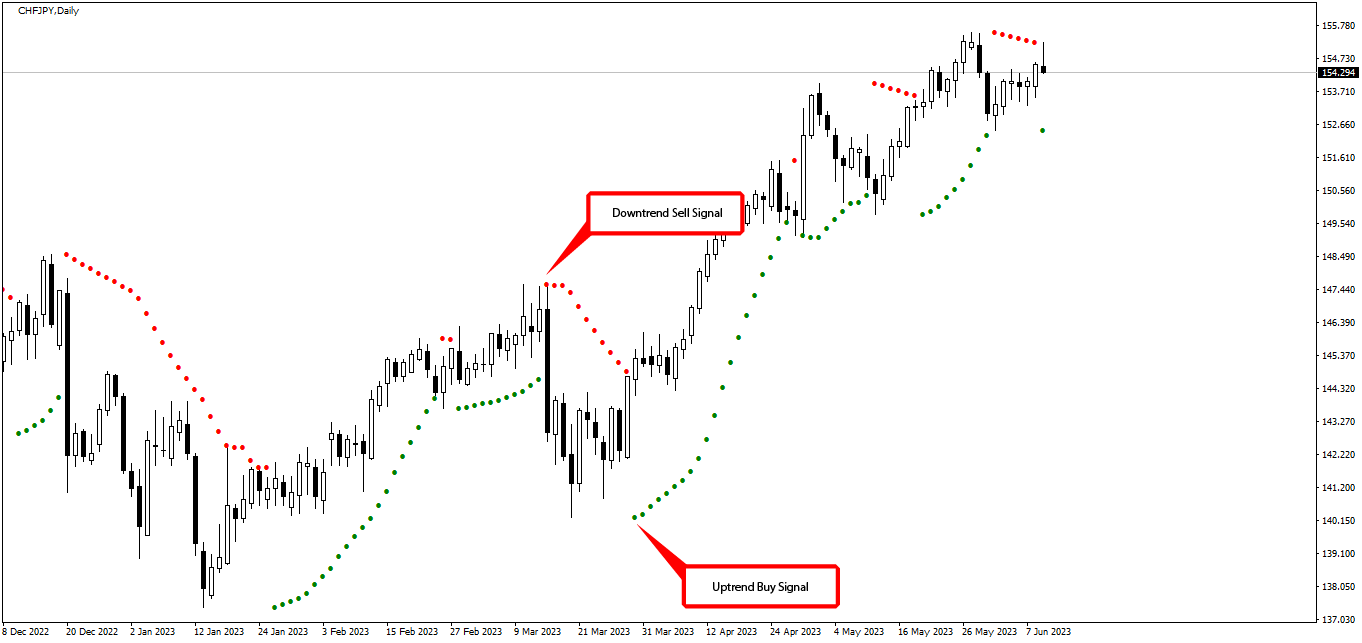
Experience the power of the Parabolic Breakout Scanner Pro an advanced multisymbol and multitimeframe indicator that will transform your trading journey. With unparalleled accuracy, this indicator enables you to identify SAR breakouts and receive timely alerts for optimal entry and exit points. Discover the convenience of a user friendly dashboard, customizable parameters, automated chart opening, and a comprehensive alert system that keeps you connected to the market.

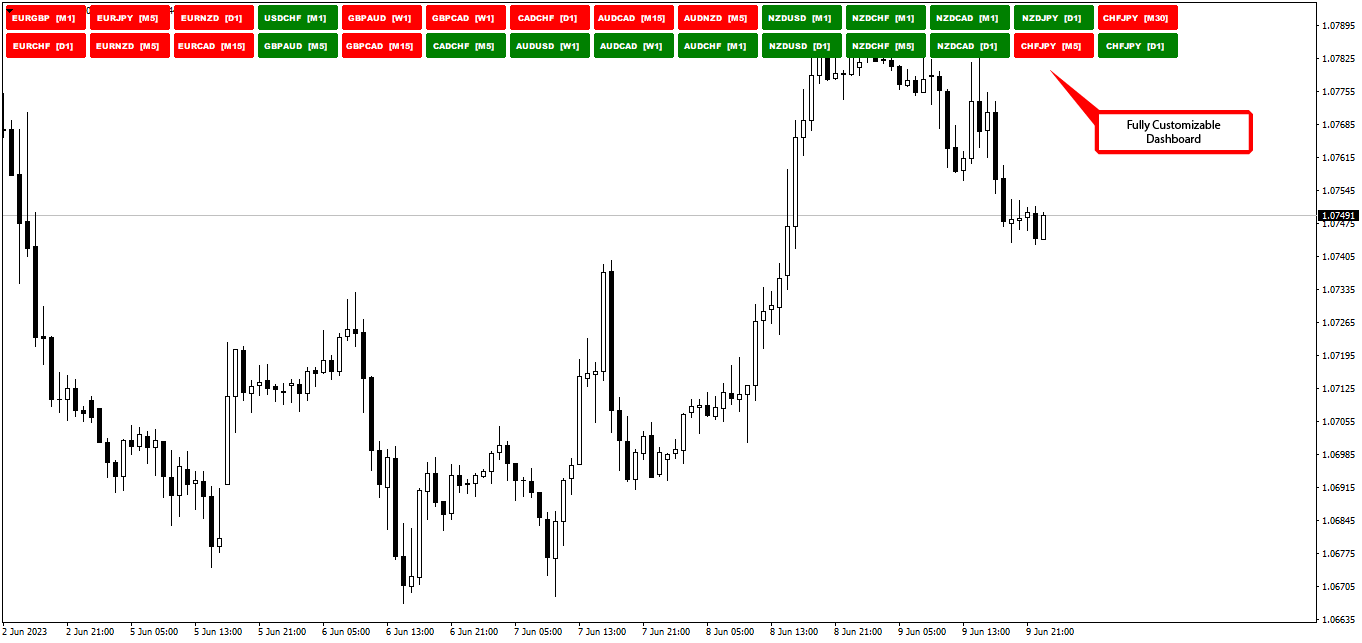
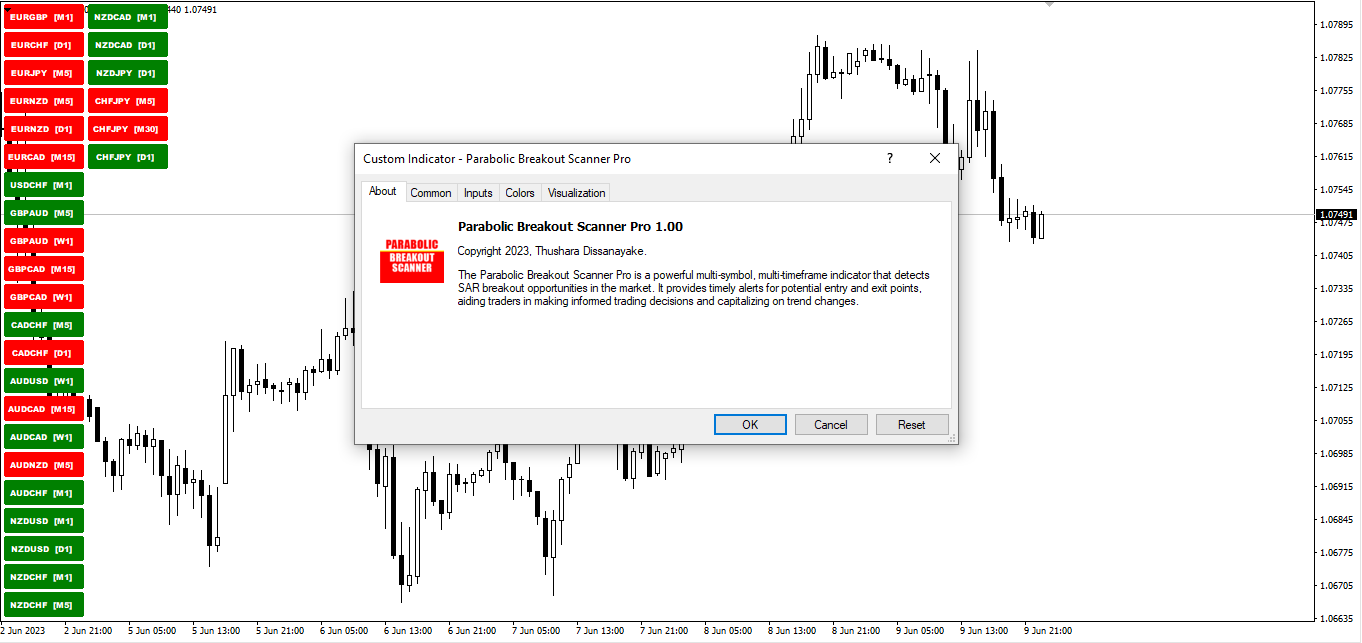
The Parabolic Breakout Scanner Pro is designed to empower traders with its exceptional capabilities. With its ability to scan and analyze multiple currency pairs and timeframes simultaneously, this powerful indicator provides you with a holistic view of the market landscape. Seamlessly navigate through trading opportunities and make informed decisions with ease, thanks to our comprehensive dashboard that offers a clear overview of potential trades.

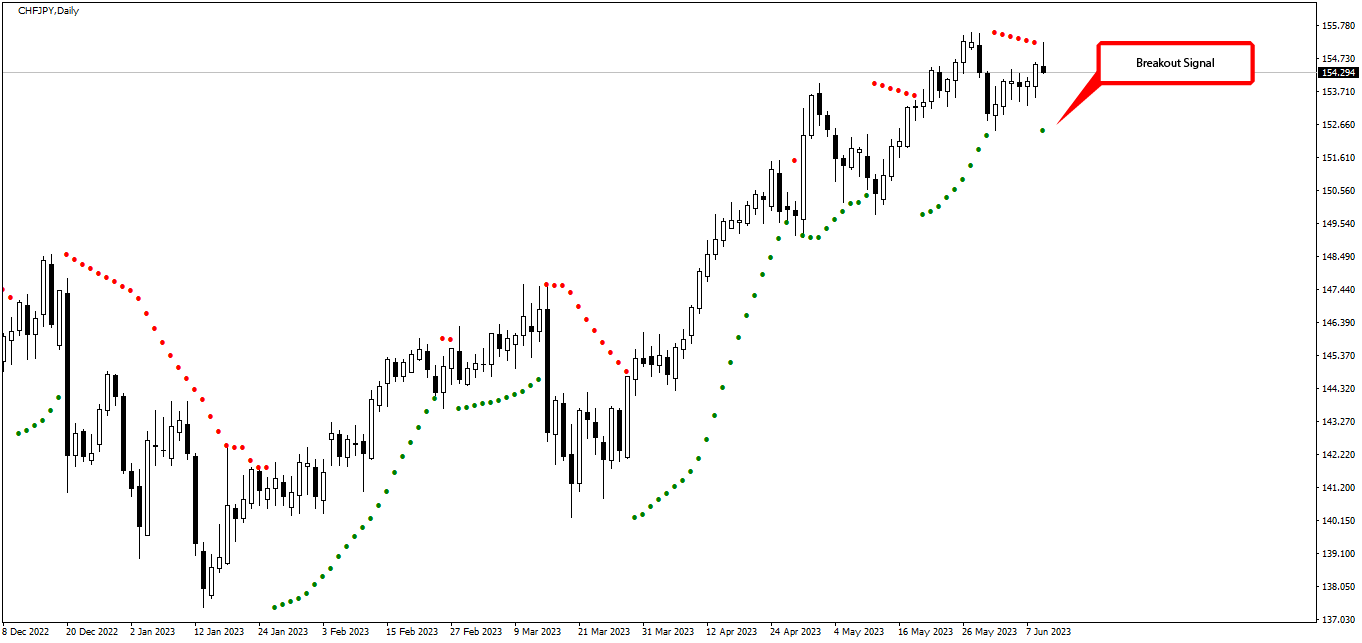
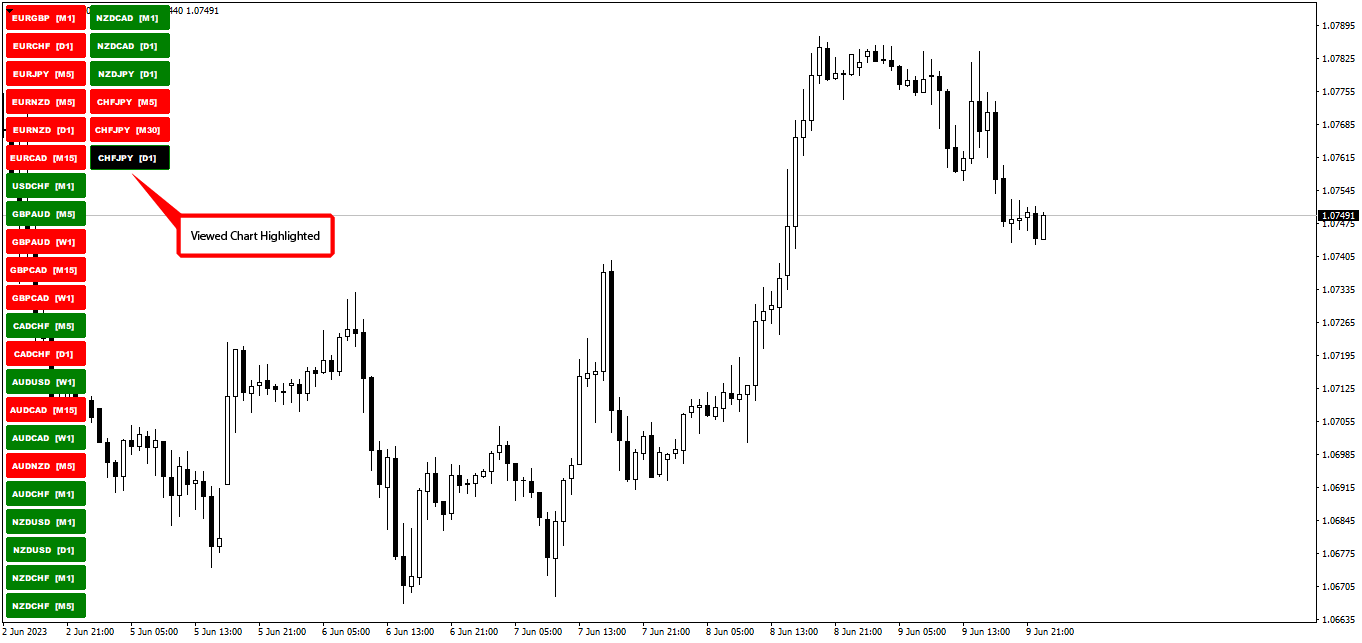
Simplify your trading experience with our interactive button interface, which grants you effortless access to detailed chart analysis. Delve deeper into market trends, analyze patterns, and uncover valuable insights, all with the click of a button. Say goodbye to manual chart opening as our automatic chart opening feature takes care of the process for you, ensuring a seamless and efficient analysis.

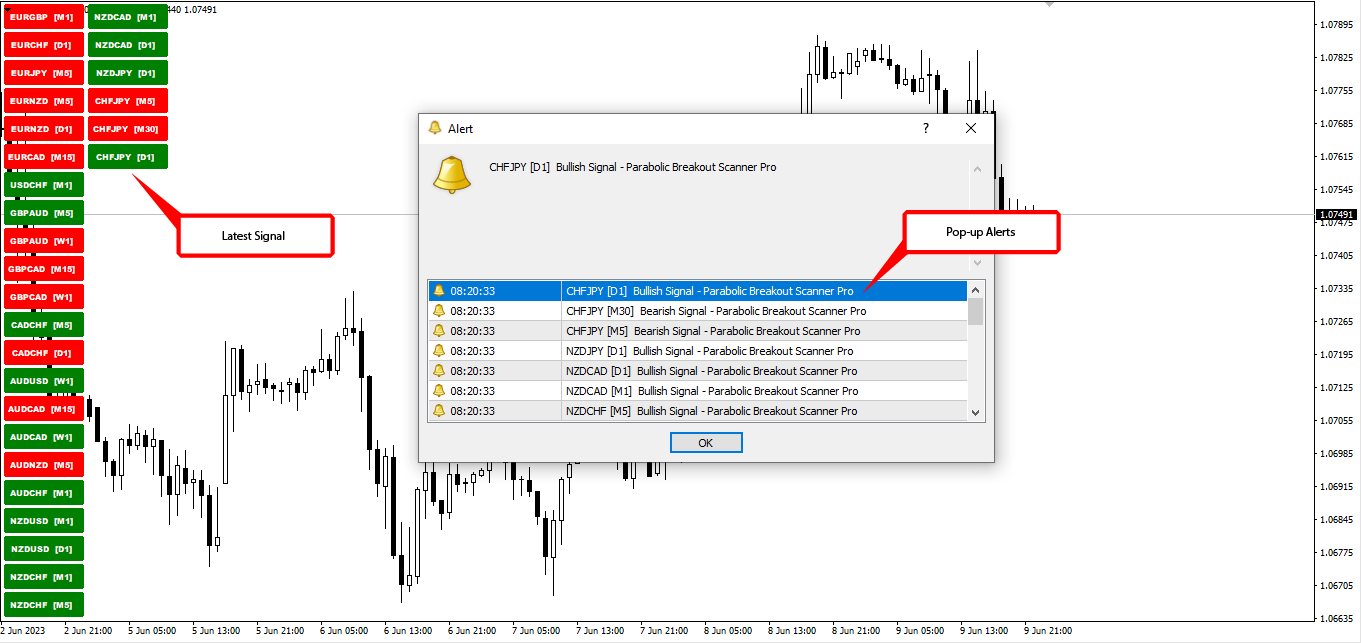
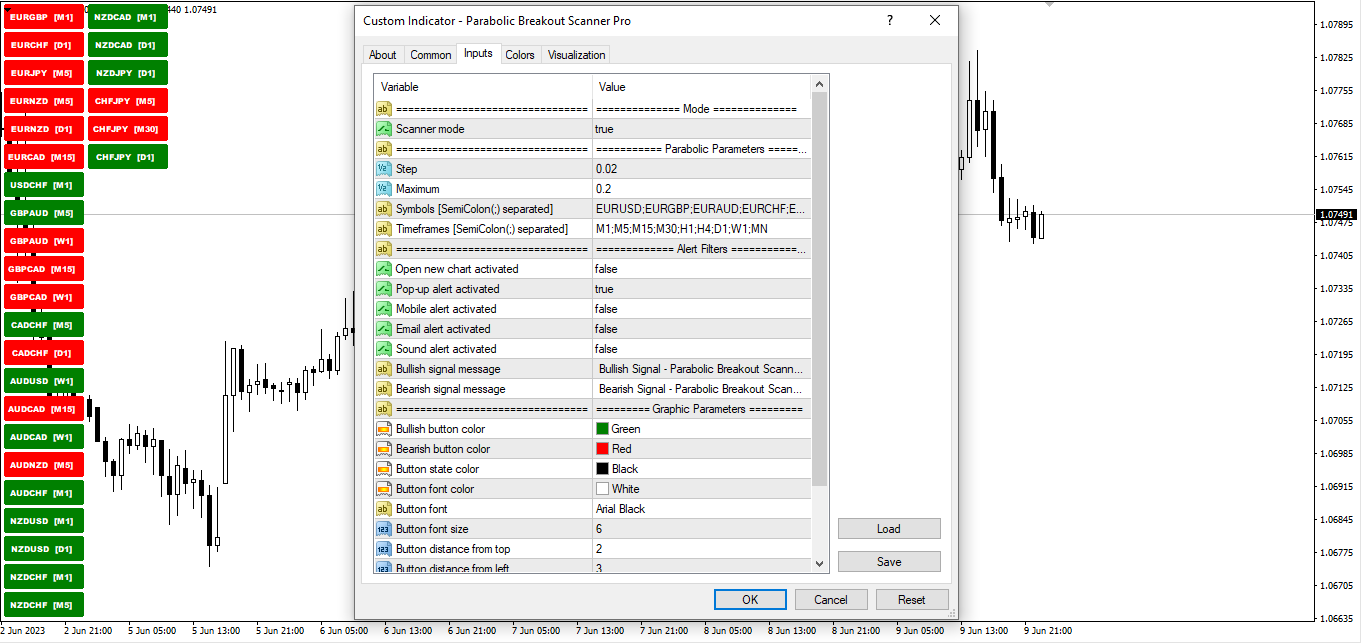
Never miss a trading opportunity again with our comprehensive alert system. Receive pop-up notifications, mobile alerts, emails, and sound notifications, keeping you informed about potential entry and exit points. Stay connected and take advantage of market movements with confidence, knowing that you have the latest information at your fingertips.

The Parabolic Breakout Scanner Pro also offers extensive customization options, allowing you to tailor the indicator to your unique trading style. Adjust parameters and settings according to your preferences, fine-tuning your strategy for optimal results. Whether you're a novice trader or a seasoned professional, this versatile tool adapts to your needs, putting you in control of your trading destiny.

Recommended products
VR Cub
Vladimir Pastushak
VR Cub is an indicator for getting high-quality entry points. The indicator was developed to facilitate mathematical calculations and simplify the search for entry points into a position. The trading strategy for which the indicator was written has been proving its effectiveness for many years. The simplicity of the trading strategy is its great advantage, which allows even novice traders to successfully trade with it. VR Cub calculates position opening points and Take Profit and Stop Loss targe
Noize Absorption Index MT4
Ekaterina Saltykova
5 (1)
Noize Absorption Index - is the manual trading system that measures the difference of pressure between bears forces and bulls forces. Green line - is a noize free index that showing curent situation. Zero value of index shows totally choppy/flat market.Values above zero level shows how powerfull bullish wave is and values below zero measures bearish forces.Up arrow appears on bearish market when it's ready to reverse, dn arrow appears on weak bullish market, as a result of reverse expectation. S
Owl smart levels
Sergey Ermolov
4.63 (54)
MT5 version  |  FAQ The Owl Smart Levels Indicator  is a complete trading system within the one indicator that includes such popular market analysis tools as  Bill Williams' advanced fractals , Valable ZigZag which builds  the correct wave structure  of the market, and  Fibonacci levels  which mark the exact levels of entry into the market and places to take profits. Detailed description of the strategy Instructions for working with the indicator Advisor-assistant in trading Owl Helper Private
The Th3Eng PipFinite indicator is based on a very excellent analysis of the right trend direction with perfect custom algorithms. It show the true direction and the best point to start trading. With StopLoss point and Three Take Profit points. Also it show the right pivot of the price and small points to order to replace the dynamic support and resistance channel, Which surrounds the price. And Finally it draws a very helpful Box on the left side on the chart includes (take profits and Stop loss
KT Renko Patterns MT4
KEENBASE SOFTWARE SOLUTIONS
2.33 (3)
KT Renko Patterns scans the Renko chart brick by brick to find some famous chart patterns that are frequently used by traders across the various financial markets. Compared to the time-based charts, patterns based trading is easier and more evident on Renko charts due to their uncluttered appearance. KT Renko Patterns features multiple Renko patterns, and many of these patterns are extensively explained in the book titled Profitable Trading with Renko Charts by Prashant Shah. A 100% automate
ZhiBiCCI MT4
Qiuyang Zheng
5 (1)
[ZhiBiCCI] indicators are suitable for all cycle use, and are also suitable for all market varieties. [ZhiBiCCI] Green solid line is a reversal of bullish divergence. The green dotted line is a classic bullish divergence. [ZhiBiCCI] The solid line to the red is a reverse bearish divergence. The red dotted line is a classical bearish divergence. [ZhiBiCCI] can be set in the parameters (Alert, Send mail, Send notification), set to (true) to send instant signals to the alarm window, email, in
Fibonacci retracement and extension line drawing tool Fibonacci retracement and extended line drawing tool for MT4 platform is suitable for traders who use  golden section trading Advantages: There is no extra line, no too long line, and it is easy to observe and find trading opportunities Trial version: https://www.mql5.com/zh/market/product/35884 Main functions: 1. Multiple groups of Fibonacci turns can be drawn directly, and the relationship between important turning points
Trendiness Index
Libertas LLC
5 (3)
"The trend is your friend" is one of the best known sayings in investing, because capturing large trendy price movements can be extremely profitable. However, trading with the trend is often easier said than done, because many indicators are based on price reversals not trends. These aren't very effective at identifying trendy periods, or predicting whether trends will continue. We developed the Trendiness Index to help address this problem by indicating the strength and direction of price trend
The indicator displays the data of the Stochastic oscillator from a higher timeframe on the chart. The main and signal lines are displayed in a separate window. The stepped response is not smoothed. The indicator is useful for practicing "manual" forex trading strategies, which use the data from several screens with different timeframes of a single symbol. The indicator uses the settings that are identical to the standard ones, and a drop-down list for selecting the timeframe. Indicator Parame
Infinity Trend Pro
Yaroslav Varankin
1 (1)
This is a trend indicator without redrawing Developed instead of the binary options strategy (by the color of the Martingale candlestick) Also works well in forex trading When to open trades (binary options) A signal will appear in the place with a candle signaling the current candle It is recommended to open a deal for one candle of the current timeframe M1 and M5 When a blue dot appears, open a deal up When a red dot appears, open a trade down. How to open trades on Forex. When a signal is rec
Daily Candle Predictor is an indicator that predicts the closing price of a candle. The indicator is primarily intended for use on D1 charts. This indicator is suitable for both traditional forex trading and binary options trading. The indicator can be used as a standalone trading system, or it can act as an addition to your existing trading system. This indicator analyzes the current candle, calculating certain strength factors inside the body of the candle itself, as well as the parameters of
Master Scalping M1 is an innovative indicator that uses an algorithm to quickly and accurately determine the trend.The indicator calculates the time of opening and closing positions, the indicator's algorithms allow you to find the ideal moments to enter a deal (buy or sell an asset), which increase the success of transactions for most traders. Benefits of the indicator: Easy to assemble, does not overload the chart with unnecessary information. Can be used as a filter for any strategy. Works on
Quantum Heiken Ashi PRO MT4
Bogdan Ion Puscasu
4.43 (7)
Introducing the   Quantum Heiken Ashi PRO charts with alerts Designed to provide clear insights into market trends, the Heiken Ashi candles are renowned for their ability to filter out noise and eliminate false signals. Say goodbye to confusing price fluctuations and hello to a smoother, more reliable chart representation. Buy  Quantum Heiken Ashi PRO and you could  get Quantum Breakout Indicator or Quantum Trend Sniper Indicator for free. Ask us how with a private message. What makes the Qua
TrendPlus
Sivakumar Subbaiya
4.21 (14)
Trend Plus   Trendplus  Indicator   Time Frame: Suitable for any time frame.  Purpose: Trend Prediction. Blue and red candle indicate the buy and sell call respectively. Buy: When the blue candle is formed buy call is initiated. close the buy trades when the next red candle will formed.   Sell: When the Red candle is formed Sell call is initiated. close the Sell trades when the next blue candle will formed.   Happy trade!!
FREE
TWO PAIRS SQUARE HEDGE METER INDICATOR Try this brilliant 2 pairs square indicator It draws a square wave of the relation between your two inputs symbols when square wave indicates -1 then it is very great opportunity to SELL pair1 and BUY Pair2 when square wave indicates +1 then it is very great opportunity to BUY pair1 and SELL Pair2 the inputs are : 2 pairs of symbols         then index value : i use 20 for M30 charts ( you can try other values : 40/50 for M15 , : 30 for M30 , : 10 for H1 ,
Title : Market Bias Indicator - Oscillator-Based Trading Tool Introduction : Discover the potential of the "Market Bias Indicator," a revolutionary oscillator-based trading tool designed for precise market analysis. If you're in search of a robust alternative to traditional bias indicators, your quest ends here. Market Bias Indicator offers unparalleled accuracy in identifying market sentiment and is your gateway to confident trading decisions. Recommended Trading Pairs : Market Bias Indicator i
Super Gator
Agustinus Biotamalo Lumbantoruan
This indi shows the following 1. Supertrend 2. Alligator (Not a regular alligator) 3. ZigZag 4. Moving Average 5. Trend Continuation/Mini correction Signal (plotted in X) (See screenshots in green background color 6. Early Signal Detection (See screenshots in green background color) You may treat Alligator as the lagging indicator The leading indicator is the supertrend. The zig zag is based on the leading indicator where it gets plotted when the leading indicator got broken to the opposite.
This is a new strategy for SUPPLY DEMAND areas It is based on a calculation using the tick volume to detect the big price action in market for both bear /bull actions this smart volume action candles are used to determine the supply and demand areas prices in between main supply and demand lines indicate sideway market  up arrows will be shown when prices moves above the main supply and the secondary supply lines Down arrows will be shown when prices moves below the main demand and the secondary
Cosmic Diviner X Planet
Olena Kondratenko
4 (2)
This unique multi-currency strategy simultaneously determines the strength of trends and market entry points, visualizing this using histograms on the chart. The indicator is optimally adapted for trading on the timeframes М5, М15, М30, Н1. For the convenience of users, the indicator renders the entry point (in the form of an arrow), recommended take profit levels (TP1, TP2 with text labels) and the recommended Stop Loss level. The take profit levels (TP1, TP2) are automatically calculated for
Forex Gump
Andrey Kozak
2.83 (6)
Forex Gump is a fully finished semi-automatic trading system. In the form of arrows, signals are displayed on the screen for opening and closing deals. All you need is to follow the instructions of the indicator. When the indicator shows a blue arrow, you need to open a buy order. When the indicator shows a red arrow, you need to open a sell order. Close orders when the indicator draws a yellow cross. In order to get the most effective result, we recommend using the timeframes H1, H4, D1. There
Point61 Indicator
Evgeniy Machok
5 (1)
The Point61 indicator is the result of many years of monitoring of price behavior of currency pairs and metals. It is not a secret, that in times of uncertainty, traders are looking for possible levels of support and resistance - the point, where price should stop its movement. There are 2 possible scenarios at these points: 1. Reverse (correction) to the opposite direction; 2. Breakthrough to continue movement. Very often these points are used to set stop orders - TakeProfit or
Trade with Gann on your side!! MASTER CIRCLE 360 CIRCLE CHART, originally created by Gann admitted that this is “The Mother of all charts”. It is one of the last studies that this great trader left for us. The numeric tab le is apparently quite simple like all the tables and is based on square numbers, the SQUARE OF 12 and is by evolution, one of the most important square numbers. Here we can find CYCLE, PRICE AND TIME thanks to angles and grades, to show past and future support and resistance.
Trend Ray
Andriy Sydoruk
The indicator shows the potential trend direction by cyclical-wave dependence. Thus, all the rays of the intersection will be optimal rays, in the direction of which the price is expected to move, taking into account the indicator period. Rays can be used as a direction for potential market movement. But we must not forget that the approach must be comprehensive, the indicator signals require additional information to enter the market.
Chart Patterns Detect 15 patterns (Ascending Triangle, Descending Triangle, Rising Wedge, Falling Wedge, Bullish Flag, Bearish Flag, Bullish Rectangle, Bearish Rectangle Symmetrical triangle, Head and Shoulders, Inverted Head and Shoulders, Triple top, Triple Bottom, Double Top, Double Bottom) Use historical data to calculate the probability of each pattern to succeed (possibility to filter notification according to the chance of success) gives graphic indication about the invalidation level and
For sure, this indicator has become very popular amongst traders. Through coding this indicator will give you the most accurate levels possible for your trading analysis. We have also added in the ability for you to receive alerts when the price breaks above or below a Support or Resistance lines! HOW TO USE The red rectangles represent your resistance/supply zone. The green rectangles represent your support/demand zone.  BONUS FEATURES We coded this indicator with the ability to switch between
Shark Deal Book
Philip Pankaj Suthagar
4 (3)
Term  "shark"  in the business world denotes a high volume investor who just made a good investment in a highly Potential business deal.So, sharks are the ones who make the market move. In our case, if an American shark bought a Japanese company, he/she has to convert American dollars into Japanese yen to make the deal. So, the demand for the Japanese yen will increase sharply. Thus USD/JPY will go short rapidly if the deal was from the shark. Another example, In the case of forex, if fed increa
Atomic Analyst
Issam Kassas
5 (1)
First of all Its worth emphasizing here that this Trading Indicator is   Non-Repainting ,   Non-Redrawing   and   Non-Lagging   Indicator, Which makes it ideal from both manual and robot trading.  The Atomic Analyst  is a PA Price Action Indicator that uses Strength and Momentum of the price to find a better edge in the market. Equipped with Advanced filters which help remove noises and false signals, and Increase Trading Potential. Using Multiple layers of complex Indicators, the Atomic Anal
Indicator. "Indicator wave or Indicator Ma". Using 23 standard indicators and the author's algorithm, the levels of purchases (from 0 to +100) and sales (from 0 to -100) are calculated. Then, using the calculated levels, the "Wave Indicator" draws a wave with 21 moving averages. The wave number is equal to the averaging period of the calculated levels. Waves # 1 - 7 Fast Moving Averages Waves from No. 8 -14 moving averages Waves from No. 15-21 slow moving averages Looking at the figu
The indicator automatically calculates and plots Fibonacci support and resistance levels - one of the most effective tools for market analysis. The calculation uses the averaged price data for the selected period and timeframe. The minimum and maximum for this period are taken as the beginning and end of the movement. Fibonacci levels allow you to see potential reference points, around which the price movement can slow down or reverse, that is, they are used to predict further movement, as well
Gvs Undefeated Trend   indicator is designed for trend and signal trading. This indicator generates trend signals.  It uses many algorithms and indicators to generate this signal. It tries to generate a signal from the points with the highest trend potential. This indicator is a complete trading product. This indicator does not need any additional indicators.  You can only trade with this indicator. The generated signals are displayed on the graphical screen.  Thanks to the alert features you ca
Buyers of this product also purchase
CURRENTLY 26% OFF Best Solution for any Newbie or Expert Trader! This Indicator is a unique, high quality and affordable trading tool because we have incorporated a number of proprietary features and a new formula. With only ONE chart you can read Currency Strength for 28 Forex pairs! Imagine how your trading will improve because you are able to pinpoint the exact trigger point of a new trend or scalping opportunity? User manual: click here That's the first one, the original! Don't buy a worthle
TPSproTREND PrO
Roman Podpora
5 (15)
TPSpro TRENDPRO  - is a trend indicator that automatically analyzes the market and provides information about the trend and each of its changes, as well as giving signals for entering trades without redrawing! The indicator uses each candle, analyzing them separately. referring to different impulses - up or down impulse. Exact entry points into transactions for currencies, crypto, metals, stocks, indices!  -  Version MT5               DETAILED DESCRIPTION        /       TRADING SETUPS           
Currently 20% OFF ! Best Solution for any Newbie or Expert Trader! This dashboard software is working on 28 currency pairs plus one. It is based on 2 of our main indicators (Advanced Currency Strength 28 and Advanced Currency Impulse). It gives a great overview of the entire Forex market plus Gold or 1 indices. It shows Advanced Currency Strength values, currency speed of movement and signals for 28 Forex pairs in all (9) timeframes. Imagine how your trading will improve when you can watch the e
Scalper Inside PRO
Alexey Minkov
4.75 (55)
SALE NOW! Limited Time Offer! An exclusive indicator that utilizes an innovative algorithm to swiftly and accurately determine the market trend. The indicator automatically calculates opening, closing, and profit levels, providing detailed trading statistics. With these features, you can choose the most appropriate trading instrument for the current market conditions. Additionally, you can easily integrate your own arrow indicators into Scalper Inside Pro to quickly evaluate their statistics and
TPSpro RFI Levels
Roman Podpora
5 (13)
A key element in trading is zones or levels from which decisions to buy or sell a trading instrument are made. Despite attempts by major players to conceal their presence in the market, they inevitably leave traces. Our task was to learn how to identify these traces and interpret them correctly. Reversal First Impulse levels (RFI)   -  Version MT5                INSTRUCTIONS                 RUS                 ENG                                       R ecommended to use with an indicator   -  
Introducing   Quantum Trend Sniper Indicator , the groundbreaking MQL5 Indicator that's transforming the way you identify and trade trend reversals! Developed by a team of experienced traders with trading experience of over 13 years,   Quantum Trend Sniper Indicator   is designed to propel your trading journey to new heights with its innovative way of identifying trend reversals with extremely high accuracy. ***Buy Quantum Trend Sniper Indicator and you could get Quantum Breakout Indicator fo
Quantum Breakout Indicator PRO
Bogdan Ion Puscasu
4.96 (26)
Introducing   Quantum Breakout PRO , the groundbreaking MQL5 Indicator that's transforming the way you trade Breakout Zones! Developed by a team of experienced traders with trading experience of over 13 years, Quantum Breakout PRO is designed to propel your trading journey to new heights with its innovative and dynamic breakout zone strategy. Quantum Breakout Indicator will give you signal arrows on breakout zones with 5 profit target zones and stop loss suggestion based on the breakout box.
Advanced Supply Demand
Bernhard Schweigert
4.92 (310)
CURRENTLY 26% OFF !! Best Solution for any Newbie or Expert Trader! This indicator is a unique, high quality and affordable trading tool because we have incorporated a number of proprietary features and a new formula. With this update, you will be able to show double timeframe zones. You will not only be able to show a higher TF but to show both, the chart TF, PLUS the higher TF: SHOWING NESTED ZONES. All Supply Demand traders will love it. :) Important Information Revealed Maximize the potenti
Introducing the Miraculous Forex Indicator: Unleash the Power of Precision Trading Are you tired of searching for the perfect forex indicator that truly delivers exceptional results across all time frames? Look no further! The Miraculous Forex Indicator has arrived to revolutionize your trading experience and propel your profits to new heights. Built upon a foundation of cutting-edge technology and years of meticulous development, the Miraculous Forex Indicator stands as the pinnacle of str
Entry Points Pro
Yury Orlov
4.7 (225)
Top indicator for MT4 providing accurate signals to enter a trade without repainting! Watch  the video  (6:22) with an example of processing only one signal that paid off the indicator! It can be applied to any financial assets:  forex, cryptocurrencies, metals, stocks, indices.  MT5 version is here   It will provide pretty accurate trading signals and tell you when it's best to open a trade and close it. Most traders improve their trading results during the first trading week with the help of t
TrendMaestro
Stefano Frisetti
5 (2)
note: this indicator is for METATRADER4, if you want the version for METATRADER5 this is the link: TRENDMAESTRO recognizes a new TREND in the bud, he never makes mistakes. The certainty of identifying a new TREND is priceless. DESCRIPTION TRENDMAESTRO identifies a new TREND in the bud, this indicator examines the volatility, volumes and momentum to identify the moment in which there is an explosion of one or more of these data and therefore the moment in which prices have strong probability of f
FX Power MT4 NG
Daniel Stein
5 (8)
Trading GOLD, and currencies, with the dog walk strategy  - super smart Trading GOLD, and currencies, with the breakout strategy  - super easy Visit our all-new   Stein Investments Welcome Page   to get the latest information, updates and trading strategies. FX Power MT4 NG  is the next generation of our long-time very popular currency strength meter, FX Power.  And what does this next-generation strength meter offer? Everything you have loved about the original FX Power  PLUS GOLD/XAU stre
Price Action Entry Alerts
Stephen Sanjeeve Sahayam
5 (3)
This indicator screens every bar for buying or selling pressure and identifies 4 types of candle patterns with the highest volume. These candles are then filtered using several linear filters to show Buy or Sell signals. Signals work best, in conjunction with higher time frame direction and when traded during high volume hours. All filters are customizable and work independently. Can view signals of a single direction with the click of a button. This indicator also comes loaded with the most im
FX Volume
Daniel Stein
4.6 (35)
Visit our all-new   Stein Investments Welcome Page   to get the latest information, updates and trading strategies. FX Volume is the FIRST and ONLY volume indicator that provides a REAL insight into the market sentiment from a broker's point of view. It provides awesome insights into how institutional market participants, like brokers, are positioned in the Forex market, much faster than COT reports. Seeing this information directly on your chart is the real game-changer and breakthrough solut
Up down v6T
Guner Koca
5 (1)
Thise indicator is up down v6  comes with tradingwiev version. purchased people, after installed on terminal ,contact me on mql5  to get BONUS  TradingView version. up-down indicator is no repaint and works all pairs and lower than weekly time frames charts. it is suitable also 1 m charts for all pairs. and hold long way to signal. dont gives too many signals. when red histogram cross trigger line that is up signal.and price probably will down when blue histogram cross trigger line that is dow
How to use Pair Trading Station Pair Trading Station is recommended for H1 time frame and you can use it for any currency pairs. To generate buy and sell signal, follow few steps below to apply Pair Trading Station to your MetaTrader terminal. When you load Pair Trading Station on your chart, Pair Trading station will assess available historical data in your MetaTrader platforms for each currency pair. On your chart, the amount of historical data available will be displayed for each currency pai
Cycle Sniper
Elmira Memish
4.4 (35)
NEW YEAR SALE PRICE FOR LIMITED TIME!!! Please contact us after your purchase and we will send you the complimentary indicators to complete the system Cycle Sniper is not a holy grail but when you use it in a system which is explained in the videos, you will feel the difference. If you are not willing to focus on the charts designed with Cycle Sniper and other free tools we provide, we recommend not buying this indicator. We recommend watching the videos about the indiactor and system before pu
PTS Precision Index Oscillator V2
PrecisionTradingSystems
5 (1)
The Precision Index Oscillator (Pi-Osc) by Roger Medcalf of Precision Trading Systems First of all, if you have any questions please contact me via my website which you can find by searching the above title. Version 2 has been carefully recoded to be super fast to load up on your chart and some other technical improvements have been incorporated to enhance experience. Pi-Osc was created to provide accurate trade timing signals designed to find extreme   exhaustion points, the points that markets
TakePropips Donchian Trend Pro
Eric John Pajarillaga Aldana
4.82 (17)
TakePropips Donchian Trend Pro  (MT4) is a powerful and effective tool that automatically detects the direction of the trend using the Donchian Channel and provides you with an entry and exit trading signals! This multi-function indicator includes a trend scanner, trading signals, statistical panel, screener, trading sessions, and alerts history dashboard. It is designed to provide you with trading signals and save you hours analyzing the charts! You can download the user manual and installation
GOLD Impulse with Alert
Bernhard Schweigert
4.56 (9)
This indicator is a super combination of our 2 products  Advanced Currency IMPULSE with ALERT  and  Currency Strength Exotics . It works for all time frames and shows graphically impulse of strength or weakness for the 8 main currencies plus one Symbol! This Indicator is specialized to show currency strength acceleration for any symbols like Gold, Exotic Pairs, Commodities, Indexes or Futures. Is first of its kind, any symbol can be added to the 9th line to show  true currency strength accelerat
PTS Divergence Buy Finder
PrecisionTradingSystems
PTS - Divergence Buy Finder by Precision Trading Systems Precision Divergence Finder was designed to find market bottoms with pinpoint accuracy and frequently does so. In technical analysis, the art of picking bottoms is generally much easier than picking tops this item is designed precisely for this task. After a bullish divergence is identified then it is wise to wait for the trend to turn up before buying. You can use a 10 or 20 bar high to enter or a moving average 15-30 to be rising to id
The PTS Divergence Finder Sell Indicator by Roger Medcalf  -  Precision Trading Systems. This indicator only give Bearish - Sell Indications. First and foremost, I have been asked many times why I did not provide a sell divergence indicator while happily providing a buy signal divergence finder for many years. I gave the answer that sell divergences are less reliable than the buy divergences, which is still true. Some solutions to change this were found, not by giving in to peer press
TPA True Price Action indicator reveals the true price action of the market makers through 100% non-repainting signals (except early signals mode) strictly at the close of a candle! TPA shows entries and re-entries, every time the bulls are definitely stronger than the bears and vice versa. Not to confuse with red/green candles. The shift of power gets confirmed at the earliest stage and is ONE exit strategy of several. There are available now two free parts of the TPA User Guide for our custo
Indicator : RealValueIndicator Description : RealValueIndicator is a powerful tool designed specifically for trading on the EURUSD pair. This indicator analyzes all EUR and USD pairs, calculates their real currency strength values, and displays them as a single realistic value to give you a head start on price. This indicator will tell you moves before they happen if you use it right. RealValueIndicator allows you to get a quick and accurate overview of the EURUSD currency pair tops and bottoms,
XQ Indicator MetaTrader 4
Marzena Maria Szmit
3 (2)
Step into the realm of Forex trading with confidence and precision using XQ, a cutting-edge Forex indicator designed to elevate your trading game to unprecedented heights. Whether you're a seasoned trader or just stepping into the world of currency exchange,   XQ Forex Indicator   empowers you with the insights and signals needed to make informed trading decisions. The signal conditions are a combination of three indicators, and XQ Forex Indicator only display  medium and long-term trends . The
Introducing ON Trade Waves Patterns Harmonic Elliot Wolfe, an advanced indicator designed to detect various market patterns using both manual and automated methods. Here's how it works: Harmonic Patterns: This indicator can identify harmonic patterns that appear on your chart. These patterns are essential for traders practicing harmonic trading theory, as popularized by Scott Carney's book "Harmonic Trading vol 1&2." Whether you draw them manually or rely on automated detection, ON Trade Waves
Currency Strength Exotics
Bernhard Schweigert
4.88 (33)
CURRENTLY 20% OFF ! Best Solution for any Newbie or Expert Trader! This Indicator is specialized to show currency strength for any symbols like Exotic Pairs Commodities, Indexes or Futures. Is first of its kind, any symbol can be added to the 9th line to show true currency strength of Gold, Silver, Oil, DAX, US30, MXN, TRY, CNH etc. This is a unique, high quality and affordable trading tool because we have incorporated a number of proprietary features and a new formula. Imagine how your trading
Royal Scalping Indicator M4
Vahidreza Heidar Gholami
4.17 (6)
Royal Scalping Indicator is an advanced price adaptive indicator designed to generate high-quality trading signals. Built-in multi-timeframe and multi-currency capabilities make it even more powerful to have configurations based on different symbols and timeframes. This indicator is perfect for scalp trades as well as swing trades. Royal Scalping is not just an indicator, but a trading strategy itself. Features Price Adaptive Trend Detector Algorithm Multi-Timeframe and Multi-Currency Trend Low
Gartley Hunter Multi MT4
Siarhei Vashchylka
4.67 (3)
Gartley Hunter Multi - An indicator for searching for harmonic patterns simultaneously on dozens of trading instruments and on all classic timeframes: (m1, m5, m15, m30, H1, H4, D1, Wk, Mn). Manual (Be sure to read before purchasing) | Version for MT5 Advantages 1. Patterns: Gartley, Butterfly, Shark, Crab. Bat, Alternate Bat, Deep Crab, Cypher 2. Simultaneous search for patterns on dozens of trading instruments and on all classic timeframes 3. Search for patterns of all possible sizes. Fr
Supply and Demand Dashboard PRO
Bernhard Schweigert
4.82 (22)
Currently 20% OFF ! This dashboard is a very powerful piece of software working on multiple symbols and up to 9 timeframes. It is based on our main indicator (Best reviews:   Advanced Supply Demand ). The dashboard gives a great overview. It shows: Filtered Supply and Demand values including zone strength rating, Pips distances to/and within zones, It highlights nested zones, It gives 4 kind of alerts for the chosen symbols in all (9) time-frames. It is highly configurable for your personal
More from author
Candle Power Pro
Thushara Dissanayake
4.33 (6)
Unlock the power of real volume information with the Candle Power Pro indicator. This dynamic tool captures the actual volume data for each candle and presents it as a percentage of the total volume. By doing so, it empowers you to discern the ongoing struggle between buyers and sellers in the market. The Candle Power Pro displays the battle between buyers and sellers as a percentage of the total volume, giving you valuable insights into market dynamics. You can easily confirm breakouts by anal
BullsBears Action
Thushara Dissanayake
3.91 (22)
The BullsBears Action Expert Advisor is a powerful tool designed to utilize Bulls and Bears volume data for trading decisions. By analyzing the percentage of Bulls and Bears in the market based on candle volume, this EA automatically opens Buy or Sell orders according to user-defined parameters. It provides a user friendly trading solution that incorporates risk management, automatic stop loss adjustment, and customizable settings. One of the key features of this expert advisor is its risk manag
FREE
Volume Percentage Line Graph
Thushara Dissanayake
4.75 (4)
The Volume Percentage Line Graph is an indicator designed to provide volume data insights. It retrieves total volume information for each candle and presents it as a percentage of the overall volume. The indicator displays this data as graph lines in a separate window, allowing users to easily visualize the battle between buyers and sellers. One of the key features of this indicator is its ability to show the volume percentage as graph lines. By representing the volume distribution between selle
FREE
Extract Candle Power
Thushara Dissanayake
5 (2)
Extract Candle Power is a real time volume extractor indicator that provides valuable insights into the behavior of sellers and buyers during each candle. By analyzing the volume data, traders can make more informed decisions about market trends and potential reversals, surpassing the capabilities of traditional Moving Average indicators. This powerful tool allows you to extract and analyze the sellers and buyers volume of the current candle, as well as compare it with the volume of previous can
Ms Fibonacci
Thushara Dissanayake
3.75 (8)
Introducing Ms. Fibonacci , a powerful and free indicator designed to simplify the process of drawing and adjusting Fibonacci levels on your chart. This indicator automatically identifies and marks the new highest and lowest Fibonacci levels, ensuring accurate and precise placement. One of the key features of Ms. Fibonacci is its ability to draw Fibonacci levels correctly, point to point, and mark the corresponding price levels. This feature saves you time and effort, allowing you to focus on an
FREE
The   RSI Crossover Alert   is a powerful notification system designed specifically for traders who utilize the   Relative Strength Index (RSI)   in their trading strategies. This indicator focuses on identifying RSI crossovers, which occur when the fast RSI line crosses above or below the slow RSI line. By combining these crossovers, the indicator effectively filters out false signals, allowing traders to make more accurate trading decisions. The RSI Crossover Alert offers several key features
Fibo Scalper Pro
Thushara Dissanayake
2.33 (3)
The Fibo Scalper Pro Expert Advisor is a powerful tool designed to automate popular Fibonacci Trading Strategies . It simplifies the trading process by automatically drawing and adjusting Fibonacci levels on the chart. This feature provides convenience and accuracy for traders who utilize Fibonacci retracements and extensions in their analysis. One of the key features of the Fibo Scalper Pro is its customization facility. It allows professional traders to enable or disable each Fibonacci leve
Breakout Robot
Thushara Dissanayake
4.5 (4)
Introducing the Breakout Robot Expert Advisor , a revolutionary tool designed to automate the highly sought-after EURJPY Breakout Strategy with unparalleled ease. This powerful EA features a simple yet effective system that effortlessly draws a box using high and low values between 22:00 - 02:00 GMT. It then automatically executes BUY/SELL orders when price breaks above/below the box, all optimized for the M15 time frame. With complete customization capabilities, you have the flexibility to tail
Mr Fibonacci
Thushara Dissanayake
5 (2)
Introducing Mr. Fibonacci , an amazing indicator designed to simplify the process of drawing and adjusting Fibonacci levels on your chart. This indicator offers exceptional customization options for professional traders, allowing them to draw any Fibonacci level with precision. Additionally, it provides mobile notifications, email alerts, and pop-up alerts when price enters Fibonacci levels, ensuring you never miss potential trading opportunities. Using this indicator, you no longer have to cons
Three MA Alert
Thushara Dissanayake
The Three MA Alert indicator is an essential tool for traders who rely on the Moving Averages Crossover Strategy . It simplifies your trading life by sending notifications to your mobile device, email, and displaying pop-up alerts with sound whenever there is a crossover of three moving averages. By following this widely used technique, you can ensure that you are always on the right side of the trend and avoid trading against the prevailing market direction. With the Three MA Alert indicator, y
Two MA Crossover
Thushara Dissanayake
5 (3)
The Two MA Crossover is a powerful notification system designed specifically for traders who rely on the Moving Average Crossover Strategy . This fully automated indicator serves as a comprehensive alert system, ensuring that you never miss a crucial trading event. It sends notifications to your mobile device, email, and displays pop-up alerts with sound on your computer, all when it detects a moving average crossover based on your preferred parameters. One of its notable features is its compati
Pivot Bro
Thushara Dissanayake
5 (1)
The Pivot Bro technical indicator is a powerful tool designed to identify retracement areas using Pivot, Fibonacci, ATR, and ADR levels. It goes beyond that by also recognizing price action based reversal candlestick patterns . Additionally, the Currency Meter is a valuable companion for assessing the true strength of major currencies. By analyzing 28 currency pairs and displaying their strength on the chart with color changes, it enables traders to make informed decisions on entry and exit poin
ReversalPatterns
Thushara Dissanayake
This technical indicator automatically identifies and analyzes price action using a variety of Reversal Candlestick Patterns on the chart. It conveniently draws arrow signs along with the corresponding pattern names, making it easy to spot the latest reversal candlestick patterns. With this indicator, you can quickly identify and compare chart analysis with previously identified candle patterns. The indicator includes a range of implemented candlestick patterns, both simple and complex, such as
Reversal Alert Pro
Thushara Dissanayake
2.5 (2)
The Reversal Alert Pro indicator is a powerful tool designed to automatically detect reversal areas in the market. It offers convenient notifications sent directly to your mobile device and displays pop-up alerts with sound. By incorporating this indicator into your trading strategy, you can effectively filter trade positions. Furthermore, the indicator provides the option to utilize CCI, RSI, and Stochastic indicators to further refine the generated signals, enhancing its versatility and applic
Currency Strength 7
Thushara Dissanayake
The Currency Strength 7 technical indicator is a powerful tool designed to help traders gauge the strength of the seven most popular currencies. By analyzing the strength of AUD, USD, EUR, GBP, JPY, CHF, and CAD, this indicator provides valuable insights into currency dynamics. It represents currency strength on the chart using lines, allowing traders to quickly assess the relative strength of different currencies. One of the standout features of this indicator is its ability to draw an extended
Crossover Action
Thushara Dissanayake
The Crossover Action Expert Advisor is an advanced tool designed to automate one of the most popular trading strategies, the M oving Average Crossover Strategy . With its intuitive interface and powerful features, this expert advisor takes the complexity out of manual trading and executes trades automatically based on moving average crossovers. One of the key features of this expert advisor is its proper risk management system, ensuring that trades are executed with appropriate lot sizes and max
CCI Action
Thushara Dissanayake
The CCI Action Expert Advisor is a powerful tool designed to automate the CCI (Commodity Channel Index) Strategy , allowing traders to capitalize on CCI level touches. With its user friendly settings and robust risk management system, this EA provides a reliable and efficient solution for traders looking to incorporate the CCI indicator into their trading approach. One of the key features of this Expert Advisor is its proper risk management system, which helps traders maintain control over their
News Robo
Thushara Dissanayake
2 (1)
The News Robo Expert Advisor is a powerful tool designed to assist news traders in opening pending orders with hidden stop loss during news releases. It offers several features that enhance your trading experience and protect your trades. One of the key features of News Robo is the hidden stop loss, which is ideal for news traders who prefer to conceal their stop loss from market maker brokers. The stop loss is automatically revealed once a profitable position is achieved, allowing you to secure
RSI Action
Thushara Dissanayake
3.67 (3)
The RSI Action Expert Advisor is a powerful tool that automates popular RSI (Relative Strength Index) strategies, allowing for efficient and accurate trading. By utilizing overbought and oversold levels, this EA identifies optimal entry points for buy and sell orders. It also offers various signal filtering options to enhance trading precision, including RSI reversal points, pending orders, major trend identification, and Moving Average Crossover signals. Additionally, it incorporates a modern
Candle GAP
Thushara Dissanayake
The Candle GAP indicator is an essential tool for traders utilizing Gap Trading Strategies as it automatically identifies candle gaps for each day of the week. A gap refers to a price level difference between the close and open of two consecutive days. This indicator recognizes four types of gap patterns: Common, Breakaway, Continuation, and Exhaustion. By incorporating this indicator into any chart, traders can validate their signals and enhance their trading decisions. One of the key features
TPSL Driver
Thushara Dissanayake
Introducing the TPSL Driver Utility , a powerful tool designed to enhance your trading experience by automating Stop Loss and Take Profit management. This utility caters to every trader who desires seamless order management and advanced profit protection techniques. With the TPSL Driver Utility, you have the flexibility to choose between two modes of order management: Hidden and Visual. The Hidden mode allows you to hide the Take Profit and Stop Loss levels, providing a discreet approach to mana
Entry Point
Thushara Dissanayake
Introducing the Entry Point , a powerful technical indicator designed to provide Buy/Sell notifications. This indicator analyzes 5 moving averages, CCI, RSI, Stochastic, Bill Williams, and volume indicators across 3 different time frames to generate accurate signals. It offers unlimited customization options for professional traders, allowing them to tailor the indicator based on their experience and strategies. The Entry Point sends signals to users via mobile devices, email, and pop-up alerts
Entry Point Dashboard Ultimate
Thushara Dissanayake
3 (2)
Introducing the Entry Point Dashboard Ultimate , a powerful technical indicator designed to provide Buy/Sell notifications for 6 currency pairs. This indicator analyzes 5 moving averages, CCI, RSI, Stochastic, Bill Williams, and volume indicators across 3 different time frames to generate accurate signals. It offers unlimited customization options for professional traders, allowing them to tailor the indicator based on their experience and strategies. The Entry Point Dashboard Ultimate sends sig
Introducing the Fibo Channels Ultimate technical indicator, a powerful tool designed to revolutionize your Fibonacci trading strategy. With its advanced functionality, this indicator automatically draws all past Fibonacci channels on your chart, saving you time and effort. What sets the Fibo Channels Ultimate apart is its exceptional customization capabilities, allowing professional traders to draw any Fibonacci level they desire. This level of flexibility ensures that you can tailor the indicat
The Crossover Tactics Ultimate Expert Advisor is a powerful tool designed to automate popular Moving Average Crossover Strategies . It excels at identifying optimal entry points based on the intersection of three moving averages, while employing advanced filtering techniques to enhance the reliability of signals. However, what sets this EA apart is its comprehensive trade management system, known as the TPSL Driver Utility algorithm. One of the standout features of this expert advisor is its abi
Introducing the DFP Reconnoiter Ultimate , a technical indicator specifically designed for Daily Fibonacci Pivot Strategy traders. This indicator incorporates standard Fibonacci retracements, daily Pivot levels, Candlestick patterns, ATR and ADR levels to identify reversal and exit areas, resulting in well-timed entries. Key Fibonacci retracement levels of 38.2%, 50.0%, or 61.8% are preferred in conjunction with the daily central pivot. The strategy involves monitoring the Average True Range (AT
Currency Heat Wave Ultimate
Thushara Dissanayake
5 (1)
The Currency Heat Wave Ultimate technical indicator is a valuable tool that provides traders with real time insights into the strength of major currencies. With its analysis of 28 currency pairs, it offers a comprehensive overview of currency strength directly on the chart, making it incredibly convenient to use. By dynamically changing colors, it enables traders to quickly identify the positions of currencies and make informed decisions. One of the notable features of Currency Heat Wave is its
Exit Area Ultimate
Thushara Dissanayake
3 (1)
The Exit Area Ultimate is a technical indicator designed to enhance trading decisions by indicating the daily Average True Range (ATR) and Average Daily Rate (ADR) levels on the chart. By understanding these levels, traders can easily assess the average movement of an asset throughout the day. This versatile indicator serves multiple purposes for day traders, aiding in order placement, identifying intraday tendencies, setting trailing stop loss levels, and establishing daily take profit levels.
Level Scanner
Thushara Dissanayake
The Level Scanner indicator is a powerful tool designed to automate the identification of Higher and Lower areas on the chart, along with all Support and Resistance levels . It incorporates the use of the Hull Moving Average to provide a clearer and smoother representation of the real trend. This indicator operates with remarkable speed, enabling traders to quickly identify key areas of interest and make more informed trading decisions. One of the standout features of the Level Scanner is its ve
The Infinity Oscillators Ultimate is an all inclusive OSCI-KIT designed to enhance the trading experience for traders utilizing RSI, Stochastic, MACD, CCI, and Volume strategies. With its comprehensive range of features, this indicator offers a powerful toolset to analyze market trends, identify reversals and retracements, calculate intraday targets using ATR, and stay informed about crucial trading events. One of the standout features of this indicator is its ability to consolidate the most po
Filter:
No reviews
Reply to review