DR IDR Pro mt4
- Indicators
- Barend Paul Stander
- Version: 2.3
- Updated: 4 September 2024
- Activations: 5
Defining Range ( DR ) and Implied Defining Range ( IDR ) indicator Pro with added features from free version
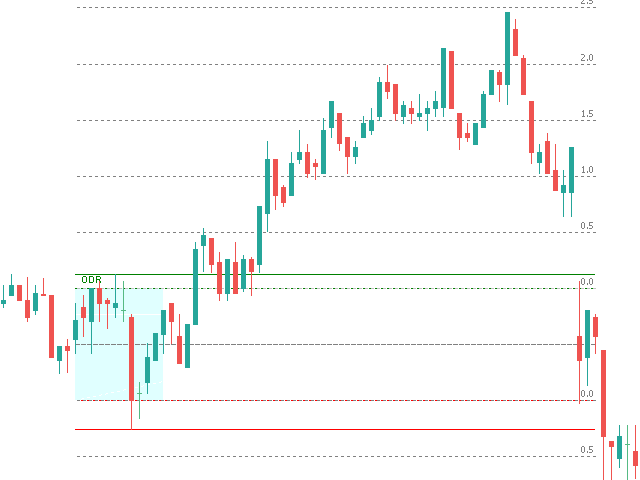
Show DR and IDR ranges Sessions on the chart for
- RDR Regular defining range (New York Session)
- ADR After defining range (Asian session)
- ODR Outside defining range (London Session)
Buttons on chart to enable / disable :
- Show Imbalance ( IMB )
- Show Volume Imbalance ( VIB )
- Show Gap's between open and close
- Show Standard Deviation ( SD )
- Show last 3 Sessions or Back testing mode with multi day Sessions ( BT )
for more information how DR IDR work and the high probability watch : https://www.youtube.com/@themas7er
or https://twitter.com/IamMas7er
Remember to set set your chart Time Zone when you attach indicator to the chart under indicator settings / inputs

The best $ 30.00 I have spend on an indicator !!! Works like a charm, also in Soft4FX for backtesting. If you trade DR IDR it is a no brainer.