UR HighsAndLows MT5
- Indicators
- Krzysztof Jan Debski
- Version: 1.10
- Updated: 16 May 2024
- Activations: 5
UR Highs&Lows MT5
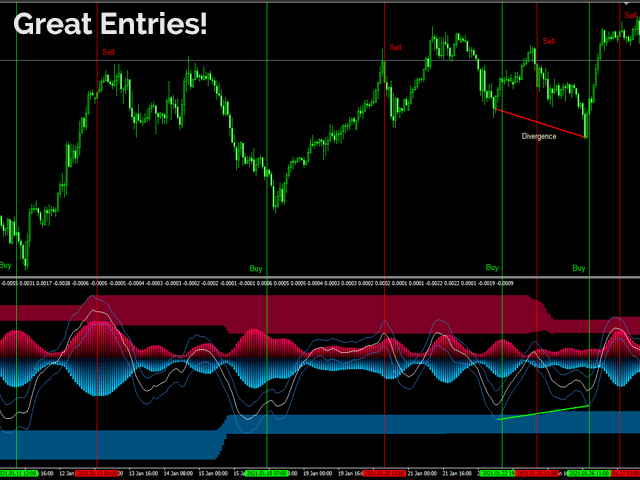
UR Highs&Lows MT5 does an in-depth analysis of price movement and its volatility, and creates a channel within which the price is moving. That channel moves now as an oscillator and is overlayed with price's deviation to signal potential exhaustions and possible reversals.
Advantages of using UR Highs&Lows MT5 :
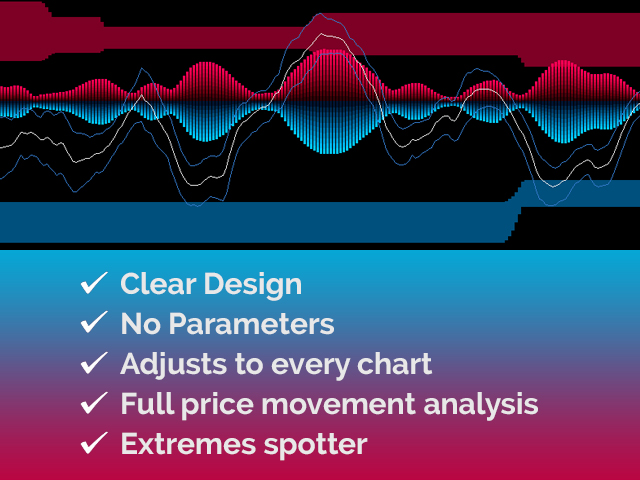
- No parameters
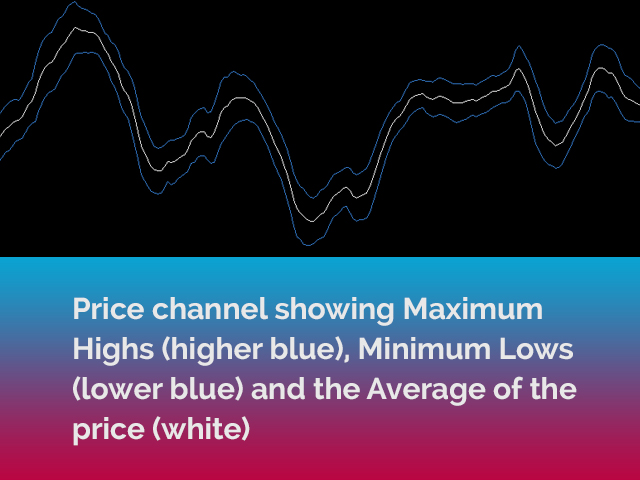
- You have 3 lines that describe the price movement - White Line which is an average of the price, and Blue Lines which are its extremes
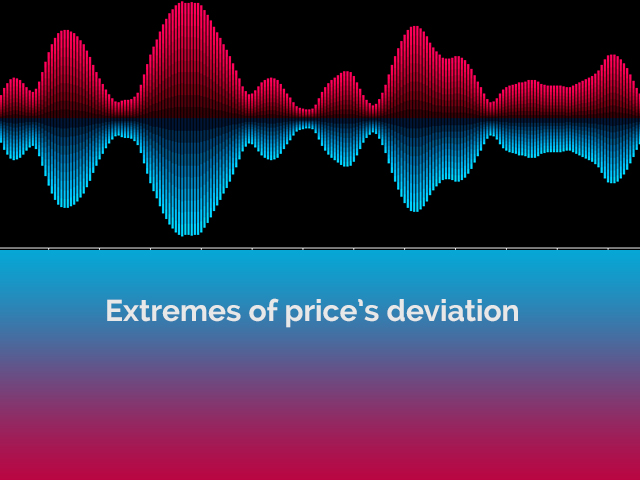
- The histogram is a visualization of max deviations in context of the price
- The interface showcases the exhaustion of either line on both extremes (upper red and lower blue areas)
- The best advantage: Easy and adjusted to all assets.
There is a special telegram chat on which you can stay up-to-date with the tools updates and also send request if you feel there is something missing!
Why UR Highs&Lows MT5 ?
This indicator can be used as a standalone, entry or exit indicator. Because of its dependence on the price - it can be applied to every chart and its deviations calculation algorithm is based on several years of experience and observation.
How to use UR Highs&Lows MT5 ?
See description below to be more familiar with it:
- None
DISPLAY
- Price Average Main Line (white): The average of the price.
- Price Extremes (blue): A calculated channel of price's extremes.
- Histogram: Shows the deviation of the volatility.
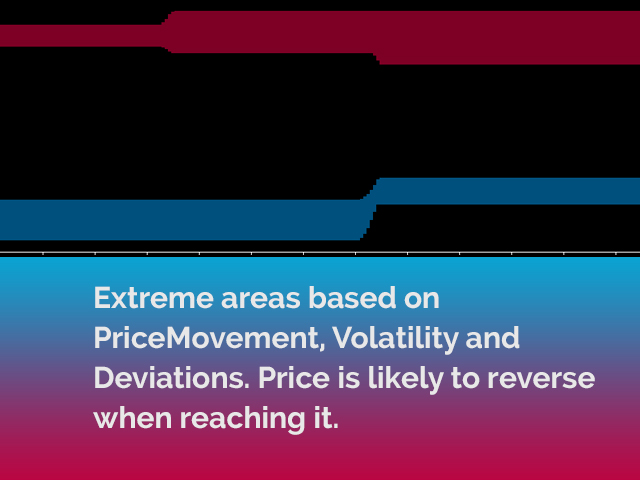
- Extreme Areas: Areas where price will get exhausted and potentially reverse.
ADDITION
- All of my tools are working best when assembled. Meaning the accuracy of entry points is way better if used with UR DivergenceSpotter, UR VolumeTrend or/and UR TrendExhaustion.
WWW -> https://urtradingcoder.carrd.co
Twitter -> https://twitter.com/URTradingCoder
Facebook -> https://www.facebook.com/profile.php?id=61559349091899
YouTube -> https://www.youtube.com/channel/UCihthoKQYrhj91jkUO8B1kg
MQL Store -> https://www.mql5.com/en/users/youreacoder/seller