• Overview
  • Reviews
  • Comments
  • What's new

UR DivergenceSpotter MT5

UR DivergenceSpotter MT5


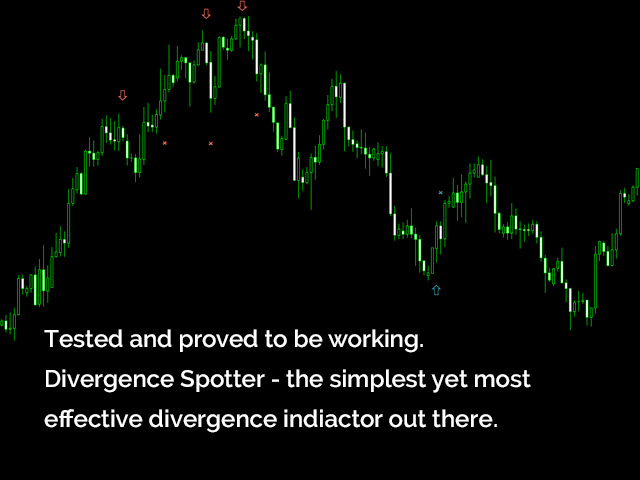
UR DivergenceSpotter MT5 is the result of many years of experience and sometimes the easiest ways are the best. There is a good correlation between a few indicators, but when they mismatch - the price tries to "re-adjust" - and it's at that moment when we get a signal with UR DivergenceSpotter MT5.

Advantages of using UR Divergence Spotter MT5:

  1. No parameters
  2. Doesn't repaint after the candle is created
  3. Signals when the signal is not valid anymore (meaning that you can hold your trade for longer, set Stop Loss to BE and let it ride, take partial profit or close it completely!).
  4. This indicator is a result of many years of experience and observation. It's solid and tested.
  5. Best to be used in higher timeframes (h1/h4) for better results and safer signals.

  6. An addition would be to use it with other indicators of mine like UR TrendExhaustion or UR VolumeTrend for better signal accuracy.

There is a special telegram chat on which you can stay up-to-date with the tools updates and also send request if you feel there is something missing!


Why UR 
DivergenceSpotter
 MT5 ?

As mentioned before - the indicator is a wrapped up experience into one single indicator. Coded it in a way so it's understandable to everyone. The indicator has also a feature when it signals when it is no longer valid (doesn't mean the market will reverse, it only means the signal is valid till there and the price may push further OR reverse - up to you to take (partial) profits or close your trade completely.

How to use UR DivergenceSpotter  MT5 ?

See description below to be more familiar with it:

SETTINGS
  • None

DISPLAY

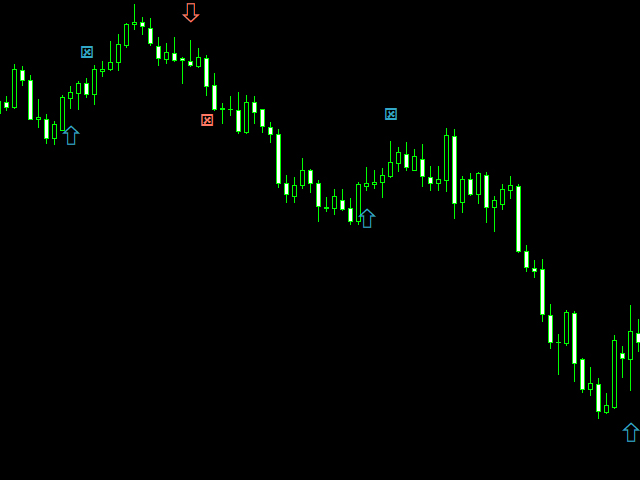
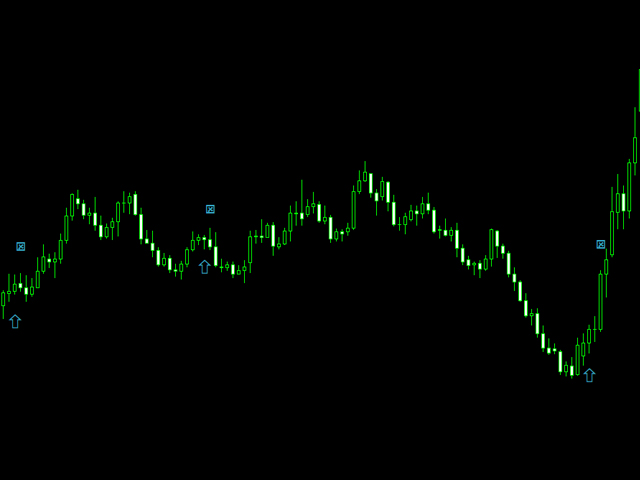
  • Arrows: Entry points - best to enter after candle creation. The indicators spots divergence between a few indicators and signals it with an arrow (with the direction).
  • X: Signal filled and no longer valid to enter - from there the price can either reverse or continue further - trade accordingly to your risk management.

ADDITION

  • All of my tools are working best when assembled. Meaning the accuracy of entry points is way better if used with UR TrendExhaustion, UR VolumeTrend or/and UR HighsAndLows.


Recommended products
Was: $249  Now: $99   Market Profile defines a number of day types that can help the trader to determine market behaviour. A key feature is the Value Area, representing the range of price action where 70% of trading took place. Understanding the Value Area can give traders valuable insight into market direction and establish the higher odds trade. It is an excellent addition to any system you may be using. Inspired by Jim Dalton’s book “Mind Over Markets”, this indicator is designed to suit the
Before installing the HeatMap indicator make sure you are using a broker that gives you access to the Depth of market (DOM) !! This indicator creates a heatmap on your chart allowing you to see the buy or sell limit orders easily and in real time. You have the possibility to change the setting and the colors of the HeatMap in order to adapt to all markets and all charts. Here is an example of a setting you can use with the NASDAQ100 on the AMPGlobal broker :  https://www.youtube.com/watch?v=x0
PZ Trend Trading MT5
PZ TRADING SLU
3.67 (3)
Trend Trading is an indicator designed to profit as much as possible from trends taking place in the market, by timing pullbacks and breakouts. It finds trading opportunities by analyzing what the price is doing during established trends. [ Installation Guide | Update Guide | Troubleshooting | FAQ | All Products ] Trade financial markets with confidence and efficiency Profit from established trends without getting whipsawed Recognize profitable pullbacks, breakouts and early reversals The ind
KT Renko Patterns MT5
KEENBASE SOFTWARE SOLUTIONS
KT Renko Patterns scans the Renko chart brick by brick to find some famous chart patterns that are frequently used by traders across the various financial markets. Compared to the time-based charts, patterns based trading is easier and more evident on Renko charts due to their uncluttered appearance. KT Renko Patterns features multiple Renko patterns, and many of these patterns are extensively explained in the book titled Profitable Trading with Renko Charts by Prashant Shah. A 100% automate
The indicator builds current quotes, which can be compared with historical ones and on this basis make a price movement forecast. The indicator has a text field for quick navigation to the desired date. Options: Symbol - selection of the symbol that the indicator will display; SymbolPeriod - selection of the period from which the indicator will take data; IndicatorColor - indicator color; Inverse - true reverses quotes, false - original view; Next are the settings of the te
Noize Absorption Index - is the manual trading system that measures the difference of pressure between bears forces and bulls forces. Green line - is a noize free index that showing curent situation. Zero value of index shows totally choppy/flat market.Values above zero level shows how powerfull bullish wave is and values below zero measures bearish forces.Up arrow appears on bearish market when it's ready to reverse, dn arrow appears on weak bullish market, as a result of reverse expectation.
Market Profile MetaTrader System  — is a classic Market Profile implementation that can show the price density over time, outlining the most important price levels, value area, and control value of a given trading session. This indicator can be attached to timeframes between M1 and D1 and will show the Market Profile for daily, weekly, monthly, or even intraday sessions. Lower timeframes offer higher precision. Higher timeframes are recommended for better visibility. It is also possible to use a
VolumeProfile MT5
Robert Hess
3.75 (8)
Description: The Volume Profile displays detailed informations of historical trading activities at certain price levels (Market Profile). Locate the areas with the best prices in the market and get an advantage over other market participants. Support: The indicator is constantly being developed and improved. Please do not hesitate to contact me via the MQL5 Platform. I am very grateful about any Bug report, so that i can constantly improve the indicator. I appreciate any public review for this
Blahtech Supply Demand MT5
Blahtech Limited
4.57 (14)
Was: $299  Now: $99   Supply Demand uses previous price action to identify potential imbalances between buyers and sellers. The key is to identify the better odds zones, not just the untouched ones. Blahtech Supply Demand indicator delivers functionality previously unavailable on any trading platform. This 4-in-1 indicator not only highlights the higher probability zones using a multi-criteria strength engine, but also combines it with multi-timeframe trend analysis, previously confirmed swings
No Demand No Supply MT5
Trade The Volume Waves Single Member P.C.
No Demand No Supply   This indicator identifies   No Demand –No Supply candles  to your chart and plots volume bars colored according to the signal. It can be applied to all timeframes or to a specific one only. It can also be used as regular volume indicator  with exceptional future of WEIGHTED VOLUME. Furthermore is has an alert notification, sound and email when a signals occurs. The indicator does not repaint but the alert will come on two candles back due to the definition of No Demand No S
Gioteen Volatility Index (GVI) - your ultimate solution to overcoming market unpredictability and maximizing trading opportunities. This revolutionary indicator helps you in lowering your losing trades due to choppy market movements. The GVI is designed to measure market volatility, providing you with valuable insights to identify the most favorable trading prospects. Its intuitive interface consists of a dynamic red line representing the volatility index, accompanied by blue line that indicate
Premium level is a unique indicator with more than 80% accuracy of correct predictions! This indicator has been tested for more than two months by the best Trading Specialists! The author's indicator you will not find anywhere else! From the screenshots you can see for yourself the accuracy of this tool! 1 is great for trading binary options with an expiration time of 1 candle. 2 works on all currency pairs, stocks, commodities, cryptocurrencies Instructions: As soon as the red ar
This indicator allows you to enjoy the two most popular products for analyzing request volumes and market deals at a favorable price: Actual Depth of Market Chart Actual Tick Footprint Volume Chart This product combines the power of both indicators and is provided as a single file. The functionality of Actual COMBO Depth of Market AND Tick Volume Chart is fully identical to the original indicators. You will enjoy the power of these two products combined into the single super-indicator! Below is
PipFinite Exit EDGE MT5
Karlo Wilson Vendiola
4.89 (35)
Did You Have A Profitable Trade But Suddenly Reversed? In a solid strategy, exiting a trade is equally important as entering. Exit EDGE helps maximize your current trade profit and avoid turning winning trades to losers. Never Miss An Exit Signal Again Monitor all pairs and timeframes in just 1 chart www.mql5.com/en/blogs/post/726558 How To Trade You can close your open trades as soon as you receive a signal Close your Buy orders if you receive an Exit Buy Signal. Close your Sell orde
Introducing "X Marks the Spot" – Your Ultimate MetaTrader 5 Indicator for Perfect Trades! Are you tired of the guesswork in trading? Ready to take your MetaTrader 5 experience to a whole new level? Look no further – "X Marks the Spot" is here to revolutionize your trading strategy! What is "X Marks the Spot"? "X Marks the Spot" is not just another indicator – it's your personal trading compass that works seamlessly on all timeframes . Whether you're a beginner or an experienced trader,
The best time to trade Using this Indicator is when the time reach exactly hour,half,45 minutes,15 minutes and sometimes 5 minutes.. This indicators is helpful to those who trade boom and crash indecies.How to read this indicator first you'll see Blue allow and Red allow all these allows used to indicate or to detect the spike which will happen so the allow happens soon before the spike happen.This indicator works properly only in boom and crash trading thing which you have to consider when
The indicator automatically calculates and plots Fibonacci support and resistance levels - one of the most effective tools for market analysis. The calculation uses the averaged price data for the selected period and timeframe. The minimum and maximum for this period are taken as the beginning and end of the movement. Fibonacci levels allow you to see potential reference points, around which the price movement can slow down or reverse, that is, they are used to predict further movement, as well
VR Grid Mt5
Vladimir Pastushak
3.6 (10)
The VR Grid indicator is designed to create a graphical grid with user-defined settings. Unlike the standard grid , VR Grid is used to build circular levels . Depending on the user's choice, the step between the round levels can be arbitrary. In addition, unlike other indicators and utilities, VR Grid maintains the position of the grid even when the time period changes or the terminal is rebooted. You can find settings, set files, demo versions, instructions, problem solving, at [blog] You can
FREE
This indicator will show you the TP and SL Values (in that currency) that you already set  for every orders on the charts  ( closed to the transaction/order line)  that will help you a lot to estimated your profit and loss for every order.    And it also show you the PIPs values too.  the shown format  is      " Currency Values of our Profit or Loss /  PIPs values ".    The TP Value will be shown in Green Color and  the SL Value  will be shown in Red Color.  For any question or more information,
Cumulative delta indicator As most traders believe, the price moves under the pressure of market buying or selling. When someone redeems an offer standing in the cup, the deal is a "buy". If someone pours into the bid standing in the cup - the deal goes with the direction of "sale". The delta is the difference between purchases and sales. A cumulative delta - the difference between the cumulative sum of purchases and sales for a certain period of time. It allows you to see who is currently contr
For a trader, trend is our friend. This is a trend indicator for MT5, can be used on any symbol. just load it to the terminal and you will see the current trend. green color means bullish trend and red means bearlish trend. you can also change the color by yourself when the indicator is loaded to the MT5 terminal the symbol and period is get from the terminal automaticly. How to use: I use this trend indicator on 2 terminals with different period  for the same symbol at same time. for example M5
Introduction to Chart Pattern MT Chart Pattern MT is a chart pattern scanner to detect the triangle pattern, falling wedge pattern, rising wedge pattern, channel pattern and so on. Chart Pattern MT uses highly sophisticated chart pattern detection algorithm. However, we have designed it in the easy to use with intuitive user interface. Chart Pattern MT will show all the patterns in your chart in the most efficient format for your trading. You do not have to do tedious manual pattern detection an
Your Trend Friend
Luigi Nunes Labigalini
The trend is your friend! Look at the color of the indicator and trade on that direction. It does not  repaint. After each candle is closed, that's the color of the trend. You can focus on shorter faster trends or major trends, just test what's most suitable for the symbol and timeframe you trade. Simply change the "Length" parameter and the indicator will automatically adapt. You can also change the color, thickness and style of the lines. Download and give it a try! There are big movements
HMA Trend Professional MT5
Pavel Zamoshnikov
4.4 (5)
Improved version of the free HMA Trend indicator (for MetaTrader 4) with statistical analysis. HMA Trend is a trend indicator based on the Hull Moving Average (HMA) with two periods. HMA with a slow period identifies the trend, while HMA with a fast period determines the short-term movements and signals in the trend direction. The main differences from the free version: Ability to predict the probability of a trend reversal using analysis of history data. Plotting statistical charts for analyz
To download MT4 version please click here . This is the exact conversion from TradingView: "WaveTrend [LazyBear]" By "zeusuk3". One of the coolest indicators out there to detect overbought and oversold zones. It can be used as a part of more complicated strategy and for confirming a potential trade setup. There are buffers to use in EAs also. The indicator is loaded light and non-repaint. - You can message in private chat for further changes you need. Thanks for downloading 
BoxChart MT5
Evgeny Shevtsov
5 (7)
The market is unfair if only because 10% of participants manage 90% of funds. An ordinary trader has slim changes to stand against these "vultures". This problem can be solved. You just need to be among these 10%, learn to predict their intentions and move with them. Volume is the only preemptive factor that faultlessly works on any timeframe and symbol. First, the volume appears and is accumulated, and only then the price moves. The price moves from one volume to another. Areas of volume accumu
Binary Options Assistant (BOA) Multi Currency Dashboard for Binary Options (MT5) . You can use any of the BOA Signals Indicators with the dashboard. Just change the BOA Signals Indicator Name in the dashboard settings to the indicator you want to get signals from. For example: CHILL. BLAZE:  BOA_BLAZE_Indicator_v1   Strategy :   BLW Online Trading Binary Options Strategy (3 Moving Average) LAVA:  BOA_LAVA_Indicator_v1   Strategy:   Lady Trader Binary Options Strategy (Bollinger Bands & Stoc
Indicator for determining flat and trend. If the price is below any of the two histograms and two lines (red and blue), this is a sell zone. When purchasing this version of the indicator, MT4 version for one real and one demo account - as a gift (to receive, write me a private message)! If the price is above any of the two histograms and two lines (red and blue), this is a buy zone. MT4 version:  https://www.mql5.com/ru/market/product/3793 If the price is between two lines or in the zone
Pullback Hunter
Anton Polkovnikov
PULLBACK HUNTER What is every trader's cherished dream? To see without delay the places where the reversal will happen. This, of course, is from the category of magic, though... nothing is impossible. But for now I've prepared for you an indicator that marks in real time the end of corrections to the current movement or in short - catches pullbacks.What is the main point? Many people practice rebounds when the price moves in the direction of the open position. And they do them on the formation o
Alpha Trend Pro
Eslam Mohamed Abdelrady Shehata
Alpha Trend Pro: Your Ultimate Trading Companion Embark on a new era of trading with Alpha Trend Pro Indicator. Crafted with precision and innovation, Alpha Trend is designed to elevate your trading experience by seamlessly blending powerful elements to navigate various market conditions. **Key Features:** **1. Dynamic Adaptability:**    - In sideways market conditions, Alpha Trend acts as a dead indicator. Say goodbye to many false signals and welcome a tool that adapts seamlessly to mar
Buyers of this product also purchase
First of all Its worth emphasizing here that this Trading System is Non-Repainting , Non-Redrawing and Non-Lagging Indicator , Which makes it ideal from both manual and robot trading .  The Smart Trend Trading System MT5 is a comprehensive trading solution tailored for new and experienced traders . It combines over 10 premium indicators and features more than 7 robust trading strategies , making it a versatile choice for diverse market conditions . Trend Following Strategy : Provides precise ent
Atomic Analyst MT5
Issam Kassas
5 (12)
First of all Its worth emphasizing here that this Trading Indicator is   Non-Repainting ,   Non-Redrawing   and   Non-Lagging   Indicator, Which makes it ideal from both manual and robot trading.  The Atomic Analyst  is a PA Price Action Indicator that uses Strength and Momentum of the price to find a better edge in the market. Equipped with an AI filter which help remove noises and false signals, and Increase Trading Potential. Using Multiple layers of complex Indicators, the Atomic Analyst
Quantum Trend Sniper
Bogdan Ion Puscasu
5 (37)
Introducing   Quantum Trend Sniper Indicator , the groundbreaking MQL5 Indicator that's transforming the way you identify and trade trend reversals! Developed by a team of experienced traders with trading experience of over 13 years,   Quantum Trend Sniper Indicator   is designed to propel your trading journey to new heights with its innovative way of identifying trend reversals with extremely high accuracy. ***Buy Quantum Trend Sniper Indicator and you could get Quantum Breakout Indicator fo
FX Volume MT5
Daniel Stein
4.94 (17)
Visit our all-new   Stein Investments Welcome Page   to get the latest information, updates and trading strategies. FX Volume is the FIRST and ONLY volume indicator that provides a REAL insight into the market sentiment from a broker's point of view. It provides awesome insights into how institutional market participants, like brokers, are positioned in the Forex market, much faster than COT reports. Seeing this information directly on your chart is the real game-changer and breakthrough solut
Advanced Supply Demand MT5
Bernhard Schweigert
4.53 (15)
Best Solution for any Newbie or Expert Trader! This indicator is a unique, high quality and affordable trading tool because we have incorporated a number of proprietary features and a new formula. With this update, you will be able to show double timeframe zones. You will not only be able to show a higher TF but to show both, the chart TF, PLUS the higher TF: SHOWING NESTED ZONES. All Supply Demand traders will love it. :) Important Information Revealed Maximize the potential of Advanced Suppl
TPSproTREND PrO MT5
Roman Podpora
5 (5)
TPSpro TRENDPRO  - is a trend indicator that automatically analyzes the market and provides information about the trend and each of its changes, as well as giving signals for entering trades without redrawing! The indicator uses each candle, analyzing them separately. referring to different impulses - up or down impulse. Exact entry points into transactions for currencies, crypto, metals, stocks, indices!  -  Version MT4                  DETAILED DESCRIPTION        /       TRADING SETUPS       
A key element in trading is zones or levels from which decisions to buy or sell a trading instrument are made. Despite attempts by major players to conceal their presence in the market, they inevitably leave traces. Our task was to learn how to identify these traces and interpret them correctly. Reversal First Impulse levels (RFI)   -  Version MT4                  INSTRUCTIONS                 RUS                 ENG                         R ecommended to use with an indicator   -  TREND PRO  
Top indicator for MT5   providing accurate signals to enter a trade without repainting! It can be applied to any financial assets:   forex, cryptocurrencies, metals, stocks, indices .  Watch  the video  (6:22) with an example of processing only one signal that paid off the indicator! MT4 version is here It will provide pretty accurate trading signals and tell you when it's best to open a trade and close it. Most traders improve their trading results during the first trading week with the help of
Gartley Hunter Multi
Siarhei Vashchylka
5 (5)
Gartley Hunter Multi - An indicator for searching for harmonic patterns simultaneously on dozens of trading instruments and on all classic timeframes: (m1, m5, m15, m30, H1, H4, D1, Wk, Mn). Manual (Be sure to read before purchasing) | Version for MT4 Advantages 1. Patterns: Gartley, Butterfly, Shark, Crab. Bat, Alternate Bat, Deep Crab, Cypher 2. Simultaneous search for patterns on dozens of trading instruments and on all classic timeframes 3. Search for patterns of all possible sizes. Fr
RelicusRoad Pro MT5
Relicus LLC
4.82 (22)
How many times have you bought a trading indicator with great back-tests, live account performance proof with fantastic numbers and stats all over the place but after using it, you end up blowing your account? You shouldn't trust a signal by itself, you need to know why it appeared in the first place, and that's what RelicusRoad Pro does best! NOW $147 (increasing to $499 after a few updates) - UNLIMITED ACCOUNTS (PCs or MACs) **  User Manual + Strategies + Training Videos + Private Group with
FX Power MT5 NG
Daniel Stein
5 (5)
Trading GOLD, and currencies, with the dog walk strategy  - super smart Trading GOLD, and currencies, with the breakout strategy  - super easy Visit our all-new   Stein Investments Welcome Page   to get the latest information, updates and trading strategies. FX Power MT5 NG  is the next generation of our long-time very popular currency strength meter, FX Power.  And what does this next-generation strength meter offer? Everything you have loved about the original FX Power  PLUS GOLD/XAU st
MetaForecast M5
Vahidreza Heidar Gholami
5 (2)
MetaForecast predicts and visualizes the future of any market using different powerful methods. While financial markets are not always predictable, if there are patterns in the past data, MetaForecast can learn and predict the future as accurately as possible. It features a complete implementation of neural networks embedded directly into the indicator, enabling traders to create and train AI models using data from multiple symbols to learn complex patterns. MetaForecast leverages your computer'
Professional Scalping Tool on Deriv Attention! The indicator will be sold in limited quantities!!! The previous 5 copies were sold for $250 The next 5 copies will be sold for $350 The next price is $500 Description: This trading indicator is designed for professional traders focused on scalping. Designed with the market in mind, it provides highly accurate spike trading signals. It works on the M1 timeframe and supports the following symbols: Boom 300 Index, Boom 500 Index, Boom 1000 Index,
Volume by Price MT5
Brian Collard
5 (3)
The Volume by Price Indicator for MetaTrader 5 features Volume Profile and Market Profile TPO (Time Price Opportunity). Get valuable insights out of currencies, equities and commodities data. Gain an edge trading financial markets. Volume and TPO histogram bar and line charts. Volume Footprint charts. TPO letter and block marker charts including split structures. Versatile segmentation and compositing methods. Static, dynamic and flexible ranges with relative and/or absolute visualizations. Lay
Black Dragon indicator mt5
Ramil Minniakhmetov
4.82 (56)
The trend detection indicator will compliment any strategy and can also be used as an independent tool. IMPORTANT! Contact me immediately after the purchase to get instructions and a bonus!  Benefits  Easy to use; does not overload the graphic wih unnecessary information. The ability to use as filter for any strategy. Contains bult -in dynamic levels of cupport and resistange,  which can be used both, for profit taking, and for settings up stop-losses. The indicator does not change color after t
Quantum Heiken Ashi PRO MT5
Bogdan Ion Puscasu
4.5 (8)
Introducing the Quantum Heiken Ashi PRO charts with integrated alerts Designed to provide clear insights into market trends, the Heiken Ashi candles are renowned for their ability to filter out noise and eliminate false signals. Say goodbye to confusing price fluctuations and hello to a smoother, more reliable chart representation. What makes the Quantum Heiken Ashi PRO truly unique is its innovative formula, which transforms traditional candlestick data into easy-to-read colored bars. Red and g
Introducing   Quantum Breakout PRO , the groundbreaking MQL5 Indicator that's transforming the way you trade Breakout Zones! Developed by a team of experienced traders with trading experience of over 13 years,   Quantum Breakout PRO   is designed to propel your trading journey to new heights with its innovative and dynamic breakout zone strategy. Quantum Breakout Indicator will give you signal arrows on breakout zones with 5 profit target zones and stop loss suggestion based on the breako
XQ Indicator MetaTrader 5
Marzena Maria Szmit
5 (1)
Step into the realm of Forex trading with confidence and precision using XQ, a cutting-edge Forex indicator designed to elevate your trading game to unprecedented heights. Whether you're a seasoned trader or just stepping into the world of currency exchange, XQ Forex Indicator empowers you with the insights and signals needed to make informed trading decisions. The signal conditions are a combination of three indicators, and XQ Forex Indicator only display  medium and long-term trends . The ind
Owl Smart Levels MT5
Sergey Ermolov
4.49 (37)
MT4 version  |   FAQ The Owl Smart Levels Indicator is a complete trading system within the one indicator that includes such popular market analysis tools as Bill Williams' advanced fractals , Valable ZigZag which builds the correct wave structure of the market, and Fibonacci levels which mark the exact levels of entry into the market and places to take profits. Detailed description of the strategy Instructions for working with the indicator Advisor-assistant in trading Owl Helper Private User
Good day! I present to you a trading technical indicator for Deriv broker synthetic indices. This indicator ONLY works with the following indices: Boom 300 Index Boom 500 Index Boom 1000 Index Crash 300 Index Crash 500 Index Crash 1000 Index The indicator was created to give signals to open medium-term trades in the direction of Spikes. But you can open trades in the opposite direction to Spikes, at your own risk. Trade only on M1. Other TFs do not guarantee the correct operation of the indic
Eng Gold
Ely Alkrar Xshkaky
ENG-GOLD Scalper It is an auxiliary indicator that identifies potential targets and determines the place of entry with a stop loss that works on Heiken Ashi candles  The green lines are usually the targets, the red lines are the stop loss, and the yellow lines are the entry location.  This file is recognized on small and medium frames, usually less than the watch frame I highly recommend using XAUUSD US100 US30 USOIL 
First of all Its worth emphasizing here that this Trading System is Non-Repainting, Non-Redrawing and Non-Lagging Indicator, Which makes it ideal for professional trading. The "Smart Support and Resistance Trading System" is an advanced indicator tailored for  new  and  experienced  traders. It empowers traders with precision and confidence in the forex market. This comprehensive system combines 7+ strategies, 10 indicators, and various trading approaches, including day trading strategy, swing
Malaysian SNR Levels
Matthias Horst Pieroth
This indicator can be used to display Support and Resistance levels according to  the  Malaysian SNR concept , in which Support and Resistance are exact levels of a line chart. Malaysian SNR There are 3 different horizontal levels in Malaysian SNR: A-Level : This level is located at the peak of this line chart. (shape looks like the letter A) V-Level : Level at the valley of a line chart, (shape looks like the letter V) Gap-Leve l: This level is located at the Close/Open gap between two cand
Gartley Hunter MT5
Siarhei Vashchylka
5 (13)
Gartley Hunter - An indicator for searching for harmonic patterns (Gartley patterns) and their projections. The indicator is equipped with a system of alerts and push notifications. Manual (Be sure to read before purchasing) | Version for MT4 Advantages 1. 12 harmonic patterns: 7 classical and 5 exotic. New patterns will be added as the indicator develops. 2. Constant automatic search for harmonic patterns. The indicator is capable of finding from the smallest to the largest patterns. 3. Autom
Best Solution for any Newbie or Expert Trader! This indicator is a unique, high quality and affordable trading tool because we have incorporated a number of proprietary features and a secret formula. With only ONE chart it gives Alerts for all 28 currency pairs. Imagine how your trading will improve because you are able to pinpoint the exact trigger point of a new trend or scalping opportunity! Built on new underlying algorithms it makes it even easier to identify and confirm potential trades.
Тем, кто изучил книги Билла Вильямса "Новые измерения в биржевой торговле" и "Торговый Хаос (второе издание)" и пробовал торговать по этим методикам, становится ясно, что стандартного набора индикаторов недостаточно для полноценной работы. Индикатор  Trading Chaos Map  рисует "карту рынка", позволяя вам видеть графики так же, как автор трилогии. В параметрах предусмотрены опции включения и отключения каждого сигнала. Вы можете использовать ту или иную методику, либо использовать их вместе. Может
The iPump indicator is a versatile indicator  that combines the advantages of three categories of indicators. simultaneous trend detection on several Timeframes defining zones of resistance and support determination of overbought and oversold zones Indicator functions: Defining a trend This function will be necessary for all traders who want to objectively assess the current market direction and avoid subjectivity. It will be clear and intuitive. Determination of support and resistance levels U
Golden Spikes Detector
Batsirayi L Marango
5 (1)
Golden Spikes Detector This indicator is based on an advanced strategy primarily for trading spikes on Boom and Crash Indices. Complex algorithms were implemented to detect high probability entries only. It alerts on potential Buy and Sell entries. To trade spikes on the Deriv or Binary broker, only take Buy Boom and Sell Cash alerts. It was optimised to be loaded on 5-minute timeframe although multiple timeframe analysis is done in the background. Features ·             Desktop pop up and sound
Royal Wave Pro M5
Vahidreza Heidar Gholami
3.5 (4)
Royal Wave is a Trend-Power oscillator which has been programmed to locate and signal low-risk entry and exit zones. Its core algorithm statistically analyzes the market and generates trading signals for overbought, oversold and low volatile areas. By using a well-designed alerting system, this indicator makes it easier to make proper decisions regarding where to enter and where to exit trades. Features Trend-Power Algorithm Low risk Entry Zones and Exit Zones Predictions for Overbought and Over
If you want to find good trading opportunities, then you must trade near the Trend Line. This allows you to have a tighter         stop loss   on your trades — which improves your       risk to reward . But that’s not all… Because if you combine Trend Line with Support and Resistance, that’s where you find the best trading opportunities. Now you might wonder: “So when do I enter a trade?” Well, you can use reversal     candlestick patterns   (like the   Hammer, Bullish Engulfing, etc.) as your e
More from author
UR Basket
Krzysztof Jan Debski
UR Basket   The best you can do is to protect your orders from turning into losses. You can now relax and let UR Basket take care of it. Advantages of using UR Basket: All parameters are dynamically changeable in the graphic panel on your chart - You DON'T need to restart the EA to change the parameters or recall what settings you used! You can track your orders through:  - Magic Number  - EA Comment  - Both of the above  - All of your trades at once UR Basket can track your profits through
UR Control Panel
Krzysztof Jan Debski
5 (2)
UR Control Panel   UR   Control Panel is a tool I want to share with you for FREE. It is an interactive Panel that helped me in my trading and boosted my market scanning each day. Hope it suits your needs aswell! How to use UR   Control Panel  ? It is an movable, resizable double panel of which: - One of them shows the currency strenght on the given timeframe - The other enables options to move between symbols and timeframes way quicker, using the same chart, and additionally shows resistance
FREE
UR DivergenceSpotter
Krzysztof Jan Debski
UR DivergenceSpotter   UR   DivergenceSpotter is the result of many years of experience and sometimes the easiest ways are the best. There is a good correlation between a few indicators, but when they mismatch - the price tries to "re-adjust" - and it's at that moment when we get a signal with UR DivergenceSpotter. Advantages of using UR Divergence Spotter: No parameters Doesn't repaint after the candle is created Signals when the signal is not valid anymore (meaning that you can hold your trade
UR VolumeTrend
Krzysztof Jan Debski
UR VolumeTrend   UR  VolumeTrend is the clearest volume indicator showing the ongoing trend in terms of volume. Works perfectly with other indicators just like UR TrendExhaustion to signal local tops and bottoms. Limited to just 2 parameters - the higher values, the longer trends it will show.  Gradient extremes show possible exhaustions of volume to catch a potential reversal. Two lines - The Volume trend and It's average. The best advantage: Easy and adjusted to all assets. There is a special
UR TrendExhaustion
Krzysztof Jan Debski
UR TrendExhaustion   UR   TrendExhaustion is the best solution for traders who don't want to deal with parameter values nor other set-ups - it is both easy and visually-understandable for everyone. Advantages of using UR TrendExhaustion: No parameters You have 3 lines that describe best what's going on on the chart:   Trend Exhaustion Line ,   Whale Money Line   and   Retail Money Line . The interface showcases the exhaustion of either line on both extremes (red areas) The best advantage: Easy a
UR HighsAndLows
Krzysztof Jan Debski
UR Highs&Lows   UR   Highs&Lows does an in-depth analysis of price movement and its volatility, and creates a channel within which the price is moving. That channel moves now as an oscillator and is overlayed with price's deviation to signal potential exhaustions and possible reversals. Advantages of using UR Highs&Lows : No parameters You have 3 lines that describe the price movement - White Line which is an average of the price, and Blue Lines which are its extremes The histogram is a visualiz
UR Momenter
Krzysztof Jan Debski
UR Momenter   UR   Momenter calculates perfectly the momentum of the price in correlation to the exhaustion of the price movement represented as an oscillator. Therefore this gives us really early signals of potential reversals or retracements. This formula was discovered in 2018 after market bubble burst. Advantages of using UR   Momenter   : No parameters You have 2 lines that describe the price movement - White Line which is the Momentum of the price in correlation to price's moving average d
UR FrontEndBackEnd
Krzysztof Jan Debski
UR FrontEndBackEnd   UR FrontEndBackEnd   is my favorite formula for finding the most accurate levels of support and resistance. I have also splitted those into different categories (dashed lines, solid lines and areas) to mark how strong they are. All is stored in buffers so they are easy to access and implement within other tools. Addition : The tool may need to be adjusted to the asset it is applied on - asset's differ in terms of nr of digis in the price which affects the tool. The needed
UR Gamma
Krzysztof Jan Debski
UR Gamma (powered by similar calculations found in Machine Learning systems) UR Gamma is a cutting-edge financial analysis tool that offers a new and improved take on the classic WaveTrend indicator. By incorporating advanced Digital Signal Processing techniques, UR Gamma addresses some of the limitations of traditional WaveTrend algorithms and provides a more accurate, robust and dynamic approach to identifying and measuring trends in price action. Advantages of using UR Gamma: Minimalist
UR Bands
Krzysztof Jan Debski
UR Bands (with a Formula used in Machine Learning systems) UR Bands   is a n indicator derived through a formula that incorporates market volatility is similar in principle to those used in machine learning systems. This mathematical representation of market conditions offers a precise analysis of price trends and dynamics, taking into account the inherent volatility of financial markets. By incorporating volatility as a variable, the indicator provides a more accurate and dependable representa
UR Vortex
Krzysztof Jan Debski
UR Vortex The Probabilistic UR Vortex Formula: An Accurate System for Predictive Market Analysis using Volatility and Standard Deviation Calculations. The   UR Vortex   indicator is a technical analysis tool that uses volatility and standard deviation calculations to predict potential tops and bottoms in a market. It measures the strength of a trend by calculating the distance between the current price and a moving average, and then standardizing this distance by dividing it by the average true
UR PulseScalp
Krzysztof Jan Debski
UR PulseScalp A calibrated trading indicator for scalpers seeking the ultimate edge in fast-paced markets UR PulseScalp is a cutting-edge trading solution for scalpers seeking the ultimate edge in fast-paced markets. This innovative indicator is built on a scientifically-calibrated formula that blends the power of Volatility, MoneyFlow and Relative Strength to create a highly accurate and reliable signal. Advantages of using UR  PulseScalp : Comfortable Interactive Panel Highly Accurate on
UR TradeManager
Krzysztof Jan Debski
UR_TradeManager for MetaTrader 4 Initial words Hey Trader! Fist of all - this tool is created by a trader that codes, not by a coder that trades. Therefore it is minimalistic in UI, but maximizes automation and processes so the user doesn't have to rely heavily on the documentation to get to know the workflow. Also the Labels are formatted in comprehensible way, and my main goal was to provide a tool that is understandable to the user, no matter what kind of trading background he has. The tool i
UR Basket MT5
Krzysztof Jan Debski
UR Basket MT5   The best you can do is to protect your orders from turning into losses. You can now relax and let UR Basket take care of it. Advantages of using UR Basket: All parameters are dynamically changeable in the graphic panel on your chart - You DON'T need to restart the EA to change the parameters or recall what settings you used! You can track your orders through:  - Magic Number  - EA Comment  - Both of the above  - All of your trades at once UR Basket can track your profits thro
UR VolumeTrend MT5
Krzysztof Jan Debski
UR VolumeTrend MT5   UR  VolumeTrend MT5 is the clearest volume indicator showing the ongoing trend in terms of volume. Works perfectly with other indicators just like UR TrendExhaustion to signal local tops and bottoms. Limited to just 2 parameters - the higher values, the longer trends it will show.  Gradient extremes show possible exhaustions of volume to catch a potential reversal. Two lines - The Volume trend and It's average. The best advantage: Easy and adjusted to all assets. There is a
UR TrendExhaustion MT5   UR   TrendExhaustion  MT5 is the best solution for traders who don't want to deal with parameter values nor other set-ups - it is both easy and visually-understandable for everyone. Advantages of using UR TrendExhaustion MT5: No parameters You have 3 lines that describe best what's going on on the chart:   Trend Exhaustion Line ,   Whale Money Line   and   Retail Money Line . The interface showcases the exhaustion of either line on both extremes (red areas) The best adva
UR HighsAndLows MT5
Krzysztof Jan Debski
UR Highs&Lows MT5   UR   Highs&Lows MT5 does an in-depth analysis of price movement and its volatility, and creates a channel within which the price is moving. That channel moves now as an oscillator and is overlayed with price's deviation to signal potential exhaustions and possible reversals. Advantages of using UR   Highs&Lows MT5   : No parameters You have 3 lines that describe the price movement - White Line which is an average of the price, and Blue Lines which are its extremes The histogr
UR Momenter MT5
Krzysztof Jan Debski
UR Momenter MT5   UR   Momenter  MT5 calculates perfectly the momentum of the price in correlation to the exhaustion of the price movement represented as an oscillator. Therefore this gives us really early signals of potential reversals or retracements. This formula was discovered in 2018 after market bubble burst. Advantages of using UR     Momenter MT5   : No parameters You have 2 lines that describe the price movement - White Line which is the Momentum of the price in correlation to price's m
UR FrontEndBackEnd MT5   UR FrontEndBackEnd MT5   is my favorite formula for finding the most accurate levels of support and resistance. I have also splitted those into different categories (dashed lines, solid lines and areas) to mark how strong they are. All is stored in buffers so they are easy to access and implement within other tools. Addition : The tool may need to be adjusted to the asset it is applied on - asset's differ in terms of nr of digis in the price which affects the tool. Th
UR Gamma MT5
Krzysztof Jan Debski
UR Gamma MT5 (powered by similar calculations found in Machine Learning systems) UR Gamma MT5   is a cutting-edge financial analysis tool that offers a new and improved take on the classic WaveTrend indicator. By incorporating advanced Digital Signal Processing techniques, UR Gamma addresses some of the limitations of traditional WaveTrend algorithms and provides a more accurate, robust and dynamic approach to identifying and measuring trends in price action. Advantages of using UR Gamma MT5
UR Bands MT5
Krzysztof Jan Debski
UR Bands MT5 (with a Formula used in Machine Learning systems) UR Bands MT5   is a n indicator derived through a formula that incorporates market volatility is similar in principle to those used in machine learning systems. This mathematical representation of market conditions offers a precise analysis of price trends and dynamics, taking into account the inherent volatility of financial markets. By incorporating volatility as a variable, the indicator provides a more accurate and dependable re
UR Vortex MT5
Krzysztof Jan Debski
UR Vortex MT5 The Probabilistic UR Vortex Formula: An Accurate System for Predictive Market Analysis using Volatility and Standard Deviation Calculations. The UR Vortex MT5 indicator is a technical analysis tool that uses volatility and standard deviation calculations to predict potential tops and bottoms in a market. It measures the strength of a trend by calculating the distance between the current price and a moving average, and then standardizing this distance by dividing it by the average
UR PulseScalp MT5
Krzysztof Jan Debski
UR PulseScalp MT5 A calibrated trading indicator for scalpers seeking the ultimate edge in fast-paced markets UR PulseScalp MT5   is a cutting-edge trading solution for scalpers seeking the ultimate edge in fast-paced markets. This innovative indicator is built on a scientifically-calibrated formula that blends the power of Volatility, MoneyFlow and Relative Strength to create a highly accurate and reliable signal. Advantages of using UR  PulseScalp MT5 : Comfortable Interactive Panel Highly
UR TradeManager MT5
Krzysztof Jan Debski
UR_TradeManager for MetaTrader 5 Initial words Hey Trader! Fist of all - this tool is created by a trader that codes, not by a coder that trades. Therefore it is minimalistic in UI, but maximizes automation and processes so the user doesn't have to rely heavily on the documentation to get to know the workflow. Also the Labels are formatted in comprehensible way, and my main goal was to provide a tool that is understandable to the user, no matter what kind of trading background he has. The tool i
Filter:
No reviews
Reply to review
Version 4.0 2022.07.22
Updated Credentials.